

PM Images/DigitalVision via Getty Images
Some demand destruction due to high prices, particularly gasoline. Shortage of new vehicles not helpful for spending on durable goods.
Consumers have been shifting spending from goods back to services since last year, following the stimulus-fueled spending binge on goods into the summer of 2021, and the collapse in spending on discretionary services during the pandemic. Given the magnitude of inflation these days, we will discuss all income and spending measures here in inflation-adjusted (or “real”) terms.
Spending on services rose in May, but spending on goods fell – all adjusted for inflation. The decline in spending on goods was in part driven by the decline in inflation-adjusted spending on gasoline, where the price spike is now destroying some demand, as measured in barrels per day. This economic phenomenon of “demand destruction” by spiking prices is also visible in used vehicles, and some other goods. Spending on durable goods continues to be handicapped by the ongoing shortage of new vehicles.
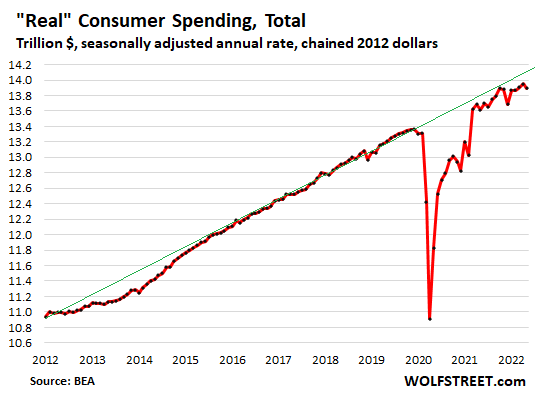
And overall spending, adjusted for inflation, dipped 0.4% in May from April, the first month-to-month dip in five months, according to the Bureau of Economic Analysis on Thursday, but was up 2.1% from the stimulus fueled binge a year ago, and was up by 5.2% from May 2019. It remains below the pre-pandemic trend (green line):
Spending shifts back to services
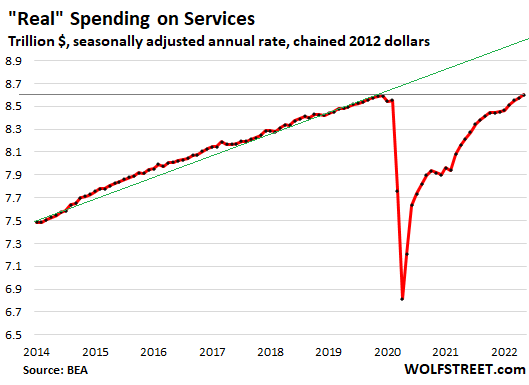
“Real” spending on services – healthcare, housing, education, air fares, hotels, rental cars, entertainment and sports events, haircuts, all types of repairs, subscriptions for communications, internet, and streaming services, etc. – rose by 0.3% in May from April, and by 4.7% year-over-year, and by 1.2% from May 2019, having now edged past the pre-pandemic high for the first time. But it remains well below pre-pandemic trend (green line in the chart below).
As consumer spending patterns continued to normalize, the share of spending on services rose to 61.9% of total spending, the highest since before the pandemic, and up from the 59% range during the stimulus-fueled goods-spending binge last spring. But consumers have some way to go: The share of spending on services remains below the 64% range that prevailed during normal times.
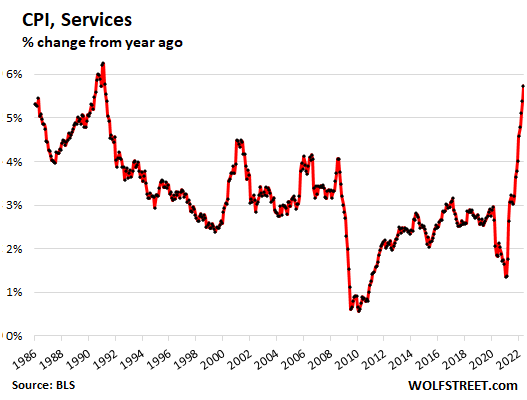
In terms of inflation, this shift in demand from goods to services is also showing up in the CPIs for durable goods, where some of the blistering heat is getting less hot, and in the CPI for services, which has started to spike:
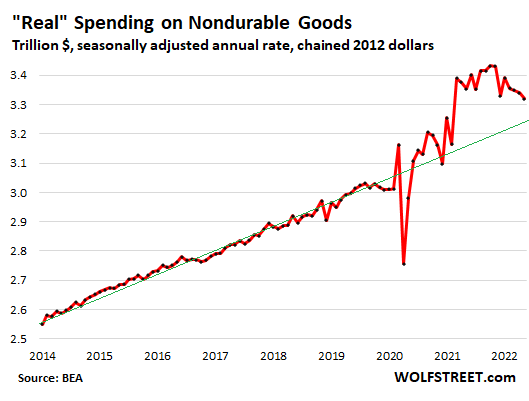
“Real” spending on nondurable goods, after stimulus binge, declined, still at high levels
Inflation-adjusted spending on nondurable goods – food, fuel, household supplies, etc. – declined by 0.6% in May from April, and was down by 1.0% from the stimulus-miracle spike in May 2021. It was still up by 10.8% from May 2019, and is reverting to pre-pandemic trend (green line).
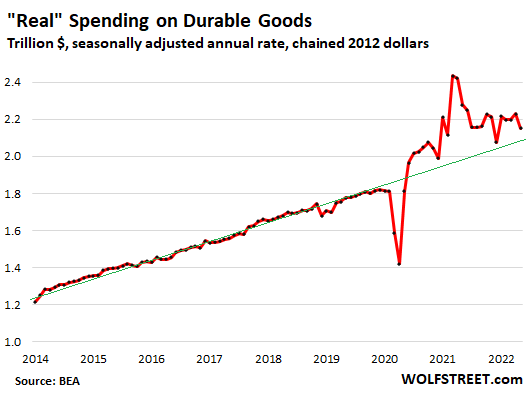
“Real” spending on durable goods falls, still at high levels
Inflation-adjusted spending on durable goods fell by 3.5% in May from April, and was down by 5.6% from the fading stimulus miracle in May 2021, but was still up by 21.1% from May 2019, and remains above pre-pandemic trend.
The biggest component in spending on durable goods is new and used vehicles. Spending on new vehicles is limited by new vehicle shortages – consumers cannot buy what dealers don’t have – and new-vehicle inventories remain desperately low, and sales are way down because of these shortages.
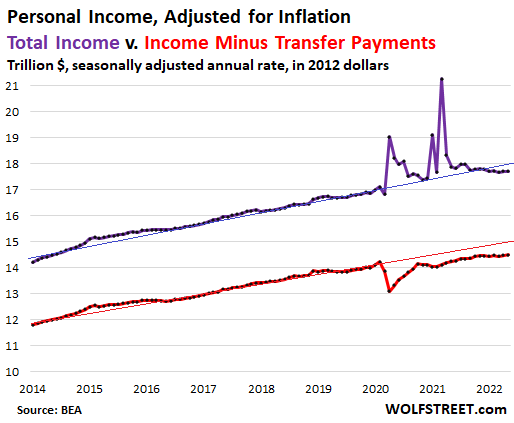
“Real” income below pre-pandemic trend
Personal income from all sources and adjusted for inflation dipped 0.1% in May from April, and fell by 1.0% from a year ago when the stimulus money was still flooding into consumers’ coffers. This includes income from wages and salaries, dividends, interest, rentals, farms, businesses, and government transfer payments (stimulus, Social Security, unemployment, welfare, etc.), but does not include capital gains. This real income from all sources was up 6.0% from May 2019 (purple line).
Personal income without transfer payments and adjusted for inflation edged up by 0.1% in May from April, and by 1.8% from a year ago, and was up by 4.7% from May 2019. It has remained stubbornly below pre-pandemic trend as income increases have not kept up with inflation (red line).
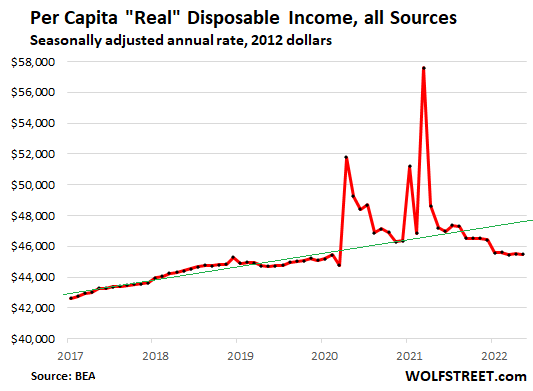
Per-capita disposable income, adjusted for inflation… you guessed it
The income trends laid out above describe dynamics in the overall economy by all consumers combined – they’re designed to be a measure of overall income, and not of the income of the average consumer. The difference between the two is population growth, which cuts the income pie into more slices.
Then there is an additional element: taxes. After consumers get through paying taxes on their incomes, what’s left is “disposable income.”
Those common economic terms are a hoot when you accidentally think too long about them: The consumer’s sole purpose in the world is to “consume,” which means spend their income, first on taxes, and then “dispose” of the remainder by paying for other goods and services.
This per-capita disposable income – per-person after-tax income from all sources – adjusted for inflation, dipped 0.1% in May from April, and was down 3.6% from a year ago, but was still up 1.8% from May 2019.
After coming down sharply from the stimulus miracle period, per-capita “real” disposable income has remained essentially unchanged for four months. It fell below pre-pandemic trend in September last year, as inflation began to out-surge incomes, and has since then fallen further below pre-pandemic trends:
Editor’s Note: The summary bullets for this article were chosen by Seeking Alpha editors.
Be the first to comment