

Ingus Kruklitis/iStock via Getty Images
Investment Thesis
For all of those who studied finance, Consolidated Edison (NYSE:ED), or ED, is a household name. Name a book related to investment analysis, and the name of Consolidated Edison appears in it. It is this way that I first started following ED. Over the past 10 years, I followed it and valued it multiple times, using any technique I would find fit at the time. In that period, I purchased ED two times, the latest being in February 2021 for a price of USD 67 per share. During this ten-year period, ED faced many challenges. This time, as ever, ED is faced with new challenges of increasing energy prices, aging infrastructure and the need to become aligned with the global decarbonization goals. The analysis below will show why I decided to sell my holdings in ED at a much lower price than of that today.
Business overview
ED is a regulated utility holding company operating in the New York area, through various subsidiary companies. These are:
- Consolidated Edison Company of New York, Inc. (CECONY) – provides electric service and gas service in New York City and Westchester County and steam service in parts of Manhattan;
- Orange & Rockland Utilities (O&R) – with its utility subsidiary, Rockland Electric Company (RECO) – provides electric service in southeastern NY and northern NJ and gas service in southeastern NY (O&R, together with CECONY makes up for ED Utilities segment);
- Con Edison Clean Energy Businesses – owns and operates renewable and sustainable energy infrastructure projects and provides energy-related products and services to wholesale and retail customers;
- Con Edison Transmission – invests in electric transmission projects supporting Con Edison’s effort to transition to clean, renewable energy and manages, through joint ventures, both electric and gas assets while seeking to develop electric transmission projects. This segment being of special interest historically due to failed gas pipeline projects.
Organization structure (2021 Earnings Release Presentation)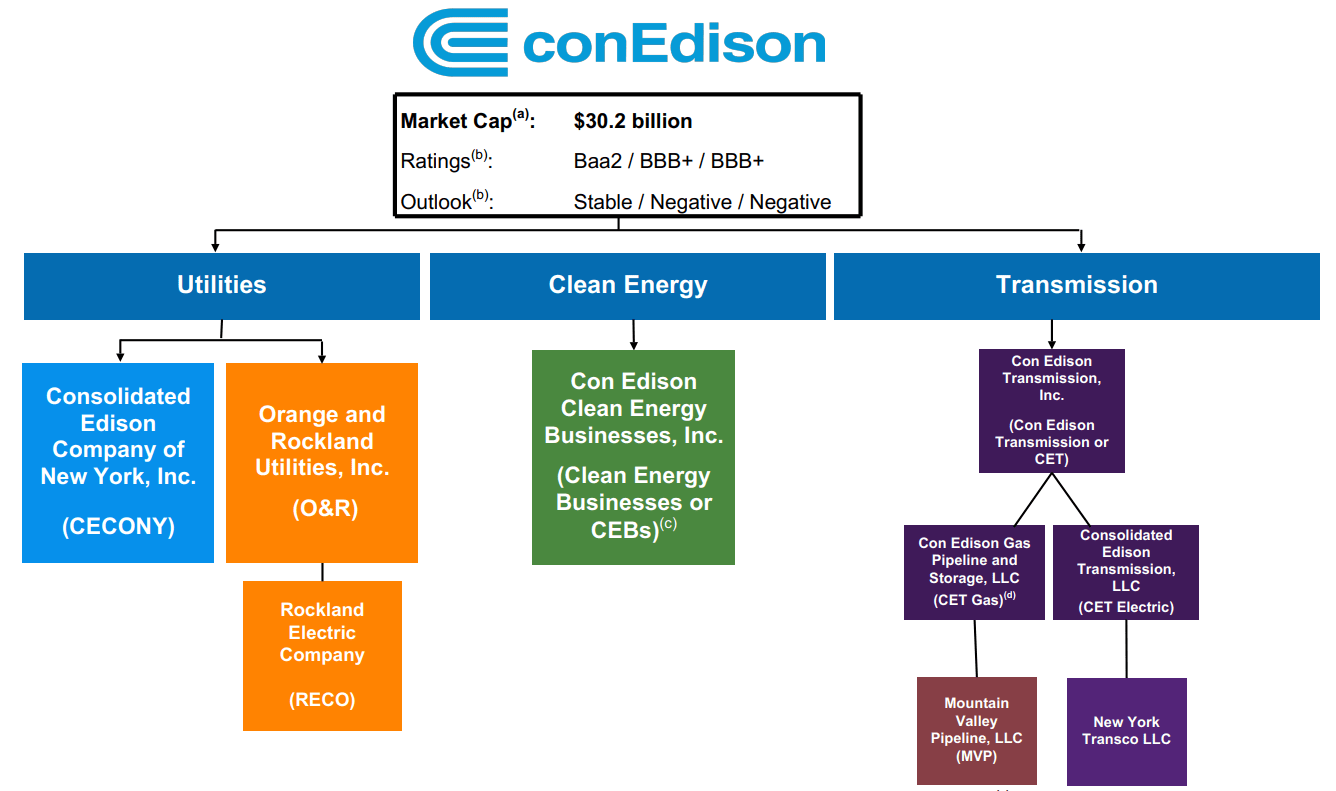
Out of the specified subsidiaries, CECONY, O&R and RECO operate as regulated utilities and are responsible for the majority of ED’s results. In a simplified way, regulated utilities have an operating model where their net result is decoupled from their revenue generation. As they are regulated, periodically they have to apply to the NY Department of Public Service and request rate increases which should, taking into account their current and expected capital structure, result in a targeted return on equity which is estimated by the regulatory authority. In theory, this approach should enable utilities to focus on maintenance and development of efficient infrastructure, instead of revenue optimization, and enable them to rely on capital markets when additional capital is required.
As a result of it being a regulated utility, ED’s revenues and net results are in theory more predictable than for most private corporation. In a simplified way, revenue requirements for utilities are calculated using the following formula:
R = B * WACC (1-t) + E + d + T
where:
R – revenue requirement,
B – rate base, which is the amount of capital or assets the utility dedicates to providing its regulated services (these historical and planned numbers are provided in EDs annual report),
WACC (1-t) – after tax cost of capital (these historical and planned numbers are provided in EDs annual report),
E – operating expenses, which are the costs of items such as supplies, labor (not used for plant construction), and items for resale that are consumed by the business in a short period of time (less than one year),
d – annual depreciation expense, which is the annual accounting charge for wear, tear, and obsolescence of plant, and T – all taxes not counted as operating expenses and not directly charged to customers.
Calculated revenue requirement for next year, should in theory equal charged revenue. In cases where less or more revenue is charged, the difference is either carried forward or deducted from future periods. In case that full revenue requirement is charged and there are no unexpected losses, ED should be able to achieve its approved return on equity of 8.82%.
Similar to ED, other regulated utilities in the USA operate in the same way, making them one of the most predictable profitable private corporations in the last twenty years. The below chart shows cost and profitability metrics for the USA electric utilities in the last 10 years, and most importantly during different interest rate regimes of the economy.
Return and cost of capital for US Utilities sector (Author’s Calculation)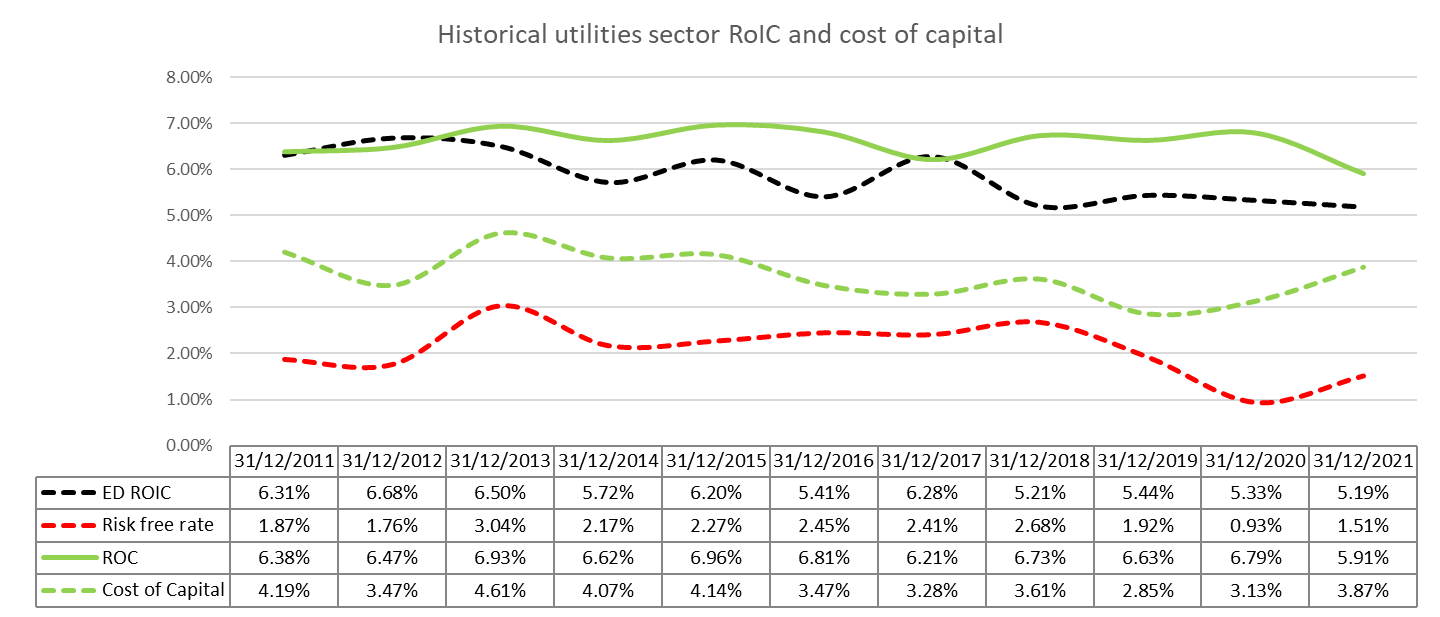
The figure below benchmarks ED’s performance versus the overall sector using equity measures.
Return on equity and cost of equity for US Utilities sector (Author’s Calculations)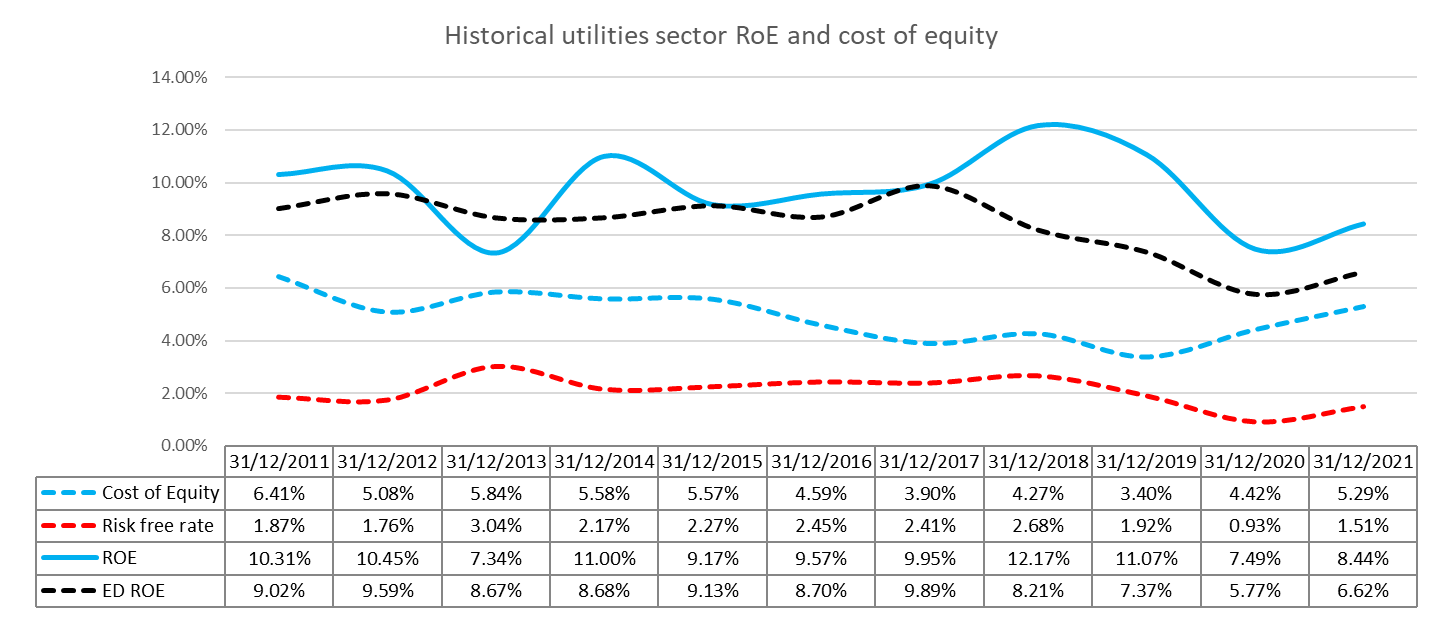
Although hard to believe, the figures above show that the returns on equity and capital for the Utilities sector show a low level of sensitivity to interest rate movements. Just to note, I use 10 year US T-bond rate as the risk-free rate.
It is this stability and predictability of the results that has made the utilities sector a perfect escape vessel in times of crisis as we are experiencing now.
However, while there is a limit to how much they can earn, utilities are responsible for bad capital allocation decision they make. In the case of ED, the last four years were severely impacted by the failed gas pipeline (Mountain Valley Pipeline LLC) and gas storage facilities (Stagecoach Gas Services LLC) projects. These two projects combined required an investment of USD 1.5 billion, but ultimately resulted in almost 70% loss on investment.
Both of these projects were in ownership of CET Gas. Currently, CET Gas owns a 10.2% interest (expected to be reduced to 8.5% based on the current project cost estimate) in Mountain Valley Pipeline LLC (MVP) and During 2021, CET Gas sold its 50 percent interest in Stagecoach Gas Services LLC (Stagecoach).
Recent Developments
Like the rest of Utilities sector, ED stock price has grown significantly since the middle of December 2021. Especially since the start of the war in Europe.
Annual Total Return of Utilities Sector (koyfin.com)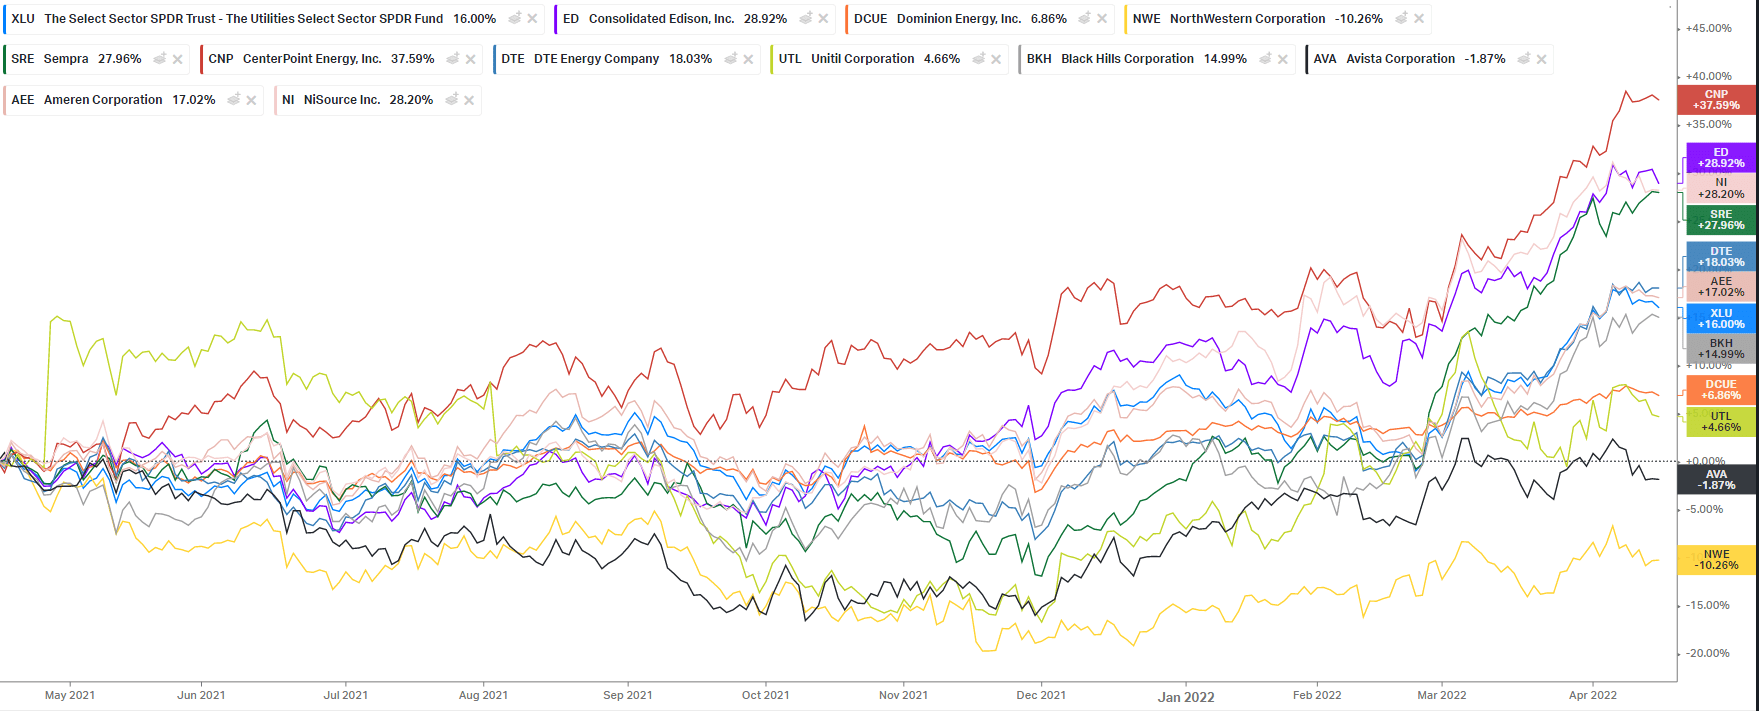
Prior to the start of the conflict, ED did release its results indicating a shift to the better after a few years of sub par performance.
On the balance sheet side, ED started seeing improvements in its net results after almost complete wind-down of its Stagecoach and MVM projects.
Profitability metrics (tikr.com)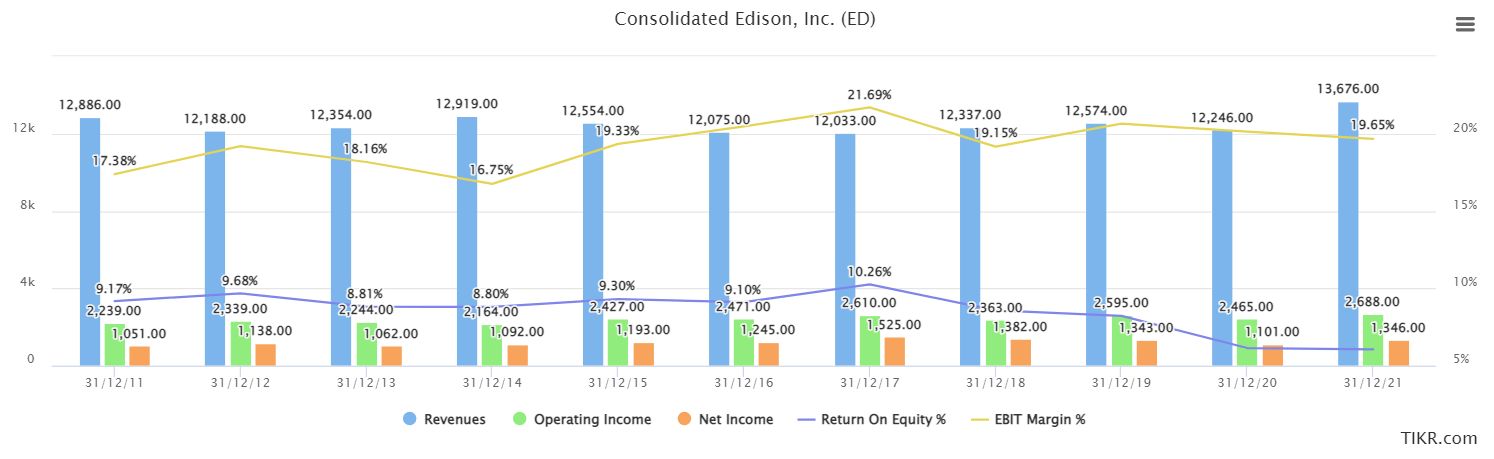
The decision to end these projects should lead to increased profitability in years to come, as its bottom line would not be burdened with write-off expenses as in previous years.
During 2020, there was an increased fear that ED will not be able to collect all of its revenues due to suspension of utility disconnections by CECONY and O&R as one of Covid relief measures. Since November 2021, both were allowed to resume disconnections and late payment charges for the year ending 2020. Part of 2020 late charges in total of USD 73 million were recognized as income in 2021, although they are still to be collected. However, even if this does not materialize, the impact on the result would be small.
On the balance sheet side, ED continues to reduce its relative debt burden. It might be unfortunate that this is not due to net lending but equity issuance, but at least new debt was placed in a favorable interest rate environment.
Financing sources (tikr.com)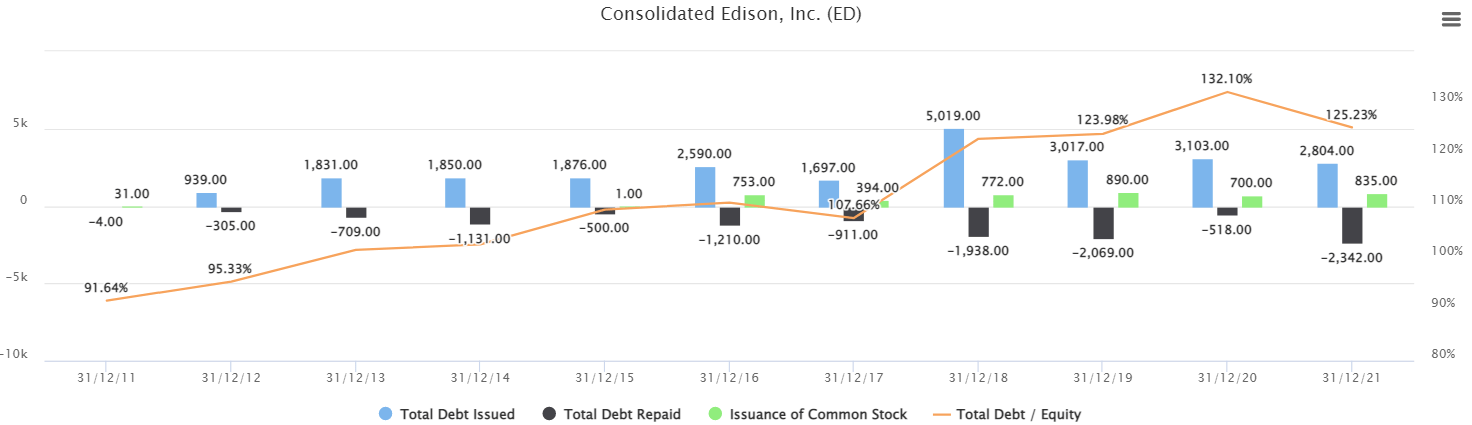
As for capital expenditure, the last two years show significant additional expenditure that has grown total property plant and equipment value, and as a result rate base (total NPP minus accumulated depreciation) to the level where ED may have a case in asking for an increase in its revenue requirements.
Capital expenditure (tikr.com)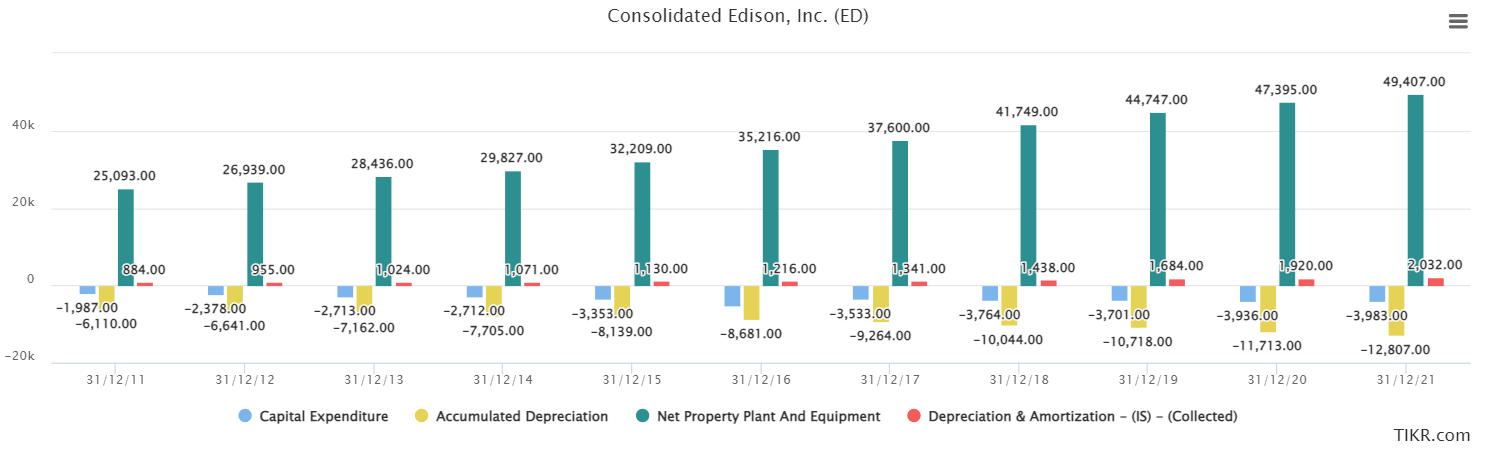
A disproportionate part of these investments were channeled into its Clean Energy business, which according to some information might be separated from ED. All information we have at this point is that ED “will explore strategic alternatives”, however no one knows whether a full unit sale, spinoff or asset sales would be a part of that deal.
Asset distribution per business line (tikr.com)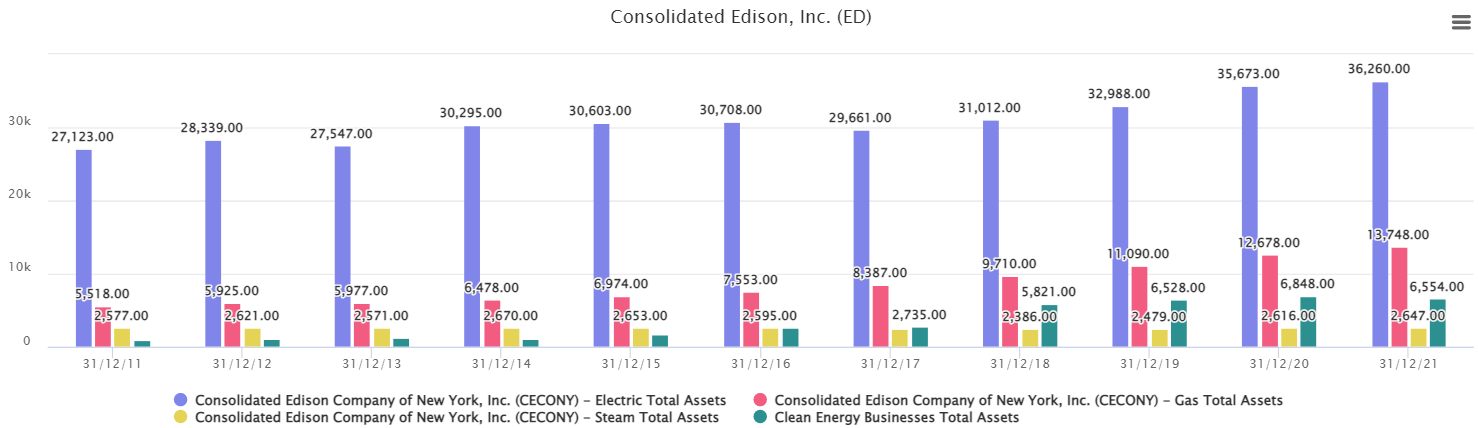
My suspicion regarding its CEB is that ED would like to use favorable investment sentiment towards green energy production to maximize on the value of this business, and keep only regulated utilities under its holding. Its CEB does sound like a success story in the making, but it is also susceptible to technological disruption as any new significant technological advances in solar production could cause write offs for its assets in the future.
As for the rate base balances for regulated utilities, ED provided their expectations on their development in years to come. For me, this is an important number, since I use it to derive my future revenue expectations.
Rate Base Development (ED 2021 Annual Report)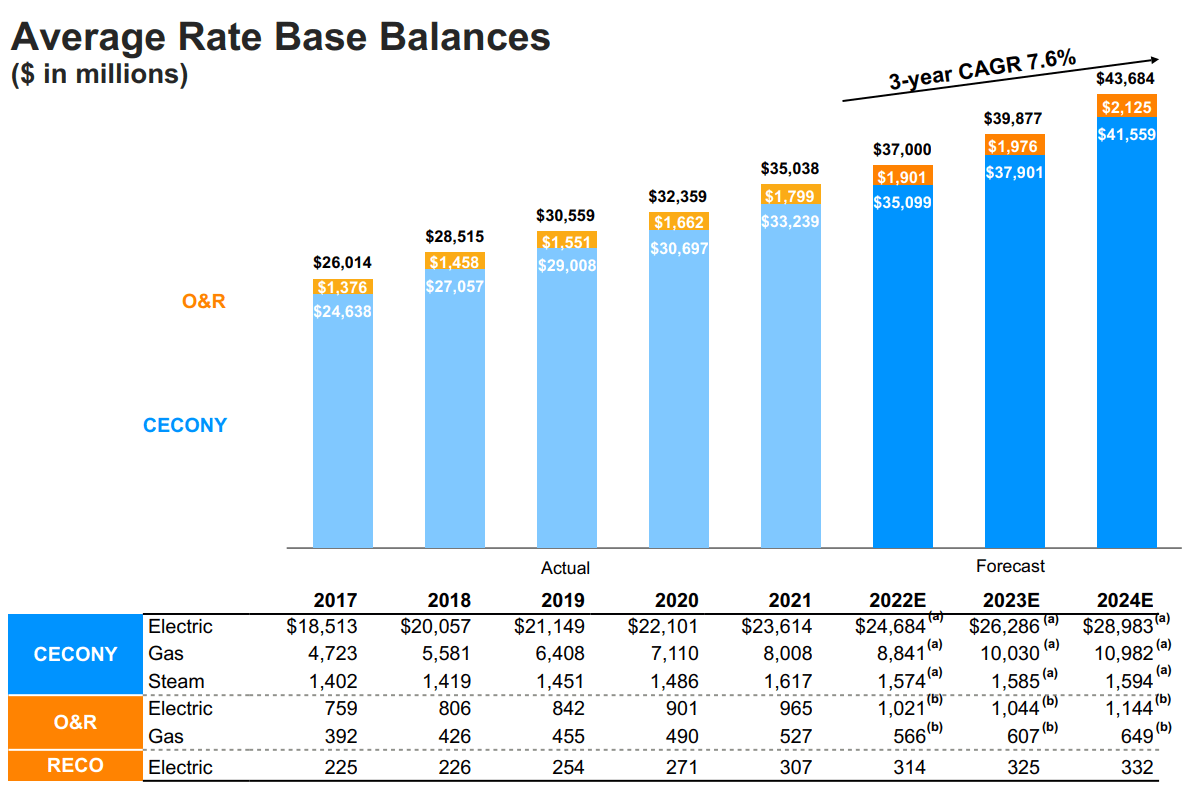
This should, in theory at least, lead to significant year-on-year revenue growth that is unusual for ED. In my revenue growth assumptions, I provide more details on this.
Lastly, ED provided it plans for capital sourcing for the next three years. As the figure below shows, the existing mix of debt and equity will be preserved as the old debt gets repaid and new debt together with new equity is raised.
Financing plan (ED 2021 annual result presentation)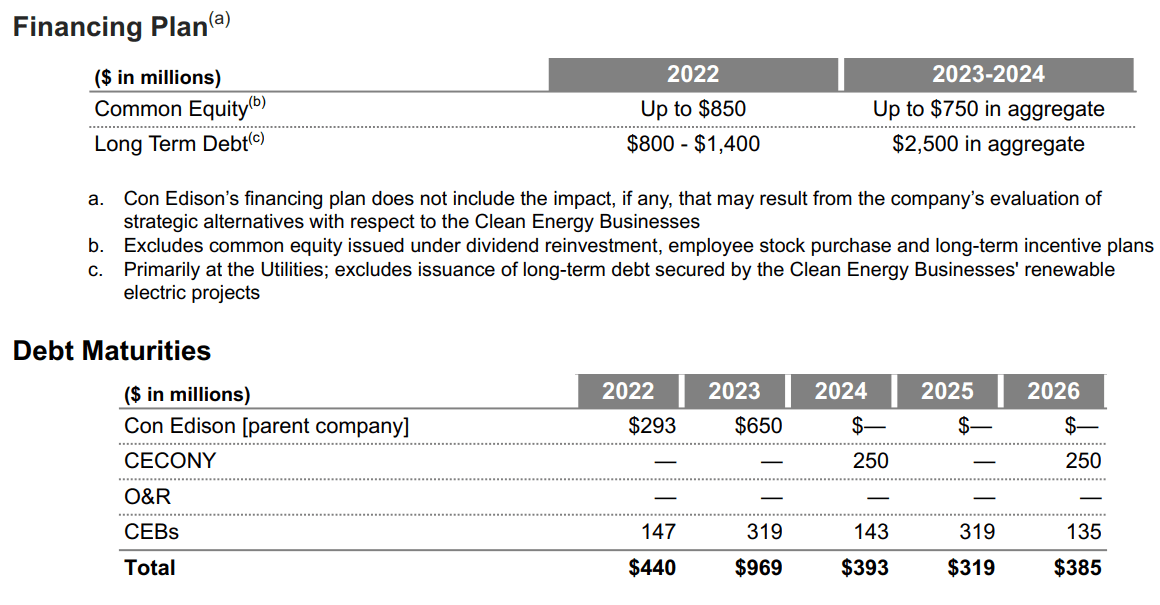
This is positive information to know, as debt covenants on a consolidated level limit the share of consolidated debt to consolidated total capital not to exceed 67.5%, which would be treated as a default event on debt. Currently it is 46.59%, compared to 47.58% last year.
Intrinsic Valuation Assumptions and Considerations
To calculate the fair value of ED, I used a three-stage discounted free cash flow model, assuming the following stages of development:
- Higher than historical growth in revenue due to increased capital investments in base rate expansion.
- Revenue growth slowdown as the volume of capital investments shifts from expanding capacities to maintaining existing ones.
- Stable growth in line with the long term inflation expectation, with maintained status of regulated utility.
The company’s operating cash flows were valued as a going concern and discounted back at an estimated cost of capital. Cash and cash equivalents were added back, minority interest, expected cost of legal settlements and the market value of debt and leased properties were taken out to arrive at a total value of equity. Total equity value was then divided by the current total number of ED shares outstanding to obtain an initial value per share.
The following are the assumptions I used in the intrinsic value calculation for them:
Revenue growth
For the next three years, I assumed growth in revenues is an average of 3.8% (3.5% for next year and 4% for years 2 to 5). This amount might seem high, but based on the disclosed plans for capital investments and increase in base rate, I was able to derive expected revenues based on the formula for revenue requirement described in the previous section. An overview of the calculation I used is shown in the table below:
ED revenue requirement (Author’s Calculation)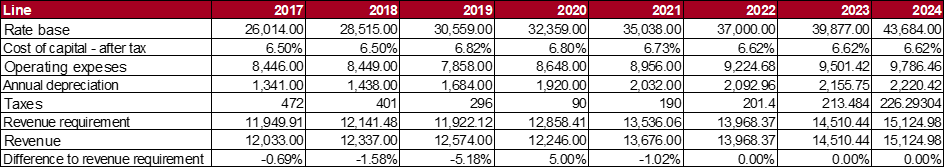
Target Operating Margins
After I readjusted ED’s operating margin to account for the operating leases which I treat as debt, the margin I have as my starting point is 19.87% (compared with 19.65% without adjustment).
In the last five years, ED’s operating margin was in a range between 19% and 21%, which is also close to the utilities sector average of 19.23%. I assumed that over time, ED will keep this level.
ED operating margin (tikr.com)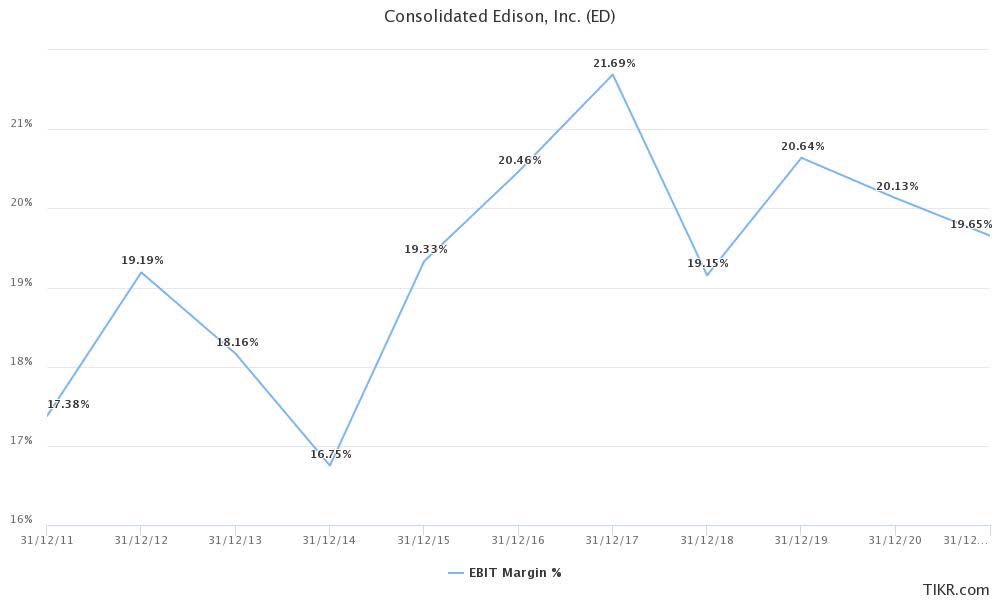
Reinvestment assumptions
Assessing the reinvestment needs for ED is a crucial element in my view of its future. If ED is to be successful in funding and executing its investment strategy, by definition, it will earn its approved return on capital and return on equity. However, if capital allocation follows the example of MVM pipeline and Stagecoach, its returns will be suboptimal.
Measured through the sales to capital ratio, where capital is equal to the sum of total equity and interest bearing debt, I then estimated the future capital needs as a function of expected revenue and ED’s disclosed capital investment plans.
ED is undergoing significant new investments in its renewable energy production capacities, as well as modernization and efficiency improvements of the existing capacities. In total, USD 15.7 billion are planned to be invested in infrastructure development and maintenance in the next three years.
Planned capital allocation (ED 2021 earnings release presentation)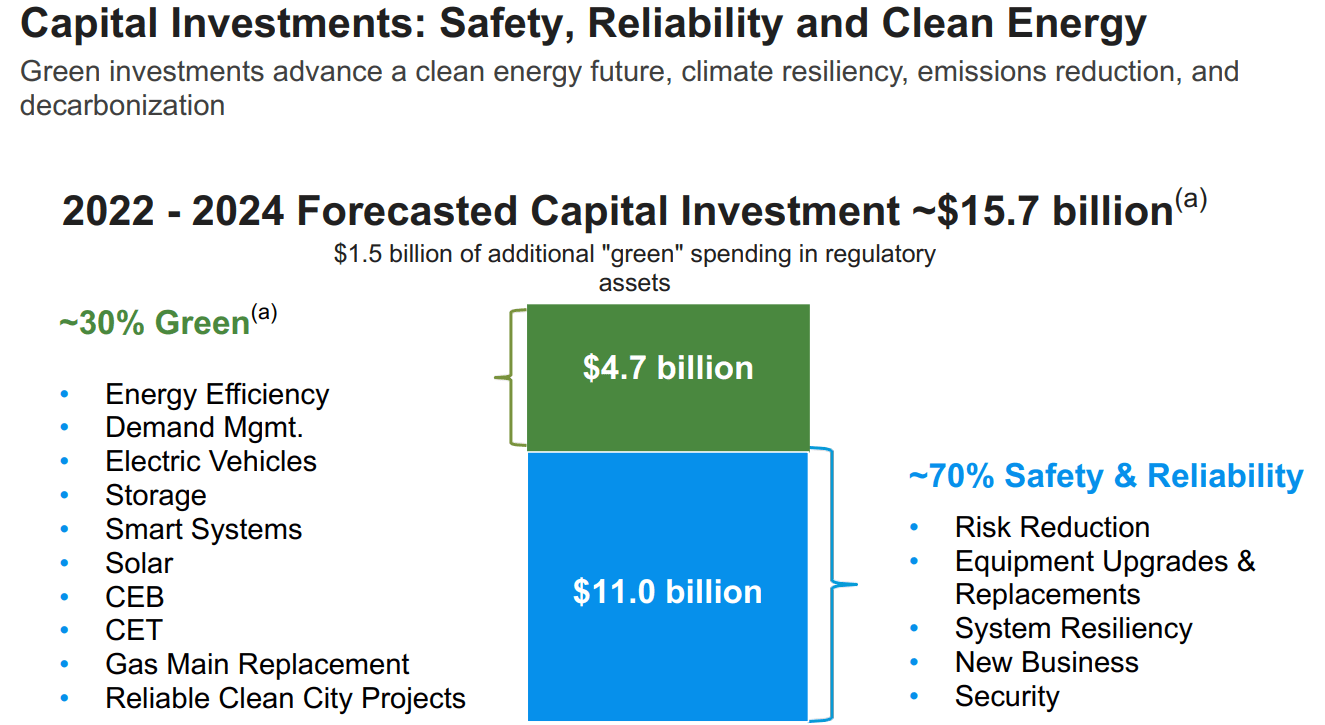
After a few years of reduced capital expenditure, this is welcomed news, as all these projects are approved with high estimated ROE. However, some risk is also tied to these investments, as history showed with Stagecoach Gas Services LLC and Mountain Valley Pipeline LLC, which were also heralded as great investments in gas transportation and storage facilities, only to be one of the bigger investment disasters ED has made in this century.
Overview of capital investments (ED 2021 earnings presentation)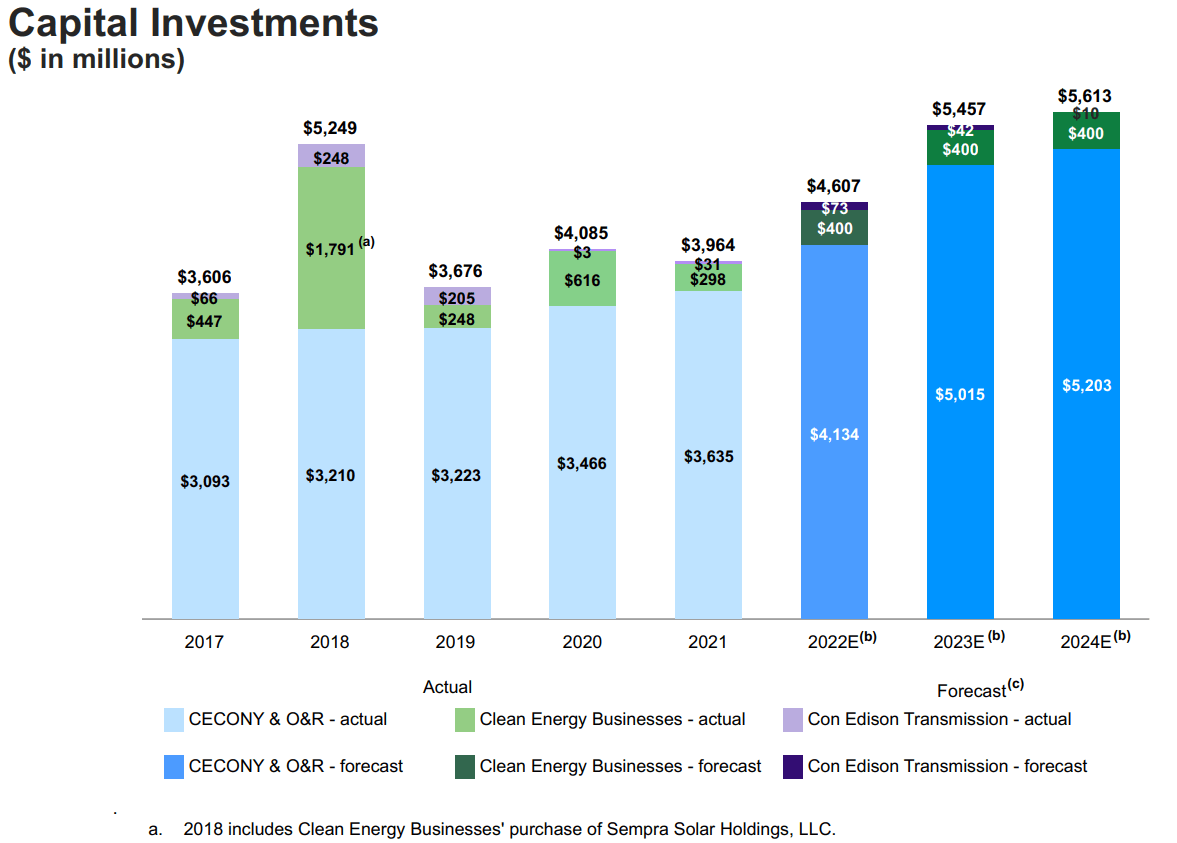
Regarding the last two mentioned projects, ED successfully completed the sale of their remaining stake in Stagecoach gas facility for USD 629 million, with an after tax loss of USD 147 for the part that was not so far written off. In the same time, further write-offs were made for Mountain Valley Pipeline (MVP) were an additional USD 231 million, reducing its net carry value to USD 111 million. I would be surprised if by next year, the value of MVP is not fully written down, with additional maintenance costs remaining after that. Just to note, ED cash investments in these two project were approximately USD 1 billion and USD 530 million respectively. The total loss incurred on these two projects was close to the average net result achieved by ED in the last ten years.
Based on the numbers above for years 2022 and 2024 I assumed that ED will have to collect an additional dollar of capital for each 20 cents increase in future revenues. This translates to a sales to capital ratio of 0.2. I then assumed that over time it will gradually converge to its long term average sales to capital ratio of 0.5 and stay at that level in perpetuity. The level of sales to capital of 0.5 is more representative of the overall utilities sector in the last 10 years and corresponds to the level of investments needed for capacity maintenance instead of aggressive expansion.
Sales to Capital Development (Author’s Calculation)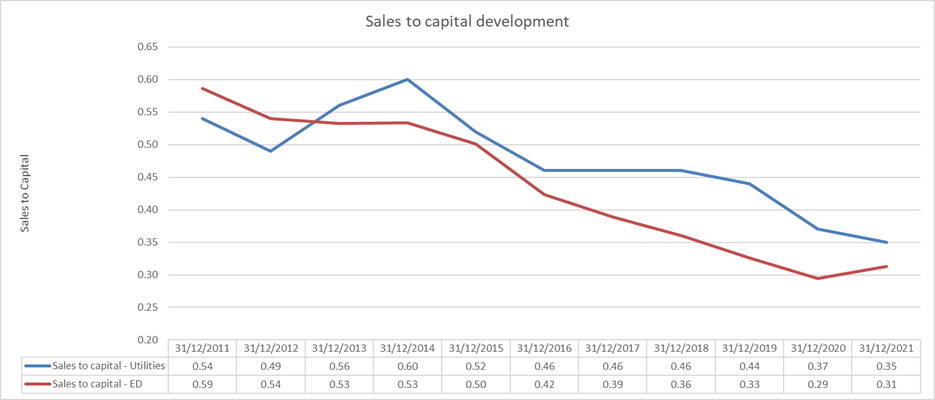
However, I will subject this assumption to my scenario analysis and allow my estimates to vary around it.
Cost Of Capital
For cost of capital, I estimated cost of equity from the market-implied equity risk premium and I added a regional risk spread (largely based on CDS spreads) based on where revenues were earned. For ED, since its revenues are generated in the USA alone, I used a risk premium of 5% corresponding to the current USA environment. I used an average bottom-up business beta from utilities companies and levered the beta to ED’s own adjusted debt/equity ratio. Multiplying the equity risk premium by the computed beta and adding it to the risk-free rate sums to a total cost of equity. The estimation was performed using April 17, 2022 values.
Cost of equity (Author’s Calculation)
Cost of capital is then derived as the weighted average of cost of equity and cost of borrowing net of tax, based on ED’s ‘BBB+’ credit rating:
Cost of capital (Author’s Calculation)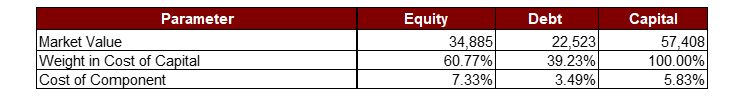
Legal costs
ED is a subject of several legal proceedings, which might result in additional costs if and when they are settled. I used average estimates provided in its 2021 10-K report to calculate the total sum of pending costs. The following table summarizes these values:
Legal costs overview (Author’s Calculations)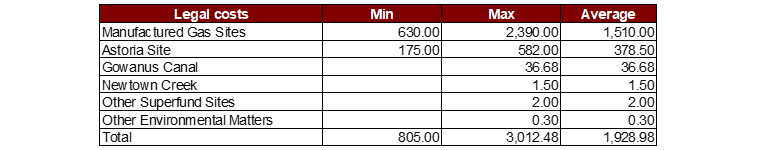
Terminal cash flow value
For value of the terminal cash flow, the following assumptions were used:
Terminal Value Assumptions (Author’s Calculations)
Although it may not seem so, the crucial assumption for my value estimation here is risk-free rate after year 10. Since the level of interest rates should also affect my estimates of cost of capital and return on capital. Because of this, I expressed these two numbers as a function of the risk-free rate. This has enabled me to simulate different levels of interest rates and see the impact on my valuation. As for the revenue growth rate in perpetuity, I have deliberately limited it to the long term level of expected inflation. Historically, even this assumption might be too optimistic for ED.
Valuation results
Values projected and discounted by these assumptions are as follows:
After Tax Operating Income Forecast (Author’s Calculation)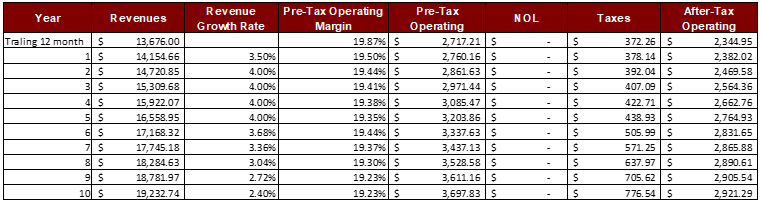
As mentioned, I expect revenue growth to slow down as the current green transition and capacity improvement initiative is finalized. I should also note that I expect that the current effective tax rate of 13.70% will approach 21% by year 10.
Free Cash Flow to the Firm Forecast (Author’s Calculation)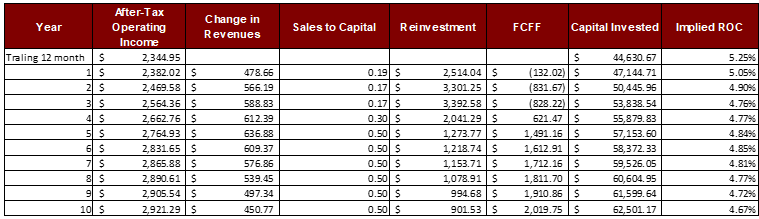
Although revenues will grow, so will the reinvestment needs. One might notice that in next three years I only show some USD 9.2 billion as reinvestment requirement. At the same time, I treat depreciation costs as real costs that require additional investments to maintain and improve existing capacities. In total, some USD 6.5 billion of depreciation is included as cost in my after tax operating income for first three years. What is also implied in my forecasts is that ED will have to collect additional capital on debt and equity markets to fund this aggressive capital investment plan.
Discounted Cash Flows (Author’s Calculation)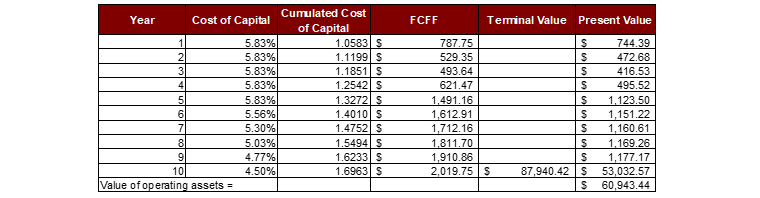
With my assumptions for cost of capital, this results in total value of the operating assets of USD 60.9 billion.
From this value, I then subtracted book value of debt of USD 25,286 million, minority interest of USD 299 million, expected amount of legal fees of USD 1,929 million, and I added back available cash and cash equivalents of USD 992 million. Resulting in the estimated fair value of equity of USD 31,220.98 million. Using the current count of 354.09 million shares outstanding, this implies a fair value per share of USD 88.17. ED was trading at USD 98.52 as of 17th April 2022. To put it from a different perspective, if you agree with my FCFF estimates, current price would yield an implied return of 4.08%.
Since my baseline valuation is sensitive to my assumptions, I ran simulations around those I am most unsure of. The following assumption ranges and distributions were used:
Assumption Ranges Used in Simulations (Author’s Calculation)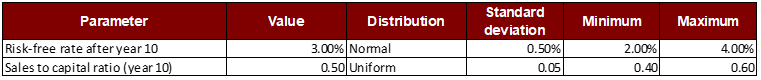
The following results were obtained.
Simulation Results (Author’s Calculation)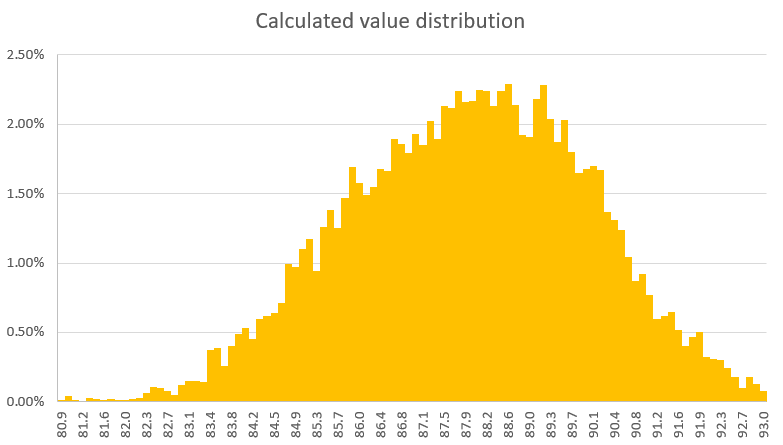
This results in a median present value per one share of USD 87.86. Which is significantly below current market price of USD 98.52.
Simulation Summary (Author’s Calculation)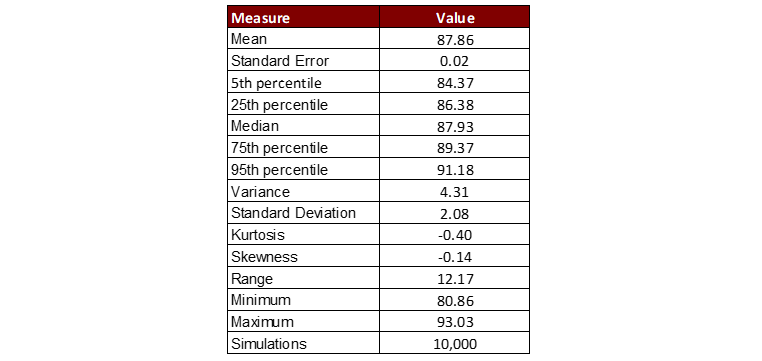
Summary
In the past five years, I owned ED two times. Last time, I sold it at the end of December 2022 for USD 83.5 per share, once it approached my then fair estimate of its value. Since I operate from the EU, development in the EU/USD exchange rate also was favorable then. I reasoned that it was much more likely at that point that something can go wrong with ED or the global economy, than ED would go beyond it regulatory set profitability targets. I still think so. In hindsight, I regret the missed capital gains, but l managed to invest these funds in other more undervalued companies I have previously written about. I am reluctant to advise others what to do with their shares, and I can only share what I did. If I were a retired person, or close to retirement, I would continue holding ED, ignoring price movements and enjoy its ever-growing dividend. Your choices ultimately depend on your expectations and preferences. I hope this article at least gave you alternative insights.
Call For Comments
What is your view on the future development of ED? Do you think that potential spin-off of the Clean Energy business can help ED in the long term, and how? Express your opinion, provide alternative assumptions and different opinions in the comment section below, and I will happily rerun my analysis using your inputs.
Be the first to comment