

Just_Super/iStock via Getty Images
Article Purpose
When considering purchasing an ETF, most investors first pull up a chart of the fund’s historical performance. One, three, five, and ten-year charts are often used, but my view is that they can potentially mislead investors. An ETF’s returns can be heavily influenced by one or two great years early in the time series that might not repeat. You don’t want to stay invested in that ETF over five or ten years, hoping for lightning to strike twice. We have ARKK for that.
This article isn’t specific to any fund but analyzes large-cap ETFs with at least a ten-year history. I’ve organized 73 by segment (value, blend, growth) and calculated their rolling six-month returns from September 2012 to August 2022. Each ETF is ranked by its worst, average, median, and best six-month returns, and I’ve used those rankings to calculate a fifth metric: consistency. I think it will make much more sense as we look at the results, so with that said, let’s get started.
Large-Cap Value ETFs
Including dividend-focused ETFs, there are 19 large-cap value ETFs with at least a ten-year history. The three largest by AUM are the Vanguard Value ETF (VTV), the Vanguard Dividend Appreciation ETF (VIG), and the iShares Russell 1000 Value ETF (IWD), but it’s only the first two that score well on all the metrics I’ve analyzed. IWD is consistently poor, as its average six-month return is fifth-worse.
The following table summarizes how each ETF scores in terms of worst returns, average returns, median returns, best returns, and consistent returns. I determined consistency based on the variance between the average and median figures. If you think about what a perfectly normal distribution looks like (i.e., bell curve), the average and median values are equal. In other words, returns aren’t skewed by extreme values on either end. I’ve also added ten-year rankings and an overall ranking, which is merely an average of all rankings and used for guidance purposes.
The Sunday Investor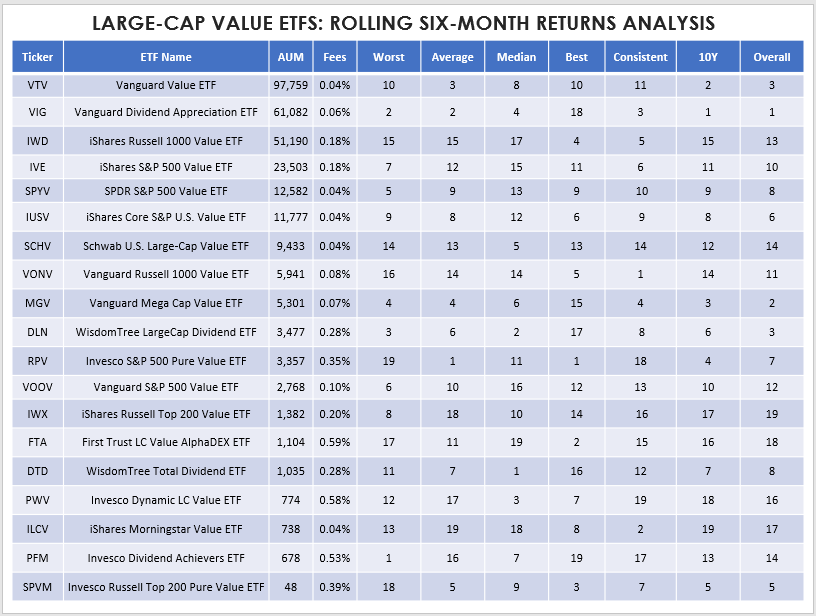
VIG was the best-performing ETF over the last ten years, gaining 207.52%, and it’s done that by being consistent. VIG ranks third on consistency and second on having the best “worst” six-month return period: a 15.69% decline from January to June 2022. That made VIG the worst performer for that particular period, as I cautioned one month prior. Still, VTV, IWD, and RPV lost 18.93%, 21.36%, and 37.22% between October 2019 and March 2020, so VIG was better off overall.
I believe you should be careful with ETFs like RPV that score poorly on consistency. It’s ranked #1 for having the best six-month return period (55.38% from November 2020 to April 2021), but you must have either great timing or strong nerves to suffer through those sizable losses.
MGV is an ETF that I think is great for passive investors. Like VTV and VIG, its success is due to its consistency. MGV has the fourth-best worst, average, and consistency scores, the third-best ten-year returns, but only the 15th best “best” returns. It doesn’t matter, though. An ETF that can limit losses in down periods has less catching up to do. Let these ETFs form the core portion of your portfolio, and you can take calculated risks with the others when opportunities present themselves.
Large-Cap Blend ETFs
I track 35 large-cap blend ETFs with at least a ten-year history, led by the SPDR S&P 500 Trust ETF (SPY), with nearly $350 billion in net assets. SPY, IVV, VOO, VTI, and ITOT gained between 230% and 240% over the last ten years, so you couldn’t go wrong with any of these top funds.
The Sunday Investor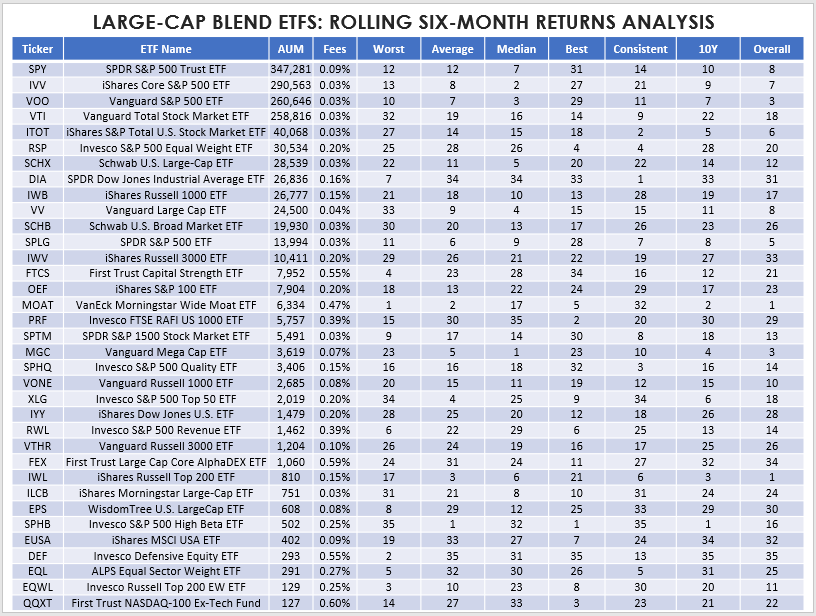
Over the last ten years, the best performer was the Invesco S&P 500 High Beta ETF (SPHB), gaining 268%. It makes sense, as that’s what high-beta ETFs do in long-running bull markets. However, it also had the worst six-month period, losing 27.77% from October 2019 to March 2020. That’s 6.62% worse than its nearest competitor, RSP, which lost 21.15% over the same period.
MOAT has delivered an exceptional 261% gain over the last ten years, and although it’s not very consistent, it tends to have strong “best” and “worst” periods relative to its peers. For example, it declined just 11.65% from October 2019 to March 2020, which was seventh-best behind MGC, SPHQ, IWL, OEF, QQXT, and XLG. However, it ended the six months ending April 2021 up 37.87%, good enough for fourth place behind SPHB, PRF, and RSP. I’ve studied the fund numerous times and found that its strength is being in the right sectors at the right time. Even if you don’t own it, it’s worth checking out its sector compositions each quarter to see how they align with your own. My latest review is here, and I’ll provide another update this week.
DIA is technically the most consistent ETF listed, but like IWD, it’s consistently bad: 34th-best average and median returns, along with a 33rd “best” ranking, won’t cut it. In my view, the key for passive investors is to find an ETF that scores reasonably well in all categories, and one standout is MGC. Its ten-year 243% gain is fourth-best, and its best and worst scores place 23rd. Investors likely don’t have much to worry about as it relates to significantly lagging the market, but at the same time, there’s a solid chance of outperformance.
Large-Cap Growth ETFs
There are 19 large-cap growth ETFs in my database with a ten-year track record, with the Invesco QQQ ETF (QQQ) being the largest by assets under management. QQQ has also been the best overall performer, gaining 383% over the last ten years. By comparison, VUG, the second-largest by AUM, is up 277%, which is relatively poor for the category.
The Sunday Investor
Given the recent declines, growth investors may want to consider alternatives. One of my top choices is the iShares Russell Top 200 Growth ETF (IWY). I’m still looking for a higher margin of safety, but it ranks well across the board and is a little less volatile than QQQ, with similar growth and valuation.
Based on these metrics, VONG looks strong. It ranks 5th best over the last ten years and third on consistency. It also has better growth potential than QQQ, is more diversified, and trades at a nearly identical forward earnings multiple.
Investment Recommendation
Investors know past performance isn’t indicative of future results, yet it’s the first thing many of us do when considering a new investment. While numbers don’t lie, proper due diligence requires more than a simple look at an ETF’s five- and ten-year returns. In this analysis, I identified several funds with excellent long-term track records but were influenced by a few strong periods that may not repeat.
My recommendation, especially for passive investors, is to focus on consistency. ETFs like VTV, MGV, SPY, IWY, and VONG are unlikely to end up as duds. If you can settle on a strategic asset allocation between value, blend, and growth based on your risk tolerance and outlook for the markets, you’ll likely do quite well in the long run.
Finally, I’ve calculated these metrics for 334 ETFs across 30 categories. This article focused on the large-caps, but if you found this article helpful and want more information on other ETFs, please let me know below in the comments.
Be the first to comment