

jetcityimage
Conagra (NYSE:CAG) reported FY Q4 results on July 14th, beating expectations on earnings but missing on revenues. Revenue was up more than 6% year-on-year. The impact of inflation on packaged food companies depends on the ability to raise product prices to offset increased costs of inputs, with consideration of customers’ price sensitivity. CAG appears to be navigating this process successfully. In addition, there is evidence that many large companies are raising prices at a higher rate than the costs of input commodities. U.S. companies’ pre-tax profits are at an all-time high and many companies report raising prices more than what is needed to cover increased costs.
Seeking Alpha
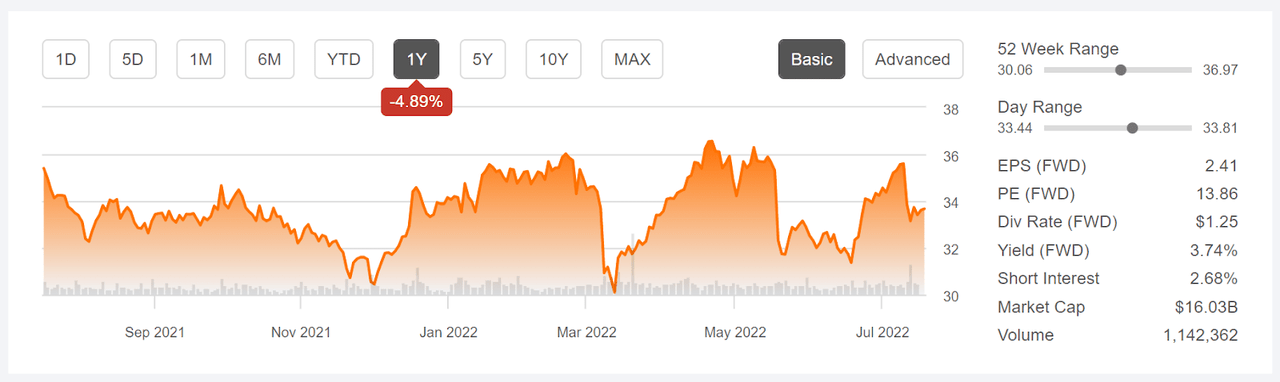
12-Month price history and basic statistics for CAG (Source: Seeking Alpha)
The share price has fallen over the past 12 months, but the total return for this period (including dividends) is -0.57%, as compared to -3.8% for the packaged food industry as a whole (as defined by Morningstar) and -10.2% for the S&P 500 (SPY).
ETrade
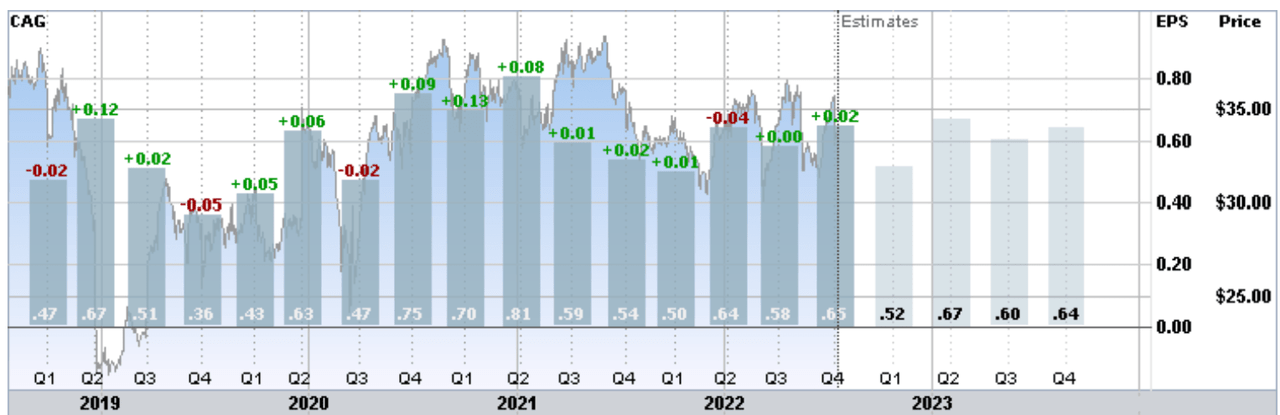
Historical (4 year) and estimated future quarterly EPS for CAG. Green (red) values are amounts by which EPS beat (missed) the consensus expected value (Source: ETrade)
Over the past 4 years, CAG’s earnings growth has been modest, with any long-term trend swamped by interannual variability. The consensus outlook is for annualized earnings growth of 5.4% per year over the next 3-5 years. This is a fairly low growth rate, but it is not unreasonable to expect a total return of around 9%, including the 3.7% dividend yield (using the Gordon Growth Model as an admittedly simplistic estimate). The 3-, 5-, and 10-year dividend growth rates are 13.7%, 9.6%, and 5.4% per year, respectively.
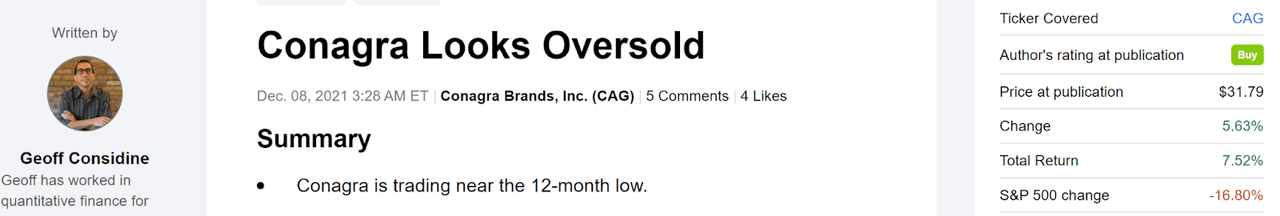
I last wrote about CAG on December 8, 2021, about 7 months ago, when I assigned a buy / bullish rating to the stock. At that time, CAG was trading near its 12-month low, the forward dividend yield was 3.9%, and the Wall Street analyst consensus outlook had a bullish rating and a 12-month price target that was about 17% above the share price at that time. In analyzing a stock, I also rely on the consensus outlook implied by options prices (the market-implied outlook). At the time of my analysis, the market-implied outlook for CAG was somewhat bullish to early 2022 and neutral to early 2023.
Seeking Alpha
Previous post on CAG and subsequent performance vs. the S&P 500 (Source: Seeking Alpha)
For readers who are unfamiliar with the market-implied outlook, a brief explanation is needed. The price of an option on a stock is largely determined by the market’s consensus estimate of the probability that the stock price will rise above (call option) or fall below (put option) a specific level (the option strike price) between now and when the option expires. By analyzing the prices of call and put options at a range of strike prices, all with the same expiration date, it is possible to calculate a probabilistic price forecast that reconciles the options prices. This is the market-implied outlook. For a deeper explanation and background, I recommend this monograph published by the CFA Institute.
In light of the current highest inflation in decades and CAG’s substantial outperformance since early December, I have calculated an updated market-implied outlook for CAG and, as before, compared this with the Wall Street consensus outlook.
Wall Street Consensus Outlook for CAG
ETrade calculates the Wall Street consensus outlook for CAG using ratings and price targets from 6 ranked analysts who have published their views over the past 3 months. The consensus rating has recently shifted to neutral, but has been bullish over most of the past 12 months. The consensus 12-month price target is 1.3% above the current share price and has fallen 8.5% since my previous post. The reduced price target is consistent with several recent downgrades. The concerns are largely that inflation will erode margins although, as noted previously, this expectation may be overblown.
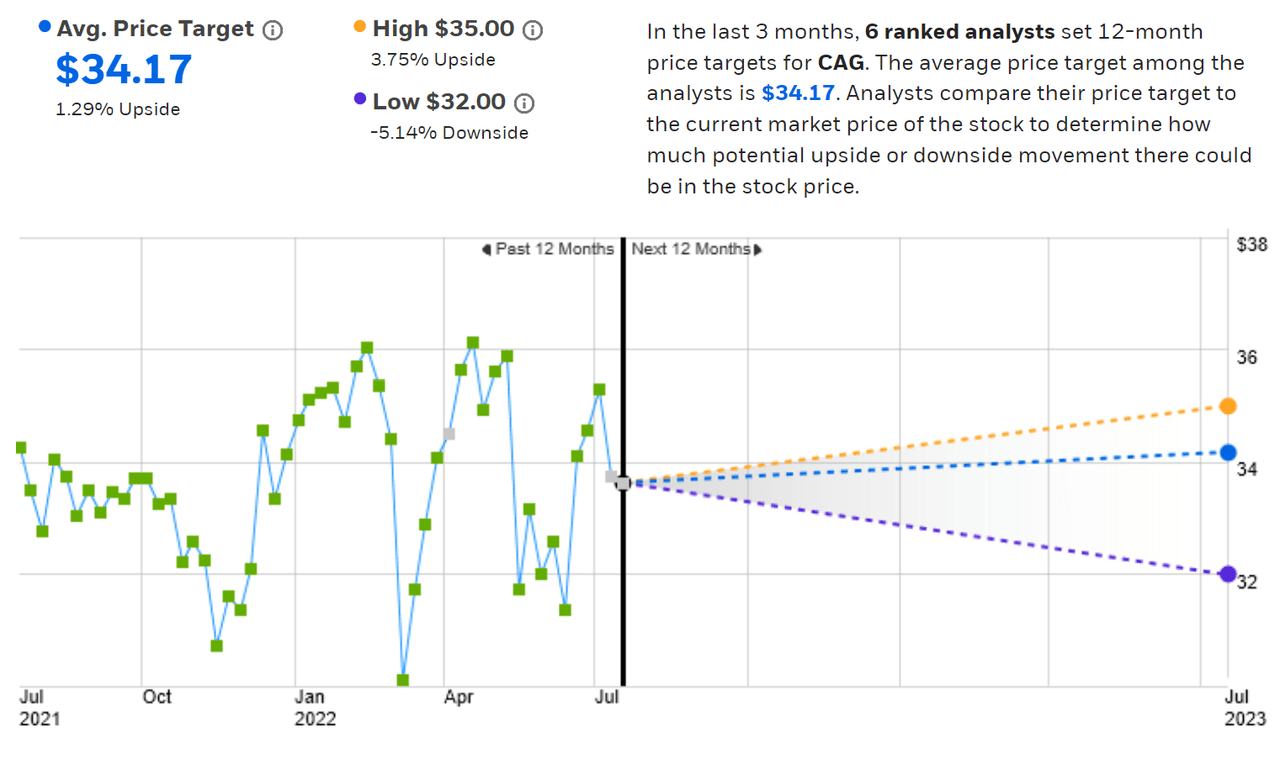
ETrade
Wall Street analyst consensus rating and 12-month price target for CAG (Source: ETrade)
Seeking Alpha’s version of the Wall Street consensus outlook is based on ratings and price targets from 17 analysts who have published their views over the past 90 days. The consensus rating is neutral, as it has been since early March. The consensus 12-month price target is 7.8% above the current share price. This contrast with ETrade’s calculation of the consensus price target is why I look at more than one source.
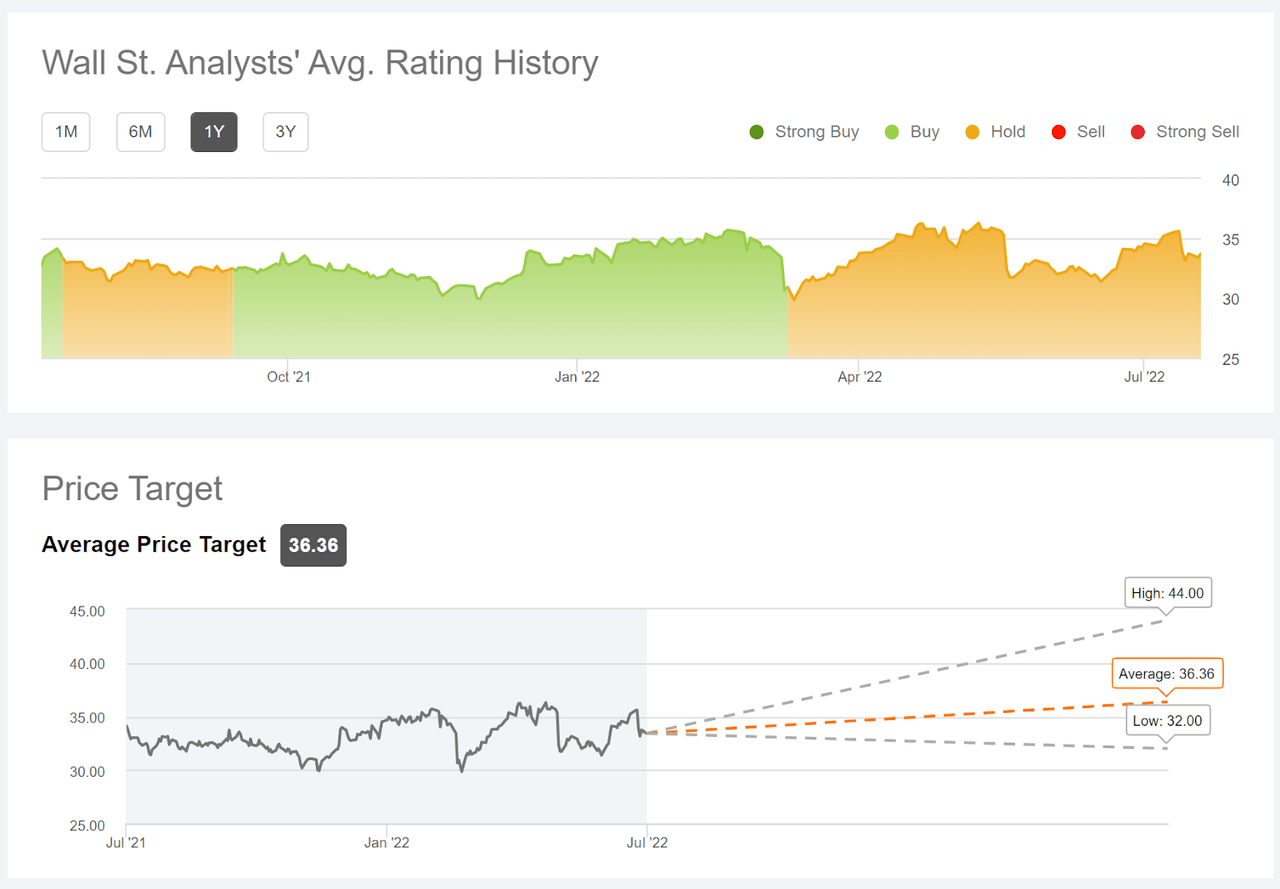
Seeking Alpha
Wall Street analyst consensus rating and 12-month price target for CAG (Source: Seeking Alpha)
The consensus rating on CAG has shifted from bullish to neutral and the consensus 12-month price target (averaging the two sources) is about 4.6% above the current share price. The estimated total return over the next year is about 8.3%, very close to the 10-year annualized total return for CAG, 8.6% per year.
Market-Implied Outlook for CAG
I have calculated the market-implied outlook for CAG for the 6-month period from now until January 20, 2023, using the price of put and call options that expire on this date. The options trading volume for this expiration date is quite robust, but drops off dramatically for longer-dated options.
The standard presentation of the market-implied outlook is a probability distribution of price return, with probability on the vertical axis and return on the horizontal.
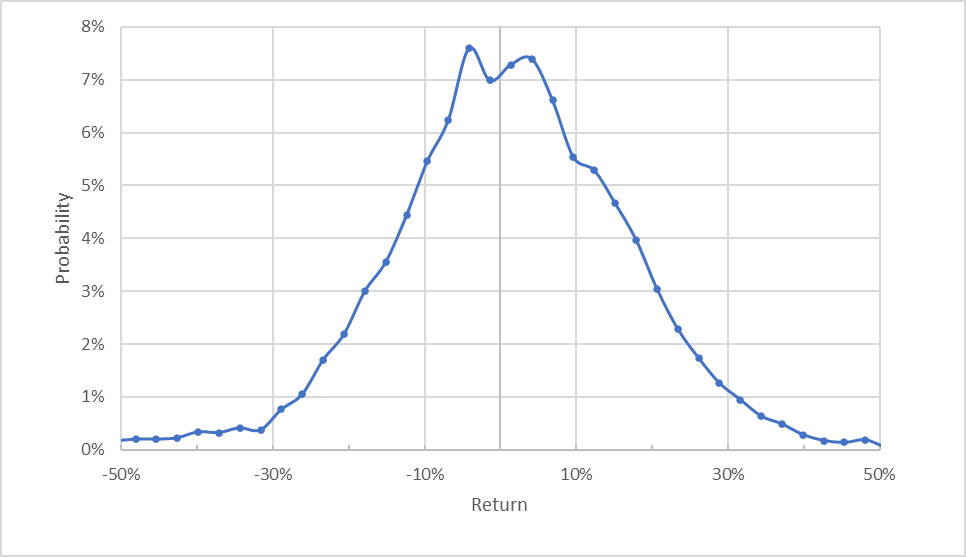
Geoff Considine
Market-implied price return probabilities for CAG for the 6-month period from now until January 20, 2023 (Source: Author’s calculations using options quotes from ETrade)
The market-implied outlook for the next six months is generally symmetric, with comparable probabilities of positive and negative returns of the same size, but there is a definite tilt in probabilities to favor larger-magnitude positive returns. The expected volatility calculated from this distribution is 28% (annualized).
To make it easier to directly compare the probabilities of positive and negative returns, I rotate the negative return side of the distribution about the vertical axis (see chart below).
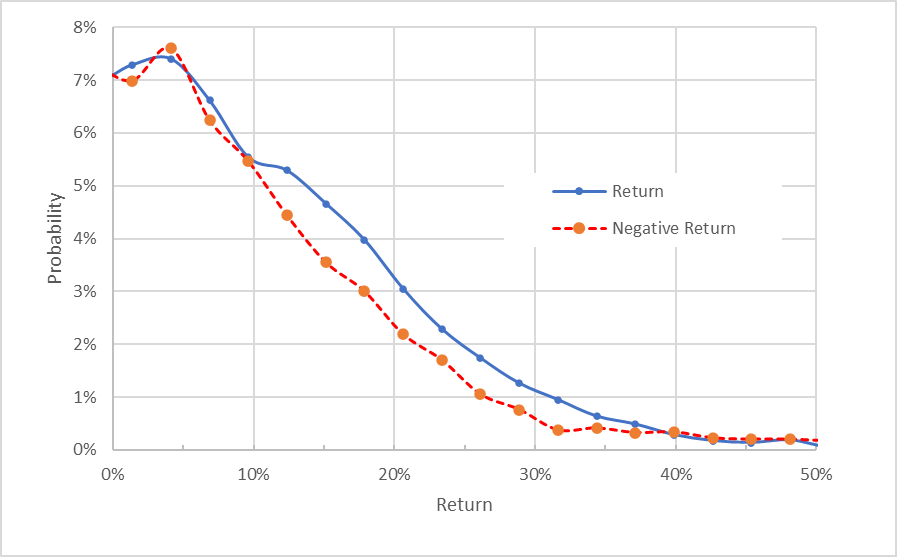
Geoff Considine
Market-implied price return probabilities for CAG for the 6-month period from now until January 20, 2023. The negative side of the distribution has been rotated about the vertical axis (Source: Author’s calculations using options quotes from ETrade)
This view highlights the bullish tilt in the market-implied outlook. While the probabilities of small-magnitude returns (+/-10%) are very close to one another, the probabilities of returns with magnitudes (positive or negative) larger than 10% favor gains (the solid blue line is above the red dashed line over much of the chart above). This is a bullish market-implied outlook for CAG for the next 6 months.
Theory indicates that the market-implied outlook is expected to have a negative bias because investors, in aggregate, are risk-averse and thus tend to pay more than fair value for downside protection. There is no way to measure the magnitude of this bias, or whether it is even present, however. Considering this potential bias reinforces the bullish interpretation of this market-implied outlook.
Summary
Conagra has performed well, even as management warns of reduced profit margins due to inflation increasing the cost of goods sold. While CAG’s total return over the past year is essentially zero, this is a lot better than the packaged foods industry and the broader U.S. equity market. The Wall Street consensus rating on CAG is neutral and the consensus 12-month price target has fallen as the growth outlook has softened. The Wall Street consensus 12-month price target is a modest 4.6% above the current share price, implying a total return of 8.3% over the next year. I am starting to suspect, however, that management’s somewhat downbeat earnings growth outlook (which motivated the reduced price targets) is partly political and intended to deflect charges of excessive price increases. As a rule of thumb for a buy rating, I look for an expected 12-month total return that is at least ½ the expected volatility (28%). CAG is well below this threshold level. The market-implied outlook to early 2023 is bullish, however. Considering the 3.7% forward dividend, which is decently supported, the company’s demonstrated ability to maintain earnings in the face of very high inflation, the neutral Wall Street outlook and the bullish market-implied outlook, I am maintaining my buy / bullish rating on CAG.
Be the first to comment