

grandriver/E+ via Getty Images
Comstock Resources (NYSE:CRK) is a natural-gas Exploration & Production (“E&P”) company focused on Louisiana and nearby eastern Texas. This is within the so-called Haynesville Shale play. Their properties are shown in blue here.
Comstock March 22 Investor Presentation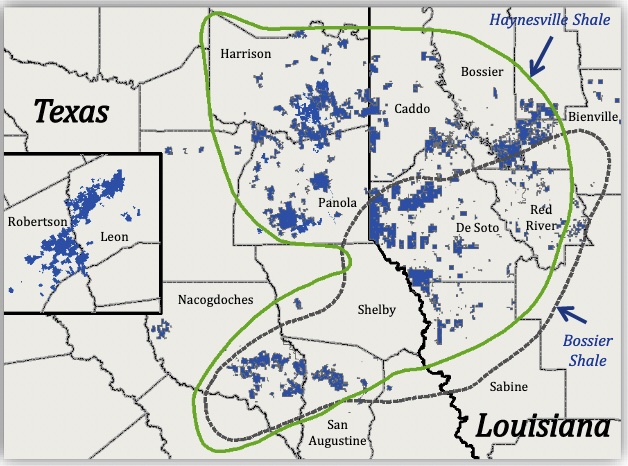
These locations are close to present and (presumed) future LNG export facilities on the Louisiana coast. Within energy-friendly Louisiana, this means that Comstock can put in wells and pipelines to harvest and transport the gas.
Even in Texas, this is easier than most places, though Federal approvals are needed for any expansion of interstate pipelines. But still, this is better than being located in more-distant states where more of the population believes that producing and transporting hydrocarbons is evil, despite the needs of the world and the fact that the hopes for their replacement by so-called “green” energy are not viable plans.
Meet Comstock
Comstock was brought to the attention of the community at Energy Investing Authority, including me, by its owner Michael Boyd. He has had a price target on it of $15 since early this year. As usual, his coverage for us provided a deeper perspective than is easily obtained from their investor presentation.
Comstock has a bumpy history and at one point flirted with bankruptcy. It was bailed out by billionaire Jerry Jones, who still owns a substantial fraction of the company.
My main issue with that is that I am not and have never been a Dallas Cowboys fan. But I am also not ultimately comfortable with holdings for which a dominant shareholder can call the shots. So I would not want to hold CRK long-term.
Today Comstock is in a much better position, with these aspects:
- Best cost per unit production among a group of 10 gas peers.
- Best costs per unit production including interest expenses.
- Inventory to support 25 years production at current rates
- Very distant maturities for nearly all debt.
- Operating leverage of 2.2x, decreasing toward a target of 1.5x.
Despite these positives, and perhaps reflecting the rocky history, at the time Michael brought CRK to our attention it was significantly undervalued relative to several peers in terms of adjusted values of both EBITDA and Free Cash Flow. The difference has been reduced somewhat, but less than one might think as recent news and market action has buoyed all the US natural-gas producers.
I invested in CRK on March 15. To my amazement, as of last Friday the position is up 45%. I took some gains at 35% and it has kept rocketing upward since. Here is the recent price history through Friday March 25:
Seeking Alpha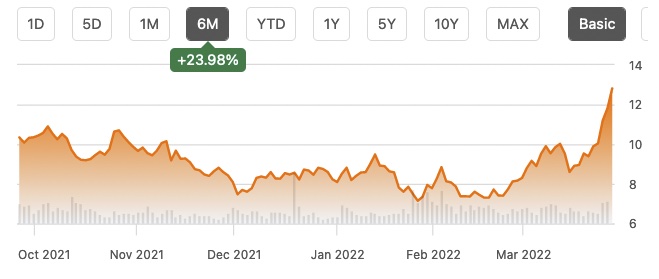
I suppose some investors feel exultation when they find themselves riding one of these parabolic upward curves. What I feel is great fear. Anything that can go up like that can come crashing back down just as easily.
I often just sell out at this point, consistent with my strategic goal of selling too soon. But oh my, the market seems well set up for LNG and its suppliers. It seems likely that Michael’s price target should be increased. And the relative valuation cap vs. other natural gas E&Ps has not closed.
So I decided to explore hedging the gains. One could short the underlying commodity, but that would be way outside my investing experience. Instead, I decided to use a collar.
The Structure of Collars
The simplest hedge for a stock one holds is to just buy puts. Then if the price drops below the strike price, one can sell at the strike price. I did a fair bit of this back in the 1980s.
But today, at least in the areas I invest, puts are pricy. It can easily cost 10% to temporarily hedge against a relatively modest loss.
By using a collar instead, one limits one’s maximum future gains in order to defray the cost of limiting one’s potential losses. For readers unused to options, here is a brief summary of a collar.
One is long shares of some stock. One brings in money by selling calls covered by those shares. One spends the money, more or less, buying puts for downside protection.
Collars are usually displayed on graphics like this:
RP Drake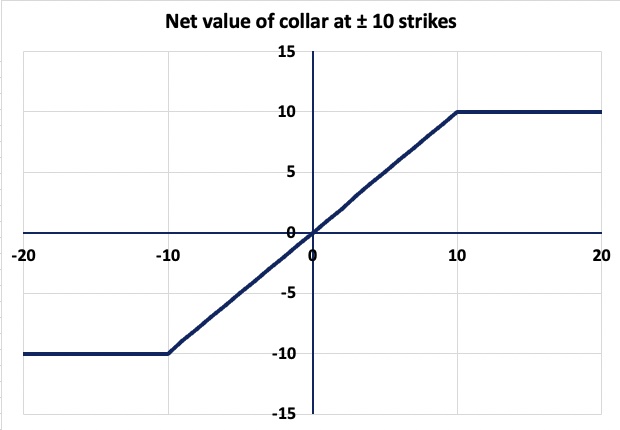
This depicts a collar for which the strike price of the call is $10 above the current price and the strike price of the put is $10 below it. Suppose the stock is priced at $50. On the expiry date for the options (or when the shares get called away before that), the position will have a net value between $40 and $60.
The result is that by limiting your gains to 20% you have been able to limit your losses to 20%, at more or less no cost.
Seeking a Collar That Fits
The challenge in finding positions for a collar is that there are so many possibilities. One can choose among several strike prices for each of the call and the put, and also among expiry dates.
Displays like the one above are very cumbersome ways to scan this space. Perhaps there is software that can really display all these possibilities within stated limits, but if so I don’t have it. (Readers feel free to weigh in.)
So I did it by hand. This has the advantage that I can share how. Here is the option chain from Fidelity on March 28:
RP Drake from Fidelity data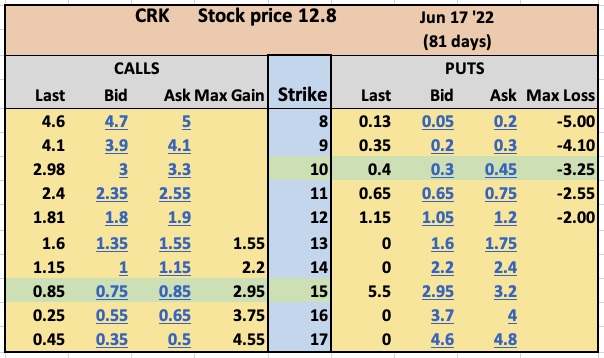
For the Strike Price shown in the middle column, one has the calls on the left and puts on the right. I was willing in principle to consider the full range of cases where both the call and the put were out of the money.
Readers new to options may not realize that the numbers shown in blue are the price per share for the option. What can be confusing is that options are sold in 100-share lots, so money spent or received is some multiple of 100 times the numbers shown.
Once I saw the data and thought about things, I selected the options shown on the two rows shaded green. For the entire set, the matrix of initial spreads looks like this:
RP Drake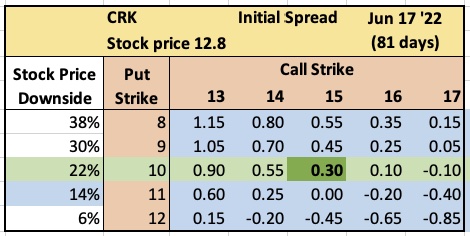
Over this range, one can set up collars and get paid up to $1.15 per share or spend up to $0.85 per share. The classic case is the “costless collar,” here for a $15 call strike and $11 put strike.
My own preference is to get paid something for investment actions, but that was not the main consideration here. These E&P stocks are volatile, and if you focus on 10% variations you will go nuts.
So I decided that a downside near 20% was worth protecting. That would still leave me a three-month gain of 25%, which will do. This led me to select the row shaded green.
The selection of a $15 call strike is discussed below. With that, I ended up with the box shaded dark green. In the event, when I placed the trades my spread came in at $0.32.
I also compared the June expiry with May and September. You get paid a fair bit to wait from May to June, but not a lot more to wait until September. In some cases the September spreads came out smaller than June. The options markets are not efficient at that level.
Selecting the Call Strike
In thinking about the call strike, I looked most closely at the maximum gain from the collar, implying that the shares get called away at the strike price:
RP Drake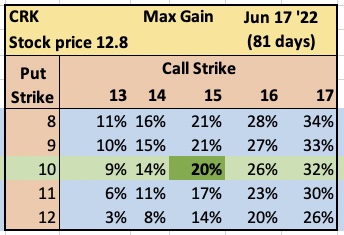
My first inclination was to go with a call strike of 14, since that is probably the level where I would sell out anyway. But that would be possible anyway, for a higher strike, if the price is around 14 on June 18.
In the event my choice was to go with the $15 strike. If the rocket flies beyond that, some gains will be lost.
That’s OK with me, as I never would have stayed in that long anyway. If the shares are called at $15, my gain will be bigger than the one my normal behavior would have produced.
It is also interesting to look at the difference between maximum gain and maximum loss.
RP Drake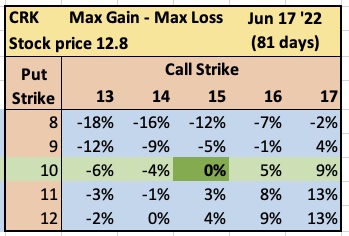
As it happens, my collar is symmetric. The maximum gain and loss are the same. One could push toward asymmetric outcomes by moving toward the upper left or lower right.
Looking Ahead
I hope the above provides and interesting and perhaps useful example. Perhaps I will use this approach again.
Ironically, in my view the price of oil is a lot more precarious than that of gas, and I do hold some oil-focused E&Ps. But while those have excellent gains, they have not gone parabolic recently.
There is time to think for a bit about whether to put a collar on any of them. It would be great to hear in the comments how and when you hedge, if you do.
My portfolio also includes a lot of REITs, which we discuss actively at High Yield Landlord. I have taken a lot of post-pandemic gains in REITs over the past year. We will see whether I decide to collar any of those rockets in the future.
Be the first to comment