


Comstock Holdings owns property around the Reston area.
ivanastar/iStock Unreleased via Getty Images
Subscribers to the Microcap Review received early access to this article on August 8th, 2022. Anyone looking for additional microcap value and event driven opportunities should take a look at the offering and author Safety in Value’s work.
—–
Comstock Holding (NASDAQ:CHCI) is a microcap company, which shifted from a homebuilding focus in 2018 to commercial real estate development and asset management which the market has overlooked. The company manages a $3b portfolio of mixed-use and transit-oriented properties in the Washington, D.C. metro area including 15 commercial assets, 6 multifamily assets, and 15 commercial garages. CEO Christopher Clemente founded Comstock in 1985 and has decades of experience investing in the DC area; he’s also a 31% current owner.
With ongoing recession and inflationary fears I believe that CHCI is a strong defensive name. Commercial real estate can serve as an inflationary hedge and is expected to perform strongly in 2022 overall. I believe Comstock can operate through a recession given:
-
Two of their properties are anchored by public transit stations with daily commuters: Reston and Loudon stations. Their properties in these areas include office buildings, multifamily apartment buildings, and parking garages.
-
EBITDA grew to $5.8m in 2021 versus $3.4m the year before, 71% growth. Enterprise value of $25.51m implies a EV/EBITDA multiple of 4.4x. Earnings should grow in coming years as construction finishes on buildings that are already leased up. Q1 earnings were $1.75m.
-
Strong balance sheet with $11.560m in cash and $5.5m in debt.
-
As an asset management company they are incredibly capital light having spent an average of $112,000 annually on capital expenditures over the last five years. That represents just 2% of FY22 EBITDA.
-
Synergies in the business model allow Comstock to acquire minority ownership in a building and get paid to manage it.
-
Asset management agreement in place to manage core portfolio of assets at least until 2035. This agreement also ensures at least an annual $1m payment plus various fees related to maintaining the property which helps to mitigate downside risk.
-
The company has $139m in NOLs which will likely be used in the coming years. For a company with a $35.83m market capitalization this NOL is sizable.
Recent news of preferred shares being bought out at a 50% discount demonstrate smart capital allocation and will enable continued growth. Another result of this transaction is billionaire Dwight Schar now being a 31% owner at around the same prices you can buy into today, so you can align interests.
I believe that given the quality of assets under management, their ongoing development pipeline driving earnings growth, and the synergies inherent in the business model that Comstock Holding is undervalued at current prices. I’m setting a 1-2 year fair value price target based on an EV/EBITDA multiple of 10x translating to $9.93 per share. Implied margin of safety is 128% with an estimated 20% further decline as the downside risk.
Comstock Holding Company Overview
The company manages a $3b portfolio of assets which it generates a return on mostly as a percentage of revenue generated on those assets. That portfolio is broken down into the Anchor Portfolio and Other Portfolio Assets. As part of the preferred deal exchange, a new asset management agreement was announced which gives a window into how revenue is generated:
Pursuant to the modified fee structure set forth in the 2022 AMA, CP will pay CAM (author’s note: this is the company) an annual fee equal to the greater of either (i) an aggregate amount equal to the sum of (A) an asset management fee equal to 2.5% of the Anchor Portfolio revenues; (B) a construction management fee equal to 5% of all costs associated with Anchor Portfolio projects in development; (C) a property management fee equal to 1% of the Anchor Portfolio revenues; (D) an acquisition fee generally equal to up to 0.5% of the purchase price of an acquired asset; and (E) a disposition fee generally equal to 0.5% of the sales price of an asset on disposition (collectively the “Market Rate Fee”); or (II) an aggregate amount equal to the sum of (X) the employment expenses of personnel dedicated to providing services to the Anchor Portfolio pursuant to the 2022 AMA, (Y) the costs and expenses of CHCI related to maintaining the listing of its shares on a securities exchange and complying with regulatory and reporting obligations of a public company, and (Z) a fixed annual payment of $1,000,000 (collectively the “Cost Plus Fee”).
What I like about this is the fixed annual payment of $1m plus certain fees that is guaranteed as it helps to mitigate the downside risk on this portfolio. In the event that a recession takes a huge toll on the tenants and therefore the revenue base of the Anchor Portfolio, Comstock’s exposure to the downside is mitigated by the Cost Plus Fee structure. On the other hand, if the macro environment suddenly improves the upside is not limited given the agreement includes a 20% incentive fee on profits whenever the owner’s capital is compounded at 8% annually – so there’s a strong incentive to grow.
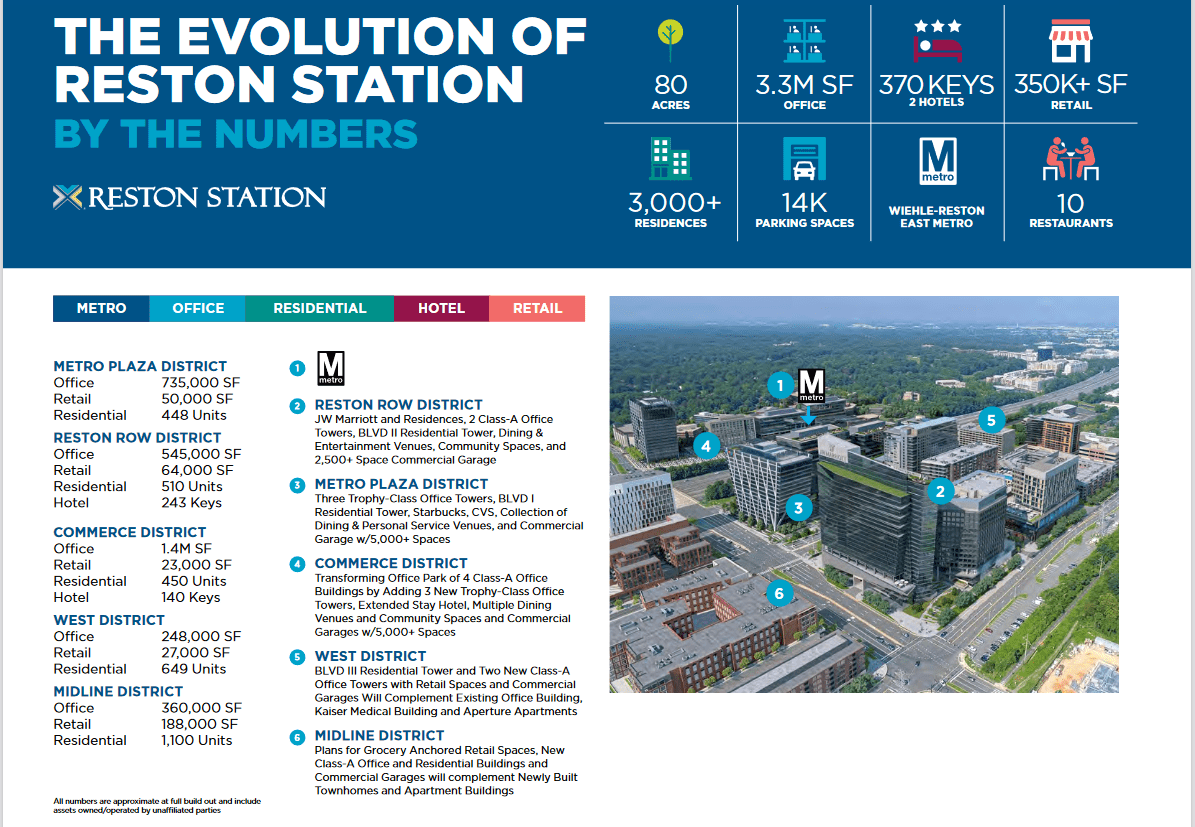
CHCI IR: Portfolio details for Reston property
Their other portfolio assets include: an asset management agreement for an additional two properties, ownership of residual cash flow from legacy construction business, and a handful of joint ventures where the company has minority ownership of a few buildings.
Comstock is vertically integrated in that they service, manage, and own real estate directly. One of the ways they benefit from the synergy of this integration is in these joint ventures. In all three the deals were sourced through off-market channels and Comstock retained a small minority interest. They generate further income on the management of that real estate paid to them by the majority owners. Lastly, on two of these deals the company had a third profit vehicle in the form of acquisition fees they were paid on the deals. I like the mechanics of getting paid to source acquisitions, acquiring minority interest in these assets, and finally getting paid by majority owners to manage the asset they already own.
Recent Ansel Acquisition is instructive in this regard. The company acquired a 5% ownership interest in the building through an off-market transaction at $129m which they highlighted as being at a discount to replacement cost. If you look at the details below you can see they not only acquired ownership but generated income on this acquisition based on four different types of fees: acquisition & capital market services, asset management, property management, and commercial leasing.
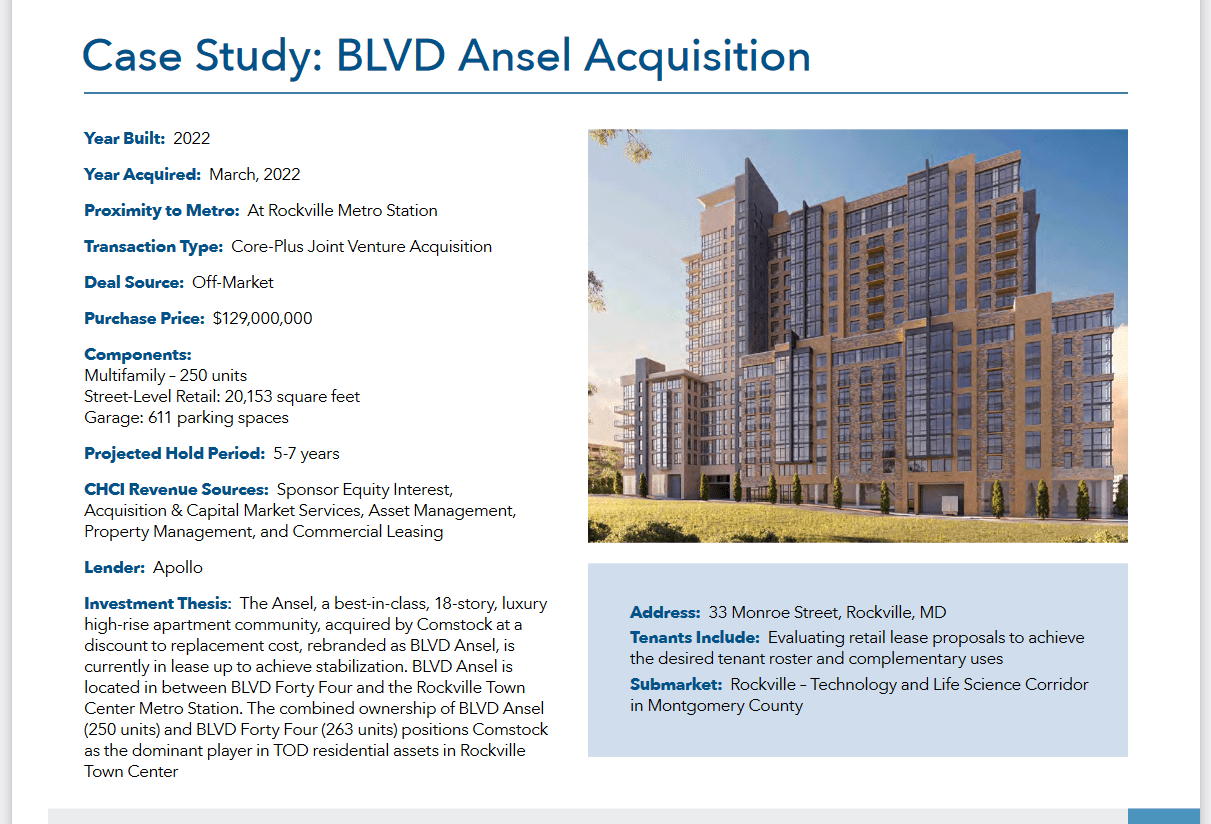
CHCI IR: Case Study of Ansel Building
Earnings should continue to grow as management executes against its sizable development pipeline of 5.8m square feet and 3,492 units. Stabilized operating assets generating revenue are currently at 2m square feet and ~1636 units, so the growth implied here will more than double the revenue generating properties. Many of these properties are already leased up and have specific development plans attached to them so the risks here are mitigated.
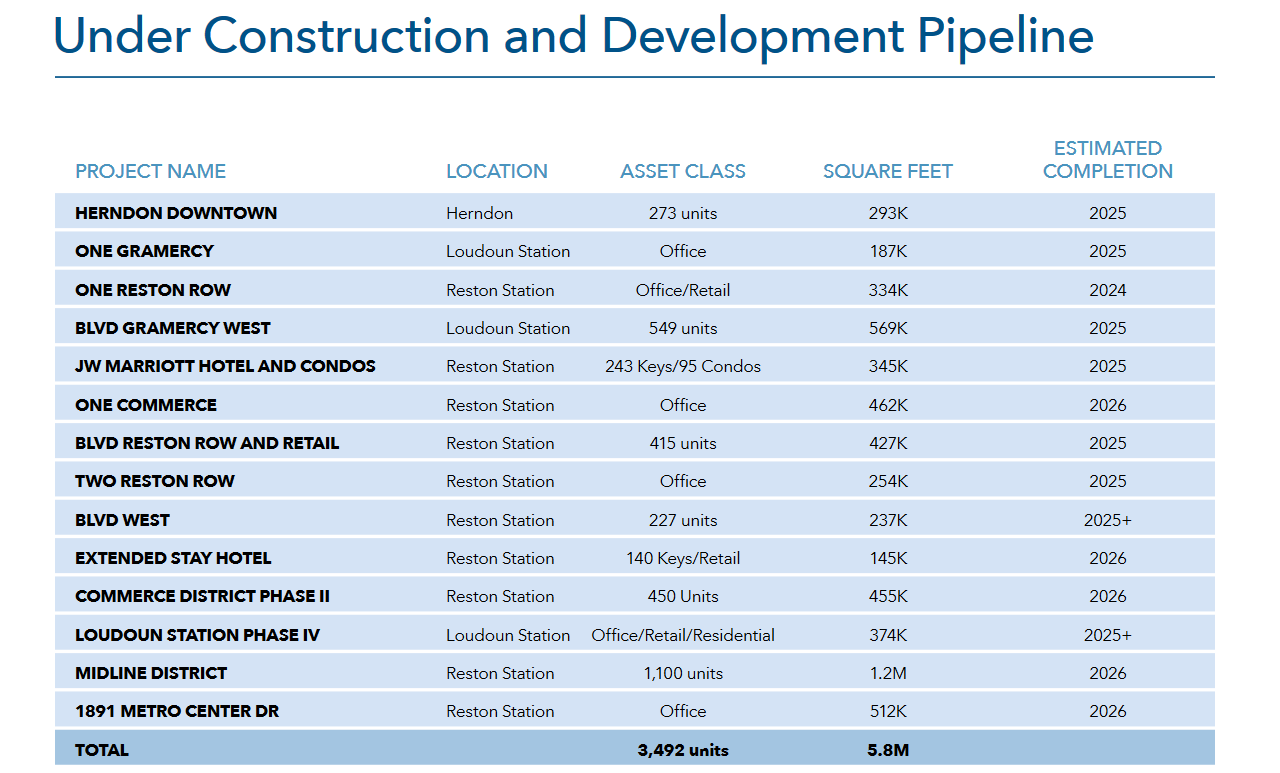
CHCI IR: Table of properties under development
A Note On Where Comstock Holding’s Managed Assets Are
Comstock is geographically focused in the Washington, D.C. metro area which has secular growth trends supporting it. Northern Virginia (NOVA) has a growing cybersecurity and technology niche with Amazon’s highly publicized HQ2 recently opening there. Infrastructure requirements from these tech names as well as the government have established the Dulles Corridor in NOVA as “The Internet Capital of the World” where one county, Loudoun, hosts upwards of 70% of the world’s internet traffic. Management highlights this information in their filings and explicitly looks to exploit the growth trends of the NOVA market overall.
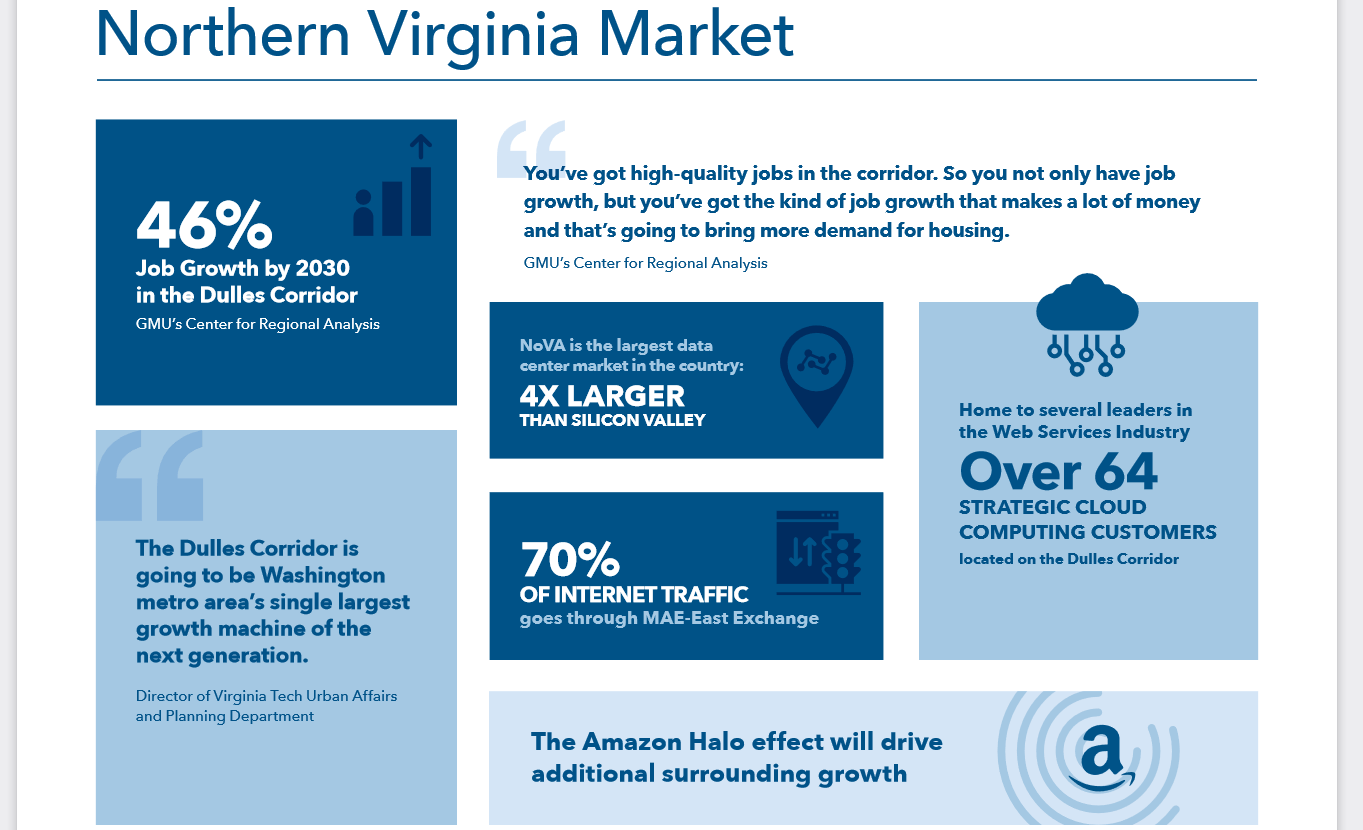
CHCI IR: NOVA Market Information
The Anchor Portfolio properties are located along transportation hubs with key commuting populations coming in and out of these areas daily. Tenants are high quality and include Google, Starbucks, CVS, AMC Cinema with a planned Marriott hotel in the works as well. The multi-family assets are luxury assets and are likely to be supported by macro trends moving forward. Their commercial parking garages in these areas should be profitable and are run in joint public-private partnerships (P3) with local governments.
Management can use their deep expertise and relationships in the region to secure additional off-market deals at favorable valuations as well as generate additional P3. Each of the Anchor Portfolio assets are run in P3 with different local governments: the Town of Herndon, Loudoun County, and Fairfax County. I believe management is well-positioned to leverage these relationships further to drive additional growth and the value of Christopher Clemente’s 38 years specifically in the DC real estate market is not given any value at current prices.
Comstock Valuation And Balance Sheet
Comstock has an enterprise value of $25.51m as of Q1’22 and has a thirteen trailing quarter EBITDA average of $1.127m. If we annualize that EBITDA we get a conservative estimate of $4.508m which implies CHCI is trading at an EV/EBITDA of 5.66x. I say it’s conservative given it is backwards looking and does not price in any of the growth guaranteed by further buildout. Consider as well that they already have made $1.606m in EBITDA in just the first quarter. I’d gauge that a 10x EV/EBITDA is a conservative multiple to apply given the company produces meaningful cash flow, has almost no capital expenditures, and is growing earnings through further buildouts. This would suggest a 76.7% margin of safety based on the $4.508 trailing thirteen quarter average. Based on FY22 EBITDA of $5.8m, implied margin of safety would be 127%.
Let’s look at the balance sheet.
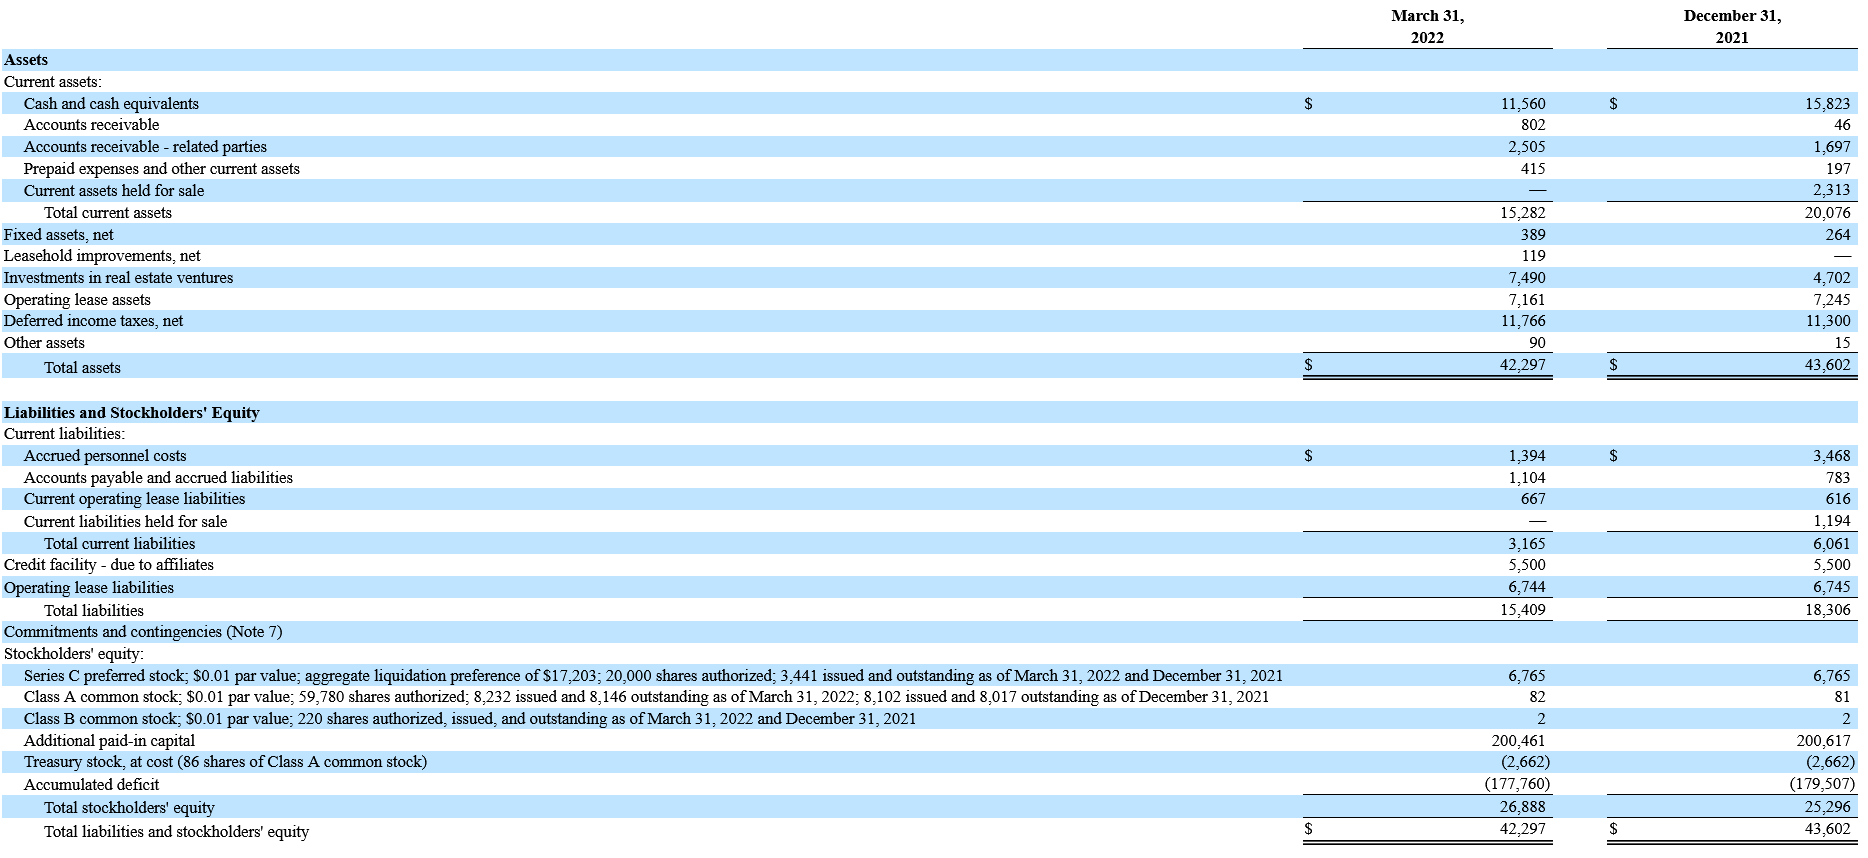
CHCI Q1’22 Balance Sheet
As of the most recent quarterly filing the company had $11.5m in cash, $7.490m held in real estate assets, and $5.5m in debt. Also we can see the $6.765m in value held for the preferred shares as well. The recent preferred share transaction liquidated the preferred shares through a payment of $4m cash and one million additional shares. Let’s make some adjustments based on this.
|
Q1’22 |
Post Preferred Exchange |
|
|
Shares Outstanding |
8.200 |
9.200 |
|
Cash and cash equivalents |
11.500 |
7.500 |
|
Total Assets |
42.297 |
38.297 |
|
Total Liabilities |
15.409 |
15.409 |
|
Total Stockholder Equity |
26.888 |
22.888 |
|
Preferred Equity Value |
6.765 |
0.000 |
|
CHCI Stockholder Equity Value |
20.123 |
22.888 |
|
CHCI Per Share Value |
$2.45 |
$2.49 |
We can see that as a result of the transaction the equity value per share of CHCI increased $0.04. With $7.5m in cash still on hand the company has good liquidity moving forward as well.
Downside protection exists in the form of the cash held and real estate value which equals $14.99m given what the company reports. I’d argue it’s likely the value of the real estate is understated on the balance sheet based on the purchase price of these assets. CHCI maintains ownership in three buildings: BLVD Ansel, BLVD 44, and the Hartford. Five percent ownership is maintained in the BLVD buildings and 2.5% ownership in Hartford. Each of these were bought in off-market transactions and both of the BLVD transactions were noted to be bought at a discount to the replacement value of the building.
If we look at the value of the real estate as compared to the purchase price, we get a value of $15.21m which is 151% higher than the carried value of $6.06m for the building.
|
CHCI Implied Ownership Value |
Purchase Price |
% Ownership |
Year Purchased |
CHCI Carried Value |
|
|
BLVD Ansel |
6.45 |
129.00 |
5% |
2022 |
2.609 |
|
BLVD 44 |
5.54 |
110.75 |
5% |
2021 |
2.252 |
|
The Hartford |
3.22 |
128.75 |
2.50% |
2019 |
1.199 |
|
Total |
15.21 |
6.060 |
CHCI includes their interests related to the legacy homebuilding asset in the $7.490m real estate line item. I’ve excluded it from my calculations here as direct property value comparison isn’t available, though it likely has value. The value of this is held at $1.4m currently.
If we take this into consideration and look at the cash plus adjusted real estate value we get a total of $24.11m which represents around ~60% of the current market cap. That ascribes no value to the $22.5m in revenue the company generated from its asset management services in 2021. Given this I believe that a market cap of $24.11m is a downside support level and would represent a further 40% decline in value from current prices.
Why Comstock Is Trading At A Discount
As a microcap, there are structural reasons that this company does not get as much attention. For instance, CHCI has zero analysts covering it according to Yahoo Finance. Nothing has been written for CHCI on Seeking Alpha since 2014 nor have they updated their news feed regarding the June 13th capital structure change. This is why I like to invest in the microcap space because this lack of coverage and interest creates greater opportunity for mispricing.
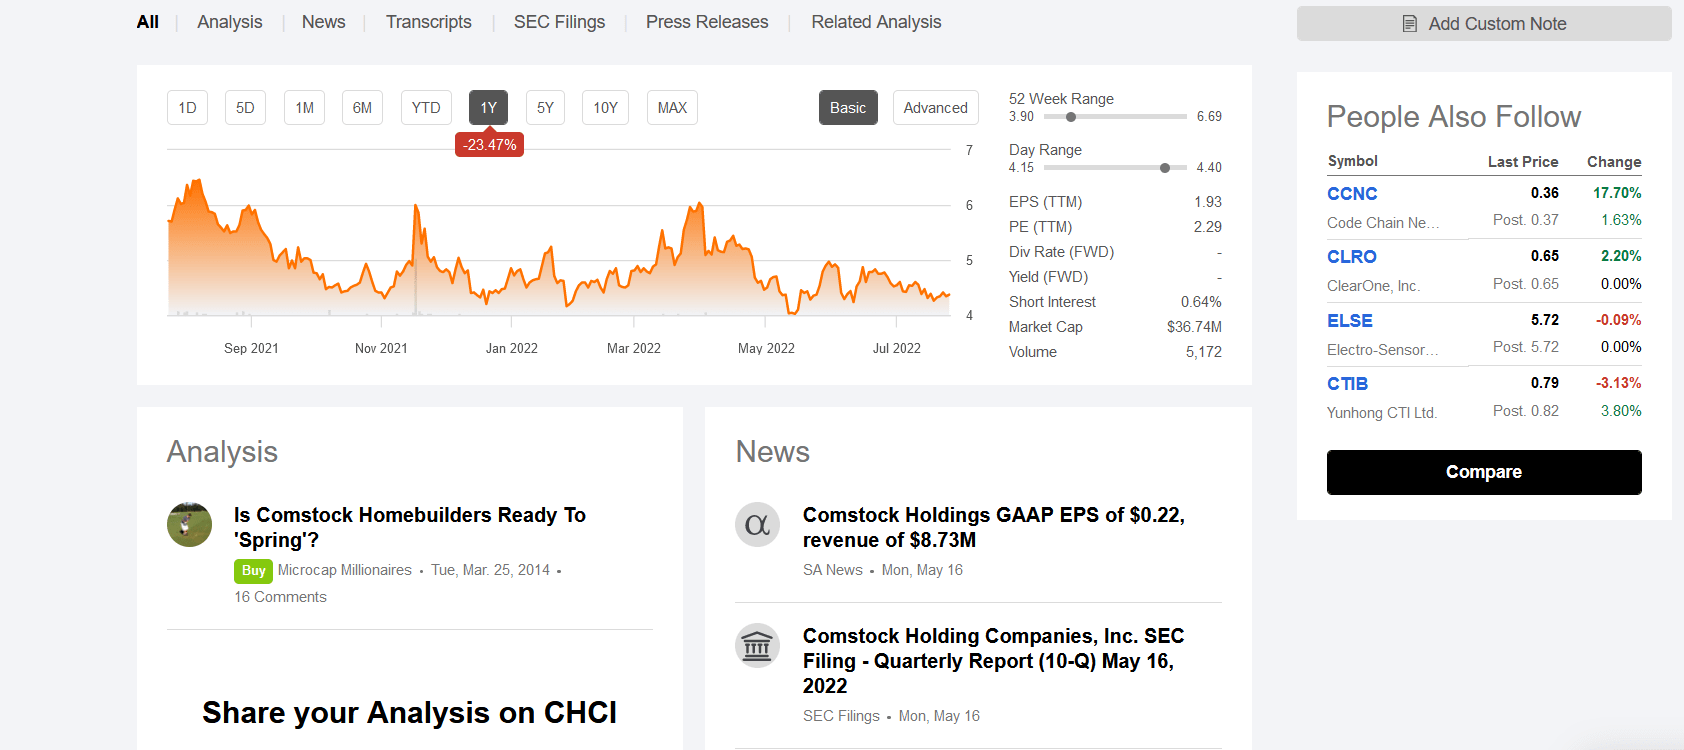
Seeking Alpha CHCI Page
The microcap mispricing is part of my investment strategy overall. But we can note another piece of market mispricing as well. As mentioned, Comstock shifted from a homebuilding model to its current one in 2018. Despite that being four years ago there are multiple places where the company is still being defined within a construction context. A few examples:
-
TD Ameritrade: listed as Consumer Discretionary: Household Durables. When you navigate to peer comparison with CHCI it automatically brings up two homebuilders.
-
MarketBeat: listed as Construction: Real Estate.
-
The Motley Fool: listed as Consumer Discretionary: Householder Durables.
-
MarketWatch: listed as Construction: Residential Building Construction.
These listings are as opposed to what is likely a more appropriate categorization of Real Estate: Building Operators that we find on their NASDAQ page.
Why does any of this matter? In a market where 80% of trades are estimated to be algorithmic, whether or not CHCI is in one sector or the other can be pretty significant. When we consider the difference between the capital intensive construction business it used to be and the capital light management company it is now this discrepancy is even more significant.
What this means is that algorithmically CHCI is often lumped in with other homebuilders which are inappropriate peers. As the market begins to better understand the changed nature of this company I expect there to be a re-rating. With compounding earnings growth likely in the upcoming years I think even without a multiple re-rating the value of the stock price should rise accordingly.
Rising Short Interest Could Lead To Small Short Squeeze
Insiders own about 67.2% of shares. According to Morningstar, CHCI is 6.25% institutional owned and 4.25% fund owned. If we total that up, those shares account for 77.7% of shares outstanding. I think it’s reasonable to estimate that these shares are not exchanging hands which leaves only 22.3% floating around or 1.83m shares. Average daily volume over the last year is around 24,464 daily. Since April of this year average daily volume has dwindled downward according to NASDAQ.com.
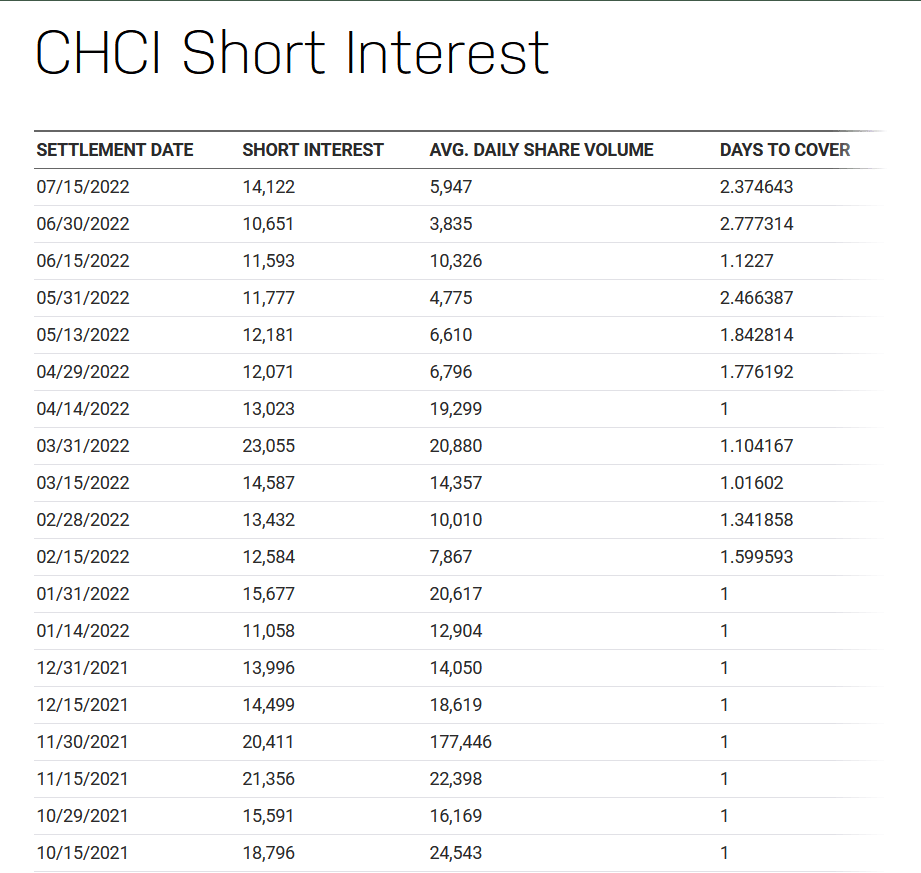
NASDAQ.com CHCI Short Interest Data
While average daily volume has decreased meaningfully, short interest has ticked up in recent months. While short interest overall is not high, given the illiquidity, a positive news event could trigger a short squeeze. I suspect the short interest is a carry over from negative sentiment related to homebuilders overall given rising mortgage rates. Here is a Seeking Alpha article explaining the phenomenon from April 8th, 2022.
From a daily perspective we can see that over the last month 49.79% of volume was shorted. I think this is quite high given the undemanding valuation. Additionally, we can see the daily volume average continues to trend downward with an average of just 1,807 shares trading each day.
|
Date |
Volume |
Short Volume |
% of Vol Shorted |
|
Jul 26 |
848 |
65 |
7.67 |
|
Jul 25 |
1,673 |
1,142 |
68.26 |
|
Jul 22 |
138 |
14 |
10.14 |
|
Jul 21 |
3,271 |
2,701 |
82.57 |
|
Jul 20 |
2,145 |
967 |
45.08 |
|
Jul 19 |
3,302 |
2,568 |
77.77 |
|
Jul 18 |
895 |
743 |
83.02 |
|
Jul 15 |
255 |
158 |
61.96 |
|
Jul 14 |
1,308 |
282 |
21.56 |
|
Jul 13 |
2,278 |
175 |
7.68 |
|
Jul 12 |
15,159 |
6,497 |
42.86 |
|
Jul 11 |
74 |
62 |
83.78 |
|
Jul 08 |
90 |
88 |
97.78 |
|
Jul 07 |
808 |
242 |
29.95 |
|
Jul 06 |
327 |
52 |
15.9 |
|
Jul 05 |
459 |
195 |
42.48 |
|
Jul 01 |
106 |
22 |
20.75 |
|
Jun 30 |
376 |
244 |
64.89 |
|
Jun 29 |
1,042 |
938 |
90.02 |
|
Jun 28 |
1,087 |
377 |
34.68 |
|
Jun 27 |
3,635 |
2,062 |
56.73 |
|
Average |
1,870 |
933 |
49.79% |
*Data pulled from Naked Short Report.
With decreasing volume, shorts will have a harder time covering their position in the event of good news which may compound returns in the near term. Decreasing volume likely represents a lack of new buyers in the name as overall market pressures forced sellers out. With good news we could see a FOMO reversion. And all of this I suspect is simply related to a misrepresentation of the company based on what it historically did rather than what it currently does.
Asymmetric Risk Profile
Catalysts have already started in the name given the preferred exchange. Whenever the next quarterly filings are out we should see the impact of the preferreds being retired for a 50% discount. Along with that I think we can interpret new 31% owner Dwight Schar as entering at prices around $4.23. Schar along with Clemente actually owns the Anchor Portfolio assets that Comstock manages, so he is not new to the company. I don’t think it’s a bad idea to follow Schar into the investment either. He is a billionaire housing magnate who recently retired from one of the nation’s largest homebuilders, NVR; and he’s also Clemente’s father-in-law. Schar’s wealth provides a lot of underlying capital to support Comstock in case of an emergency.
CHCI is currently trading 13% above its 52-week low. First quarter earnings give us a window into some of the growth that’s already happened with revenue growing 27.6% year-over-year. EBITDA grew 160% year-over-year. There’s huge operating leverage created and the ramp up in revenue as the company finalizes build outs will immediately drop to the bottom line. With $139m in NOLs we will see the earnings compounded moving forward. Given the growth I believe an EV/EBITDA multiple of 10x is conservative given earnings are predictable, recession and inflation resistant, and are growing with minimal costs to the company.
Over the coming year if we annualize Q1 earnings of $1.75m we get a $7m FY22 earnings estimate. With a market cap of $35.83m we can back out the cash position of $15.82m to estimate that the operating business is trading for a P/E of just 2.86x. A reversion to P/E of 5x would imply a 75% return.
Given the relative stability of these assets there are few risks. The overlap of office and transit managed assets could cause a hit to the name if there ends up being another COVID lockdown scenario. Office vacancies in DC hit a record high of 18.4% at the end of 2021 though CBRE Mid-Atlantic director of research Wei Xie found buildings that were tough to lease before the pandemic have remained empty, while trophy buildings are doing well. Many Comstock Holding assets are in the trophy category and have seen strong leasing throughout. A lack of housing supply overall has been driving rental prices in DC so it seems the multi-family properties are not at risk. Though we could see a negative impact to the parking properties if a strong work-from-home trend persists.
While a deepened recession could cause a decline in revenue and even some tenancy issues, this is balanced by the asset management agreement cost plus fee structure minimizing downside exposure. With very little debt on the balance sheet and cash on hand there’s a cushion here for operational missteps as well.
With Clemente and Schar’s CHCI share ownership and underlying ownership of the real estate assets there is a high concentration of their particular interests here which may represent a risk to minority shareholders. One risk here could be a take-under effort simply to minimize the costs of being a public company though that seems unlikely given all costs to be public are paid by Comstock Partners L.P. which owns the real estate directly.
The stock is also relatively illiquid with only 5100 daily average trading volume – that’s only about $22,000 in value. With 67.2% of shares held by insiders the pool of trading shares is likely smaller than it seems and likely to have high volatility related to news, good or bad.
Another risk is that there simply is no meaningful catalyst to draw attention here. While this may be possible for the coming year or two, I think given growth prospects and likelihood of compounding earnings CHCI stock price may remain depressed but the market will eventually have to deal with the reality that these are stable earnings. Q2 earnings are set to be released sometime in mid-August which may serve as a near-term catalyst.
I’d say the greatest risk to the company is an indiscriminate market selloff. The S&P 500 has lost about 20% in value this year. In a bear case we can estimate an additional 20% sell-off which I think is reasonable given low valuation and the company is already trading near 52-week lows.
|
Case |
Implied Return |
Implied Price |
|
Bear Case: Decreasing or flat revenue. Market selloff. |
-20% additional broad market downturn |
$3.50 |
|
Base Case: Flat or slightly growing revenue. |
+128% given re-rate to 10x EV/EBITDA |
$9.93 |
|
Bull Case: Sequential growing revenue and profit. |
+173% given re-rate to 12x EV/EBITDA |
$11.92 |
Be the first to comment