

andresr
Investment summary
Following its Q3 numbers I’ve reiterated the hold thesis on Community Health Systems, Inc. (NYSE:CYH). As we continue to ratchet up the quality spectrum at HB Insights we are seeking selective opportunities to add tactical alpha, thereby searching for appropriate longs and shorts in the process. CYH continues to rate a hold with declining operating margins and lack of earnings upside looking ahead. See our previous analysis on CYH here.
CYH 12-month price evolution: Substantial downside from April FY22
Note: Daily bars, total price return (Data: Refinitiv EIkon)
CYH Q3 earnings reiterate previously outlined headwinds
In my previous outlook on CYH there was several obvious factors that stood out as red flags moving ahead. From its latest numbers, we can add in the theme of liquidity preservation. Quoting directly from the last report:
…[CYH] exhibits a number of potential headwinds whilst continuing its erosion of operating value on a quarterly basis. With little flesh to put on the skeleton here, we rate CYH neutral…until evidence presents to re-rate to the upside.”
Turning to the latest quarter, there’s little evidence to suggest otherwise. CYH had missed its numbers by admission in Q2 FY22 and trends continued into the third quarter. It clipped downsides versus consensus at the top and bottom lines. Net operating revenue came in with a ~290bps YoY decline to $3.025 Billion (“Bn”) which pulled through to a ~165bps YoY increase in operating expenditure (“OpEx”).
As a result, quarterly operating margin compressed 40% to $204mm, or 6.74% of revenue. Same-store revenues also tightened by 230bps YoY, driven by a 710bps decrease in net revenue per admission. The reduction in revenue/admission stemmed from lower Covid-19 volumes. In addition, hurricane Ian resulted in a 33bps headwind to Q3 revenue. The impulse effect from closures and associated costs built in another 66bps of revenue downside.
Further contraction was observed in 2022 YTD cash from operations (“CFFO”) tightening to $291mm, down from $667mm this time last year [excluding Medicare accelerated payments made in the first 9 months of FY21]. Thus, non-GAAP EBITDA margin came to 9.4%, and net leverage [net debt/EBITDA] therefore increased to 7.3x. Alas, a reduction in cash-earnings, declining top-bottom line growth, and EPS downside are key takeouts from CYH’s 3rd quarter.
These headwinds look to have pushed CYH towards tightening up the taps on liquidity. For instance, total capital expenditures (“CapEx”) for the 9 months to Q3 FY22 tightened by 14.9% to $284mm [versus $334mm in FY21]. The decrease reduced capital intensity requirements by ~235bps YoY, with quarterly invested capital drifting from $10.94Bn to $10.7Bn. Ceteris paribus, this may or may not have benefits on capital intensity and return on investments for CYH looking ahead. As an additional liquidity preservation measure, management also extinguished $267mm of debt via an open market debt repurchase program. There are now no debt maturities until FY26 for CYH.
A look at what changed for CYH in Q3
There’s several variables that must to be noted in the CYH investment debate following its Q3 FY22 earnings:
- CYH’s operating-level numbers have aligned to broad-market trends observed this YTD in the health care providers [equipment, services] sector. I’ve often benchmarked company trends in inpatient/outpatient patient volume against national hospital [inpatient, outpatient, community, etc] data. From the latest Kaufman Hall National Hospital Flash Report for October 2022, hospital operating margins are still in the red for the YTD, coinciding with a drop in revenues across the board. Moreover, there’s been only a marginal decrease in expenditure inputs this YTD, with trends continuing last month.
- The Kaufman Hall report explicitly says “[w]hen taken altogether, the expense pressures and volume and revenue declines could force hospitals to make difficult decisions around the services they are able to safely provide to patients”. CYH has already made such decisions in consolidating several markets that it does not project long-term investment return. It’s also tightened CapEx this year. I’d say this should be looked at closely by investors, in order to gauge the company’s capital intensity looking ahead.
- CYH also realized these compressing factors at the margin [described earlier] and patient volume. Volumes were down across the board despite outpatient visits sliding upwards toward the end of the quarter. However, same-store admissions were down 220bps YoY, with Covid-related patients just 5% of total admissions [vs 13% in Q3 FY21]. CYH’s focus on service-line investments appears to be recognized, as same store surgeries were up 5.3% YoY. Growth was strongest in orthopaedics, spine and neuro procedures. Compared to FY19, CYH is at 101% of admissions, and 99% of FY19 ED patient turnover. This would be an impressive stat, except that the company’s revenue is down on FY19 quarterly averages of $3.2Bn at the same time.
- CYH realized a 500bps YoY increase in employee costs [avg. hourly employee rate], pushing the company to reduce hours worked, lower inpatient days and convert employees onto contract labor. It’s doing this whilst simultaneously downsizing contract labour. Q3 FY22 contract labour expense was $100mm versus $60mm the year prior, but is down from $150mm in Q2 FY22 and $190mm in Q1 FY22. At the same time, internal RN hiring increased by 12%, although there’s no mention on where the labour was sourced from, and what guarantee this has in translating to efficacy and quality of service. The reduction in costs is an important change in dialogue this year, and was rampant throughout the Q3 earnings call. Per CEO, Tim Hingtgen:
Under incremental expense reduction initiatives, I’ve already mentioned the service consolidation and closure activities in a small number of markets, which will reduce expenses and investments where we simply do not foresee long-term return.
These were thoughtful and deliberate decisions and we have been careful not to disrupt long-term growth potential while recognizing that in today’s environment, sometimes some operations are not sustainable given these dynamics. Our margin improvement program now in its third year also continues to yield strong results and Kevin will provide more details in his remarks.”
Our internal forward estimates for CYH’s top-bottom lines are summarised in Exhibit 1. We see a large dip in net-earnings for FY22, with recovery not until FY24. It’s not unreasonable to see FCF conversion wind back to $0.63 per share in FY24 [from $1.05/share this year] by my estimation, and combined with an increasing cost of capital/discount rate, this reduces the future value of CYH’s cash flows into the future.
Exhibit 1. CYH forward estimates [quarterly, annual] into FY24
Data: HB Insights Estimates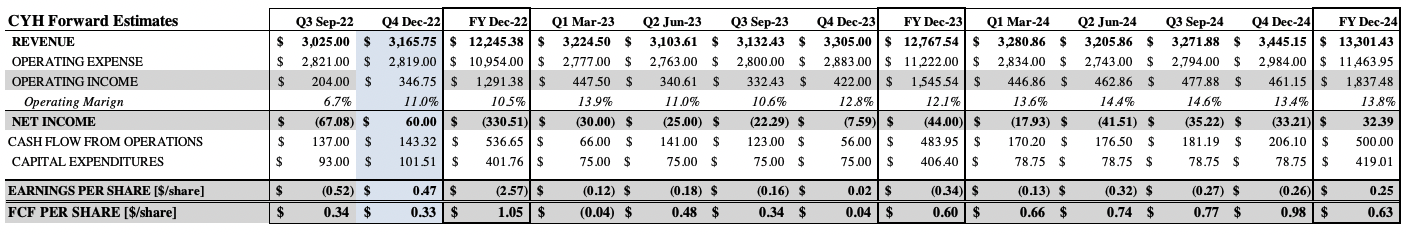
Valuation and conclusion
Following heavy selling in FY22, shares have re-rated heavily to the downside and trade at just 1.6x trailing earnings. Consensus has CYH priced at 1.76x forward earnings. As seen in Exhibit 3, in the upside case, our Q4 EPS estimates of $0.51 would value the CYH share price at $5.53 or 11x forward earnings, representing substantial upside from current market value and large divergence from consensus. However, looking at annual loss per share estimates of ($2.25), the case unravels. The question really stems to whether these multiples are warranted and attractive [or not] and how much is already priced in.
As seen in Exhibit 2, taking our FY22-FY24 estimates on face value, there looks to be a lack of earnings upside looking ahead, coupled with an increased FCF conversion. This aligns with CYH’s current trends of contracting operating margins and reduced return on invested capital. Alas, it’s difficult to foresee multiple expansion for CYH on these projections.
Exhibit 2. Forward estimates indicate a lack of EPS upside coupled with widening FCF conversion, placing doubts on multiple expansion
Data: HB Insights Estimates
With this in mind, it then turns to what cost and compensation we are up-taking in a position with CYH. As seen below, CYH’s TTM earnings yield is 10.75%. For our investment, there’s an implied risk premium of 9.13% above the risk-free rate, whereas CYH’s fair cost of equity is also 10.75%.
In our base case, we see the company’s FY22 loss per share to inflect negatively, keeping us firm at $2.44 per share [from previous analysis]. In the upside case below, the price target indicates a 88% upside potential, however, I don’t see this materializing with confidence once the company’s FY22 numbers are printed next year. The valuation in the upside case does, however, keep me neutral at this stage.
Exhibit 3. CYH Upside case: Sequential earnings growth implies potential mispricing for CYH share price. However, FY22 earnings are likely to tell different story. Question is, how much is already priced in.
Note: Q4 FY22 EPS Estimate of $0.51. (Data & Image: HB Insights Estimates)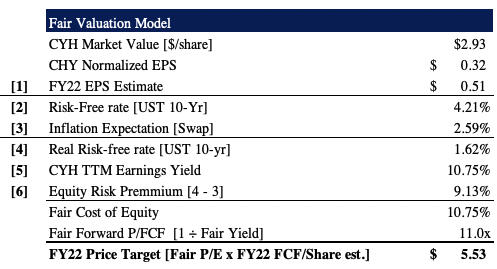
Net-net, I continue to rate CYH a hold following its Q3 numbers. The downside risk to earnings continued this quarter and management have been notably active on reducing drains and pulls on liquidity. With further earnings downside likely, I cannot help but presume this will inflect poorly on the CYH share price. Looking to the quarter ahead, shares could be undervalued at 11x our Q4 FY22 EPS estimates, however turning to FY22 results this looks to be offset. Question is how much of this downside has the market already priced in ahead of time. At this point, I’m not entirely sure, however there’s too many unanswered questions remaining. Rate hold, PT unchanged at $2.44.
Be the first to comment