

burwellphotography
The Fundamental Picture
Lyn Alden: “In this difficult macro environment (with an inverted yield curve, decelerating purchasing manager’s index, tightening monetary policy), blue-chip consumer staples stocks are a natural industry to reach towards.
One of the challenges, however, is that the good ones including Pepsi (NASDAQ:PEP) and Coke (NYSE:KO) are all near decade-high valuations. So, investors do have to pay up substantially in order to access the low-drama long-term compounding opportunity that many of these stocks have historically provided.”
“Here’s the PepsiCo F.A.S.T. Graph for example”:

FastGraphs
“We can break that down a bit more specifically. Here’s the cyclically-adjusted price/earnings ratio (which compares current price to the trailing five years of earnings as a smoothed ratio) for both Pepsi and Coca-Cola”:

YCharts
“As we can see, Coke usually has a valuation premium over Pepsi. Both were extremely overvalued in the late 1990s, and subsequently offered poor returns into the 2000s (especially Coke, which had terrible returns for the next decade). Then during most of the 2010s decade, hey were quite reasonably valued. In recent years, they’ve become rather richly-valued again. I think investors should brace themselves for long-term forward returns that are better than from the 1990s valuation peak, but worse than from the 2010s valuation trough.
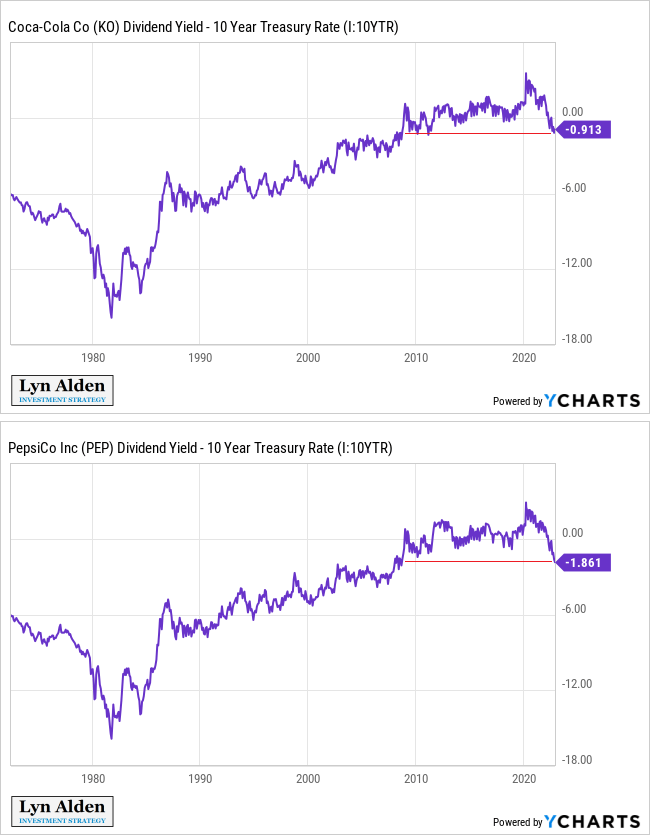
“Another metric we can look at is the spread between their dividend yields and the 10-year Treasury rate”:
YCharts
“Decades ago, 10-year Treasuries offered way higher yields than these stocks offered dividend yields (i.e. the spread as deeply negative), which was offset by the fact that these dividends would grow each year. The 2010s decade was an unusual period where 10-year Treasury rates were so low, that sometimes the dividend yields of these companies were higher than for Treasuries, and still came with growth.
After the recent rise in Treasuries, Coke and Pepsi are both trading at valuations such that the spread between their dividend yield and the 10-year Treasury yield is at the worst point it has been for over a decade. You get a much lower yield with these stocks than with 10-year Treasury in exchange for growth. In the 2010s it was a no-brainer to hold these stocks over Treasuries; now it’s less clear and depends on an investor’s needs.”
The Technical Viewpoint
MotiveWave
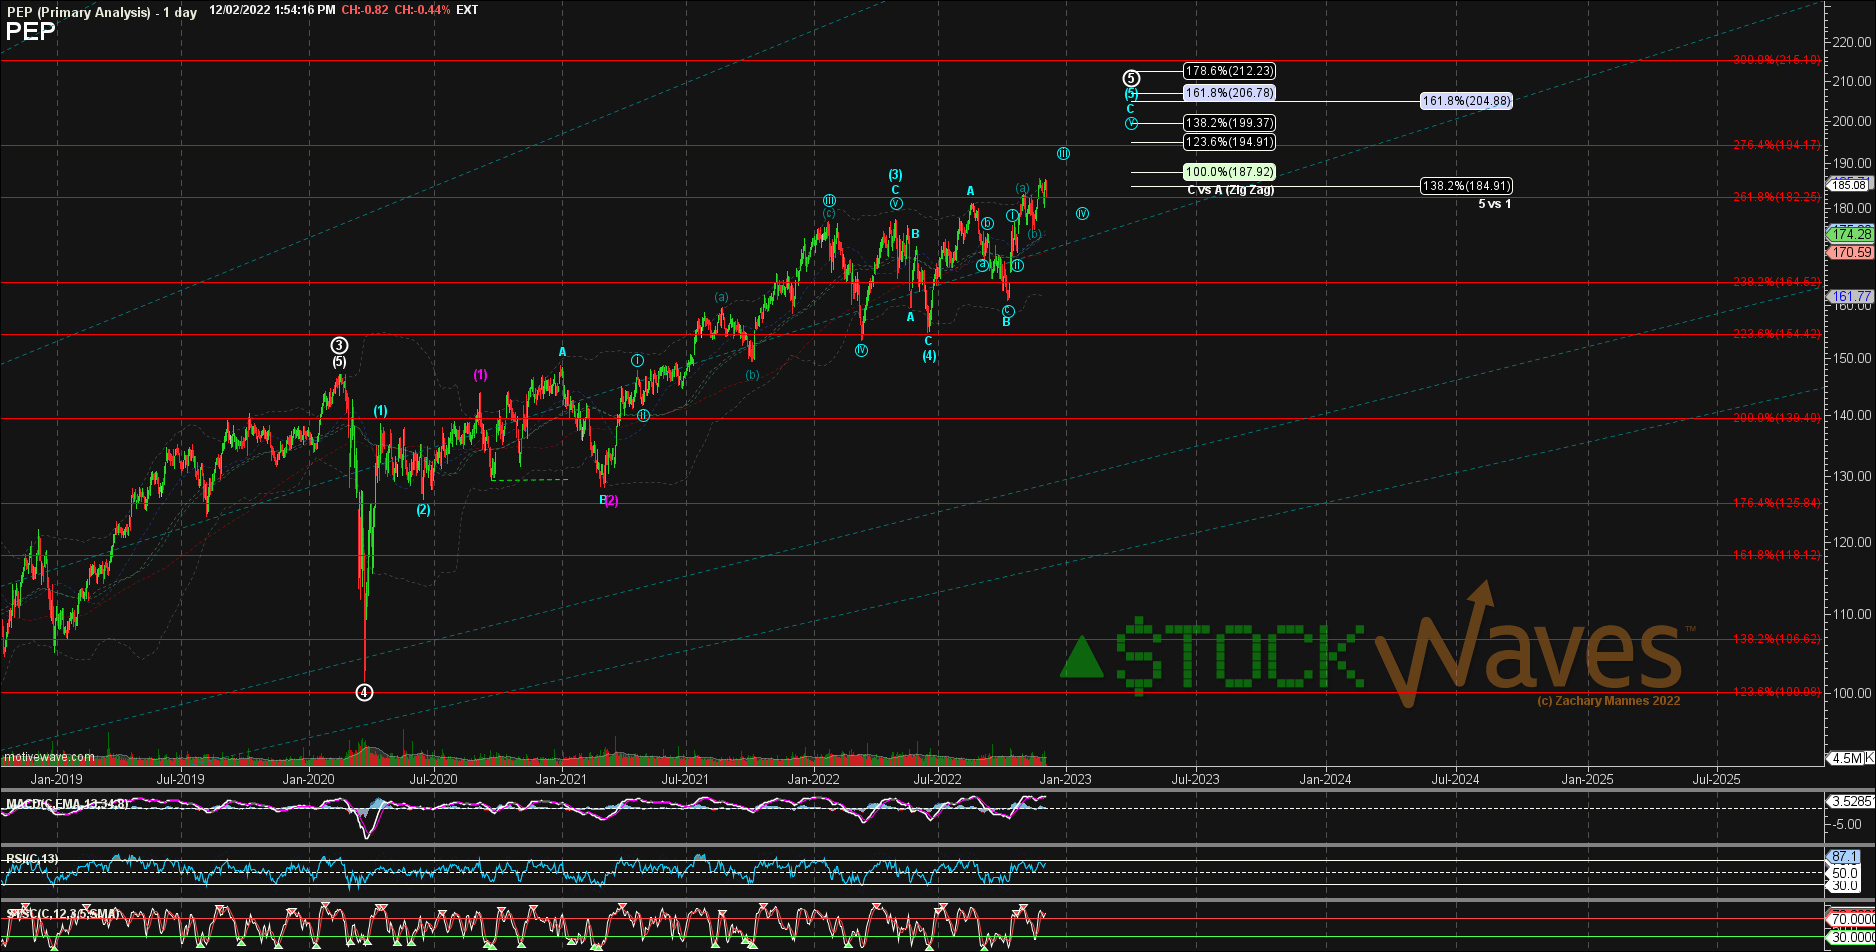
Here are Zac’s comments regarding PEP:
“Love how that PEP FAST graph fits with a larger degree 5-up completing. A retrace back toward 100 might not be all of a larger correction but would make it more palatable.”

MotiveWave
And, for KO, Zac’s recent commentary:
“We favor KO for a more reliable path higher next year but it’s a very similar cola taste, just not as cloyingly sweet.”
As you can see from the attached charts, we do anticipate that both stocks will see higher into 2023 and that’s the most probable path at this time.
So, how do we harmonize fundamentals and technicals in these and other stocks that we follow? Please allow me to share with you a portion of this article written by Avi Gilburt:
When To Properly Use The F-Word (Fundamentals) When Investing
You can read this article in its entirety here, and I would encourage you to do so. It will likely challenge some beliefs that you currently hold and perhaps even cherish.
How To Analyze Market Sentiment Along With Market Fundamentals
Here’s a brief excerpt that explains how we view fundamentals and technicals:
“With all this being said, I want to now explain why I view fundamentals as important. Remember that market sentiment is the primary driver when we are dealing with investment products wherein mass sentiment is evident. However, this is not an absolute perspective. Rather, it’s based upon a continuum of sentiment.
You see, while the (SPY) is an example of an investment product that presents us with the ultimate in mass sentiment, a microcap biotechnology company may be on the opposite end of that continuum of sentiment. Within the example of the microcap, sentiment can be a factor, but the fundamentals of the company are going to be the primary driver of this stock. And all products run somewhere within that continuum. The greater the mass sentiment being evident within the buying and selling of that product, the greater probability that sentiment will be the driver of price. And the reverse is true.”
Conclusion and Risks
Consider Lyn’s take on current valuations and the spread of each stock’s respective dividend yield with the 10-year treasury. Also, we have specific support levels that should hold for these to continue on to their targets overhead. If KO were to break below the $58 area, it may signal a deeper correction. And for PEP, the $165 – $170 level represents current near-term support.
In sum, we view both KO and PEP as reaching for higher highs into 2023. Those highs, when struck, would likely mark a significant and longer-lasting high in price for both. Why can we state this?
There’s no other analysis methodology that we know of today that shows proper context of where a major company or index finds itself at any one moment in time. If you look at the entire structure of both tickers you can then identify how one more high will complete a larger pattern since the lows in 2009.
It’s All About The Context
We understand that context is the entire text of a writing. Here’s a fuller definition: “The circumstances that form the setting for an event, statement, or idea, and in terms of which it can be fully understood and assessed.”
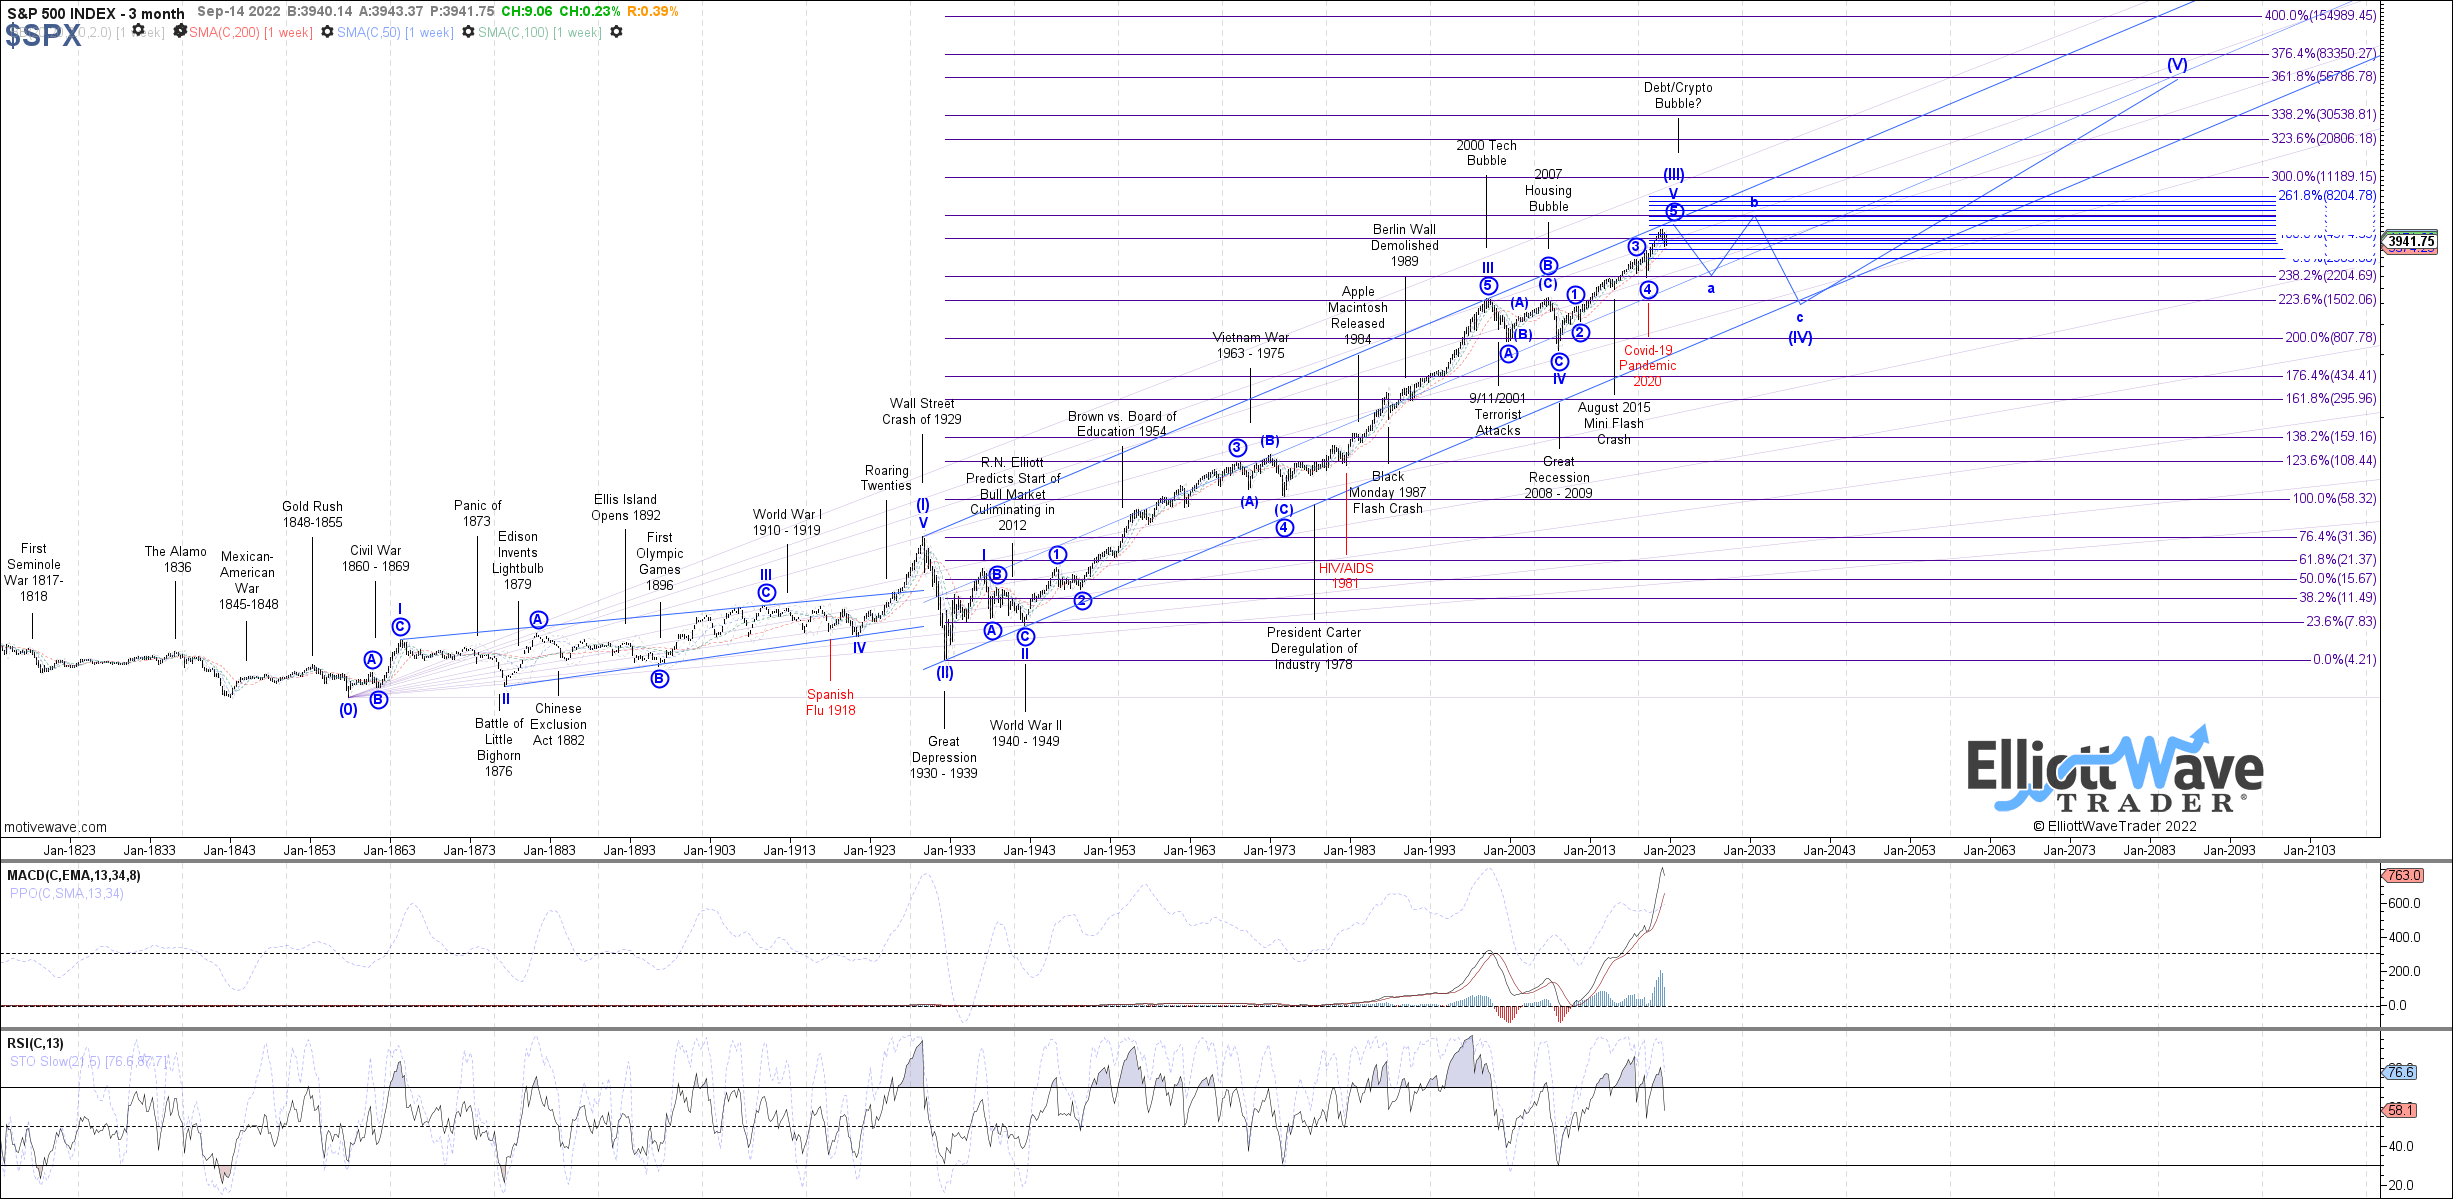
Here’s a fantastic example of context and the bigger picture in which we find ourselves. This is a more than 100-year chart history for the SPX, annotated with major events along the way. One of our senior analysts, Garrett Patten, has meticulously plotted and maintained this chart showing where we are in the journey.
MotiveWave
Comprehending the context of the moment tells us how deep of a corrective move to anticipate. It also speaks to proper expectations for upside rallies. One of the finest samples we have of how context should mold our viewpoint is what we posted last week regarding Nvidia (NVDA). Please revisit that article here.
The main takeaway from that piece was the context provided back in November 2021 with NVDA and many like stocks striking important highs in price. Because of the larger structure and the understanding that gave us, a deep and drawn-out correction was anticipated. This proved to be the case as you can see from recent history.
So to recap, we view both KO and PEP as reaching for new highs, but from the structure of price, the corrections from those highs will likely be protracted in both time and price going forward.
I would like to take this opportunity to remind you that we provide our perspective by ranking probabilistic market movements based upon the structure of the market price action. And if we maintain a certain primary perspective as to how the market will move next, and the market breaks that pattern, it clearly tells us that we were wrong in our initial assessment. But here’s the most important part of the analysis: We also provide you with an alternative perspective at the same time we provide you with our primary expectation, and let you know when to adopt that alternative perspective before it happens.
There are many ways to analyze and track stocks and the market they form. Some are more consistent than others. For us, this method has proved the most reliable and keeps us on the right side of the trade much more often than not. Nothing is perfect in this world, but for those looking to open their eyes to a new universe of trading and investing, why not consider studying this further? It may just be one of the most illuminating projects you undertake.
Be the first to comment