

tadamichi
September was a repeat of August but worse, as an early-month rally was erased by continued inflationary concerns. The Consumer Price Index (CPI) release on September 13th was much worse than expected with the August core CPI of 6.3% accelerating from the 5.9% print for July. This refuted the “peak inflation” narrative, and it triggered a major sell off, which eliminated the nearly 4% month-to-date gains in one day. This unfortunate data point put investors on edge. The Federal Reserve ((Fed)) boosted the Federal Funds rate another 75 basis points the next week, which was anticipated but the outlook suggested more hikes are likely and the Federal Funds rate will stay elevated for longer than investors had expected. This led to a widening gap between the two-year and ten-year Treasury bond spread to inversion levels not seen since the 1980s. The disappointing outlook for the Fed Funds’ rate and rising recessionary fears led to a pronounced retracement for the S&P 500 Index that took out the June lows. Over the final 14 days of trading in September, the Index could only muster three up days.
Not surprisingly, the more defensive sectors fared better this month, but no sector was able to post a positive return. The three best performing sectors were Health Care (down 2.6%), Financial Services (down 7.8%) and Consumer Staples (down 8.0%) and the bottom three sectors were Real Estate (down 13.2%), Communication Services (down 12.2%), and Information Technology (down 12.0%). For the month, the S&P 500 Index declined 9.2% and the Russell 1000 Value Index fell 8.8%. The Coho Relative Value ESG portfolio posted a decline of 7.3%.
The third quarter was very volatile. July’s return was the best of the year with the S&P 500 Index gaining more than 9% and the Russell 1000 Value Index advancing more than 6.5% but all those gains were more than offset by August and September’s declines. When the quarter ended, the S&P 500 Index had fallen 4.9%, and the Russell 1000 Value Index had declined 5.6%. The Coho Relative Value ESG portfolio was down 4.1%.
Year-to-date, the broader averages are either in bear market territory or close to it. The S&P 500 Index has fallen 23.9%, and the Russell 1000 Value Index is down 17.8%. Our philosophy focuses on downside protection, which is reflected in the smaller 14.7% decline for Coho’s ESG portfolio. Investor anxiety throughout 2022 has favored our strategy as investors have gravitated to the more demand defensive sectors. We tend to always overweight those sectors as investors tend to flock to them in times of uncertainty, as evidenced again by this period.
The near-term future returns will likely be influenced by a number of major issues, which include the mid-term elections, the threat of nuclear weapons in the Russia/Ukraine war, the increasingly likely probability of a potential recession of uncertain duration, fading consumer confidence, and lingering inflationary worries. If we are correct in this outlook, we would expect estimates for the S&P 500 Index in 2023 and possibly 2024 will need to be reduced, with the disproportionate impact hitting the more economically sensitive sectors. Thus, we believe our portfolio positioning should continue to provide good relative results.
Table 1 shows a number of holdings that Coho has owned continuously for at least the last five years. We believe many of these have compelling risk/returns. All of these companies raised their dividend in 2021 and 2022, and we anticipate that they will all do so again in 2023. We believe these companies are performing very well with strong management teams and healthy balance sheets which give them a great deal of financial flexibility. Most of these holdings have relatively low P/E multiples and most have competitive dividend yields against the benchmarks. Free cash flow for this group is meaningful, and we anticipate that these managements will deploy these flows to maximize shareholder value.
Table 1 Select Coho Holdings
|
Price 9/30/22 |
2021 EPS |
2022 EPS (E) |
2023 EPS (E) |
2021 P/E |
2022 P/E |
2023 P/E |
Dividend Yield |
|
|
Amgen (AMGN) |
$225.40 |
$17.10 |
$17.44 |
$18.90 |
13.2x |
13.2x |
11.9x |
3.4% |
|
ConAgra (CAG) |
$32.63 |
$2.38 |
$2.51 |
$2.50 |
13.7x |
13.0x |
13.1x |
4.1% |
|
CVS/Caremark (CVS) |
$95.37 |
$8.40 |
$8.55 |
$9.04 |
11.4x |
11.2x |
10.6x |
2.3% |
|
Grainger W.W. (GWW) |
$489.19 |
$19.84 |
$28.04 |
$29.84 |
24.7x |
17.4x |
16.4x |
1.4% |
|
Kroger (KR) |
$43.75 |
$4.06 |
$4.14 |
$4.06 |
10.8x |
10.6x |
10.8x |
2.4% |
|
Lowe’s (LOW) |
$187.81 |
$11.97 |
$13.52 |
14.69 |
15.7x |
13.9x |
12.8x |
2.2% |
|
Microchip Technology (MCHP) |
$61.03 |
$4.19 |
$5.61 |
$5.65 |
14.6x |
10.9x |
10.8x |
2.0% |
|
Smucker (SJM) |
$137.41 |
$8.41 |
$9.14 |
$9.14 |
16.3x |
15.0x |
15.0x |
3.0% |
|
State Street (STT) |
$60.81 |
$7.44 |
$7.12 |
$8.51 |
8.2x |
8.5x |
7.1x |
4.1% |
|
S&P 500 Index |
$3585.62 |
$203.79 |
$224.35 |
$241.90 |
17.6x |
16.0x |
14.8x |
1.9% |
|
Russell 1000® Value Index |
$827.24 |
$59.50 |
$65.73 |
$69.60 |
13.9x |
12.6x |
11.9x |
2.5% |
| Source: FactSet; (E)= estimated. Past performance is not indicative of future results. |
Analysts’ bottom-up estimates for both 2022 and 2023 for the S&P 500 Index are beginning to decline. The peak estimate by analysts for 2022 occurred in June at $229.60 and the current estimate is $224.35, down about 2%. The 2023 estimate peaked at $251.61 in May, and it has now fallen by less than 4% to $241.90. We anticipate that current estimates for both years will need to come down further to reflect the current economic environment. We strongly believe that investors will gravitate to companies that have stability and predictability of their earnings. The companies shown in Table 1 have these qualities and as such, we believe they should protect if the markets continue to correct and still participate in any market recovery.
Another weight on forward earnings is the remarkable strength of the U.S. dollar (USD). A strong dollar negatively impacts companies with large overseas revenues. The 15% year-to-date change in the U.S. Dollar Index (DXY) would alone imply a 7-8% headwind to S&P 500 Index earnings with each 1% increase equating to roughly a -0.5% impact to earnings. Perhaps more worrisome is the fact that moves of this magnitude in the DXY have typically led to cracks somewhere in the global macro environment as seen in Chart 1 below.
Chart 1 U.S. Dollar Index (DXY) year/year change
Sources: Morgan Stanley, Bloomberg
Coho is not immune to the earnings pressure exerted by a strong USD, although the ESG portfolio on the whole has modestly less foreign revenue exposure relative to the S&P 500 Index. The most impacted Coho stock would be Mondelez International, which gets about 75% of its revenues outside the U.S.
A separate concern we have is the recent dramatic increase in interest rates. Chart 2 shows the change in the yield curve over the past year. Clearly all maturities have experienced rising rates over this period, but concerning now is that the two-year note has a higher yield than the ten-year note. The probability of a recession increases when such an inversion occurs, and as noted earlier, the level of inversion today hasn’t been seen in nearly 40 years.
Chart 2 Change in the Yield Curve over the Past 12 Months
Source: FactSet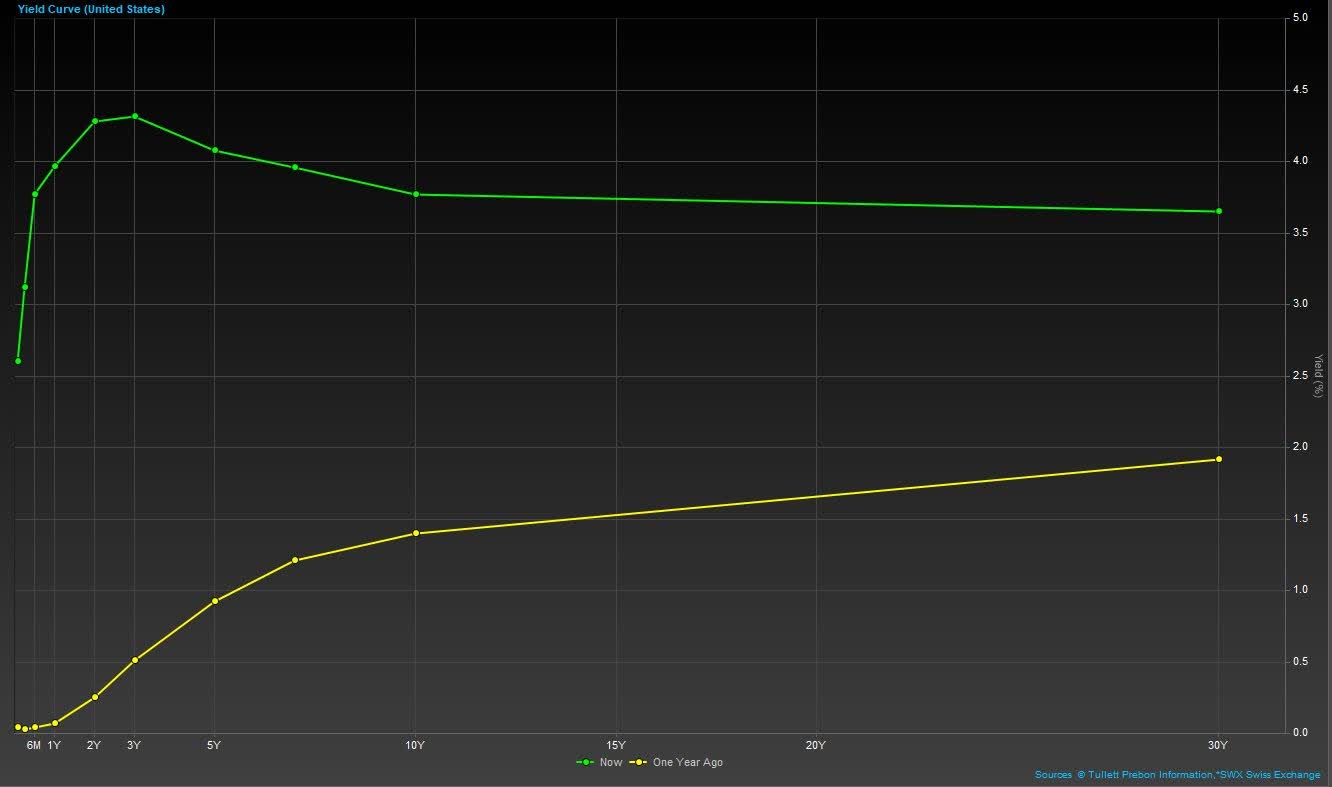
The recent spike in the 30-year fixed mortgage rate also has negative consequence for consumers. Chart 3 shows the change in this rate over the past ten years. Rates were under 3% in early 2021 but have now soared to over 6.5%. A homebuyer with a $500,000 mortgage would have had a monthly payment of roughly $2,100 if they had locked in when the rate was 3%. Today, that same mortgage would have a monthly payment of more than $3,100. Such a sudden shift in rates is crimping would be homebuyers’ buying power and existing homeowners are now more reluctant to move because they cannot take their mortgage with them.
Chart 3 Historical 30-Year Fixed Mortgage Rate
Source: FactSet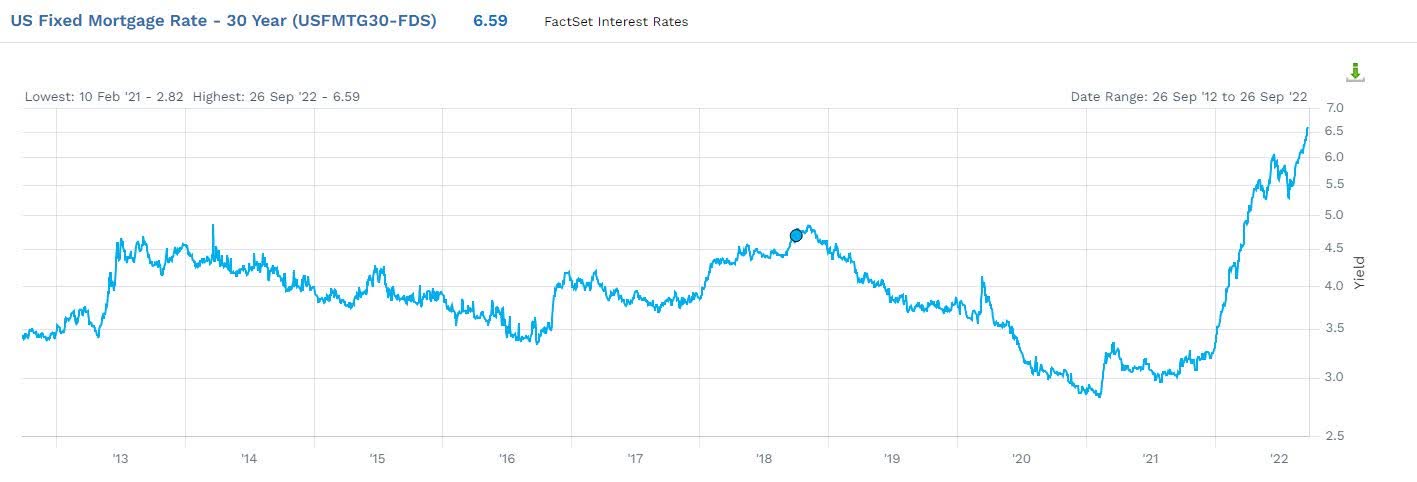
The final quarter of this year will likely be volatile. The risks we outlined above lead us to believe a recession is likely in the U.S. and all but inevitable in Europe. Analysts will be closely examining the upcoming third quarter earnings season and more importantly the outlooks given by management. We would not be surprised to see a wider-than-normal separation in expectations within sectors, which could provide opportunities for a long-term investor. We will be on alert for opportunities to improve the portfolio’s return, while simultaneously reducing risk.
On the ESG front, we recently published our annual Impact Report highlighting the sustainability initiatives and continued progress across environmental, social, and governance accomplished by our portfolio holdings. This year, we reviewed the key trends of the 2022 proxy season and noted encouraging expansion of board accountability beyond governance to sustainability. Board diversity remains a trending topic and we were pleased to see that 100% of our portfolio holdings had at least 20% female board members. In terms of environmental impact, we focused on carbon footprint and net-zero commitments. It was encouraging to see that more and more companies are joining the net-zero journey, with most having their goals verified by the Science-Based Target Initiative (SBTi). We also discussed social impact, with topics including increasing fresh food availability and expanding health-care access. Looking ahead, we remain committed to continuing engagement activities and the deep integration of ESG across our fundamental research and proxy voting processes.
If you have questions or concerns about our outlook or the portfolio’s positioning, please do not hesitate to call us. We look forward to updating you on the progress of the portfolio as the year progresses.
Sincerely,
Coho Partners’ Research Team
|
The views, opinions and content presented are for informational purposes only. They are not intended to reflect a current or past recommendation; investment, legal, tax, or accounting advice of any kind; or a solicitation of an offer to buy or sell any securities or investment services. Nothing presented should be considered to be an offer to provide any Coho product or service in any jurisdiction that would be unlawful under the securities laws of that jurisdiction. Past performance is not indicative of future results. Use of the Russell indices: Source: London Stock Exchange Group plc and its group undertakings (collectively, the “LSE Group”). © LSE Group 2022. FTSE Russell is a trading name of certain of the LSE Group companies. Russell® is a trade mark of the relevant LSE Group companies and is/are used by any other LSE Group company under license. All rights in the FTSE Russell indexes or data vest in the relevant LSE Group company which owns the index or the data. Neither LSE Group nor its licensors accept any liability for any errors or omissions in the indexes or data and no party may rely on any indexes or data contained in this communication. No further distribution of data from the LSE Group is permitted without the relevant LSE Group company’s express written consent. The LSE Group does not promote, sponsor, or endorse the content of this communication. |
Editor’s Note: The summary bullets for this article were chosen by Seeking Alpha editors.
Be the first to comment