

bodnarchuk
Part I – Introduction
Chicago-based Coeur Mining (NYSE:CDE) released its second-quarter 2022 results on August 3, 2022.
Note: I have followed CDE quarterly since 2019 with 17 articles and counting. This new article is a quarterly update of my article published on June 13, 2022.
1 – 2Q22 results snapshot
Coeur Mining’s quarterly revenue was $204.12 million, representing a decrease of 5% year-over-year. Net loss was $77.43 million or $0.28 per diluted share, compared to an income of $32.15 million or $0.13 per share last year. Gold and silver sales represented 72% and 28% of quarterly revenue.
Gold Production increased at Kensington, Wharf, and Rochester this quarter to 83,772 Au ounces and 2,484 K Ag ounces. The company maintained its 2022 guidance
Below indicated are the 2Q22 highlights from the company’s presentation:
CDE 2Q22 Highlights (Coeur Mining)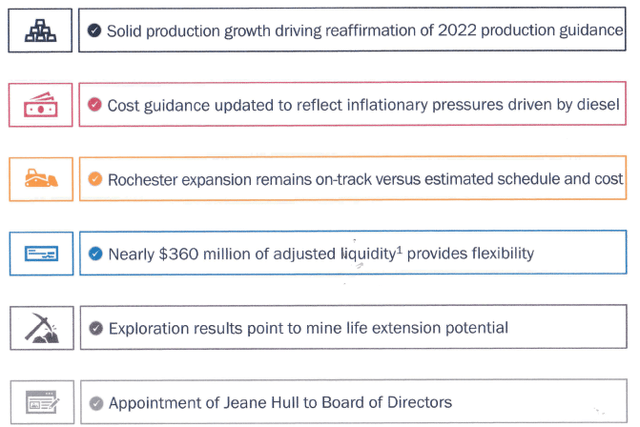
CEO Mitch Krebs said in the conference call:
three of our four operating mines delivered strong production growth compared to the first quarter. Solid metal sales, coupled with some positive changes in working capital led to a strong rebound in quarterly operating cash flow as well. As we look toward the second half of the year, our operations remain on track to achieve our full year production guidance.
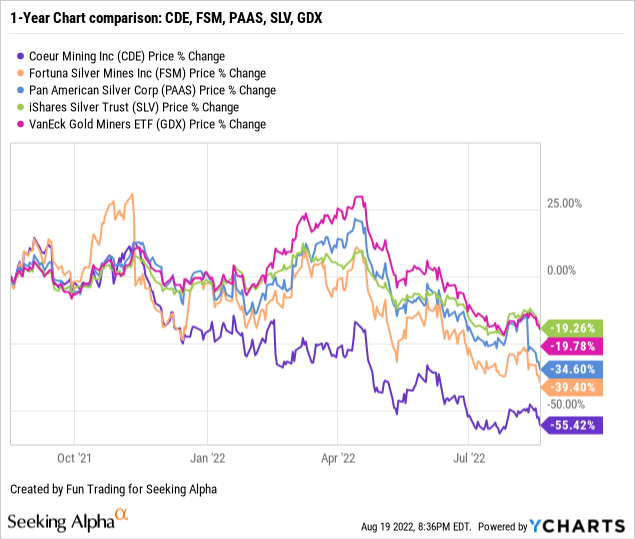
2 – Stock Performance
CDE sank dramatically on a one-year basis and has underperformed the iShares Silver Trust ETF (SLV) and the VanEck Vectors Gold Miners ETF (GDX), and even Pan American Silver (PAAS) and Fortuna Silver Mines (FSM). The stock is down 55%.
3 – Gold And Silver Production In 2Q22
Strong performances at Palmarejo, Kensington, and Wharf mines this quarter.
3.1 – Palmarejo mine. Solid quarter.
CDE Quarterly Production at Palmarejo (Fun Trading)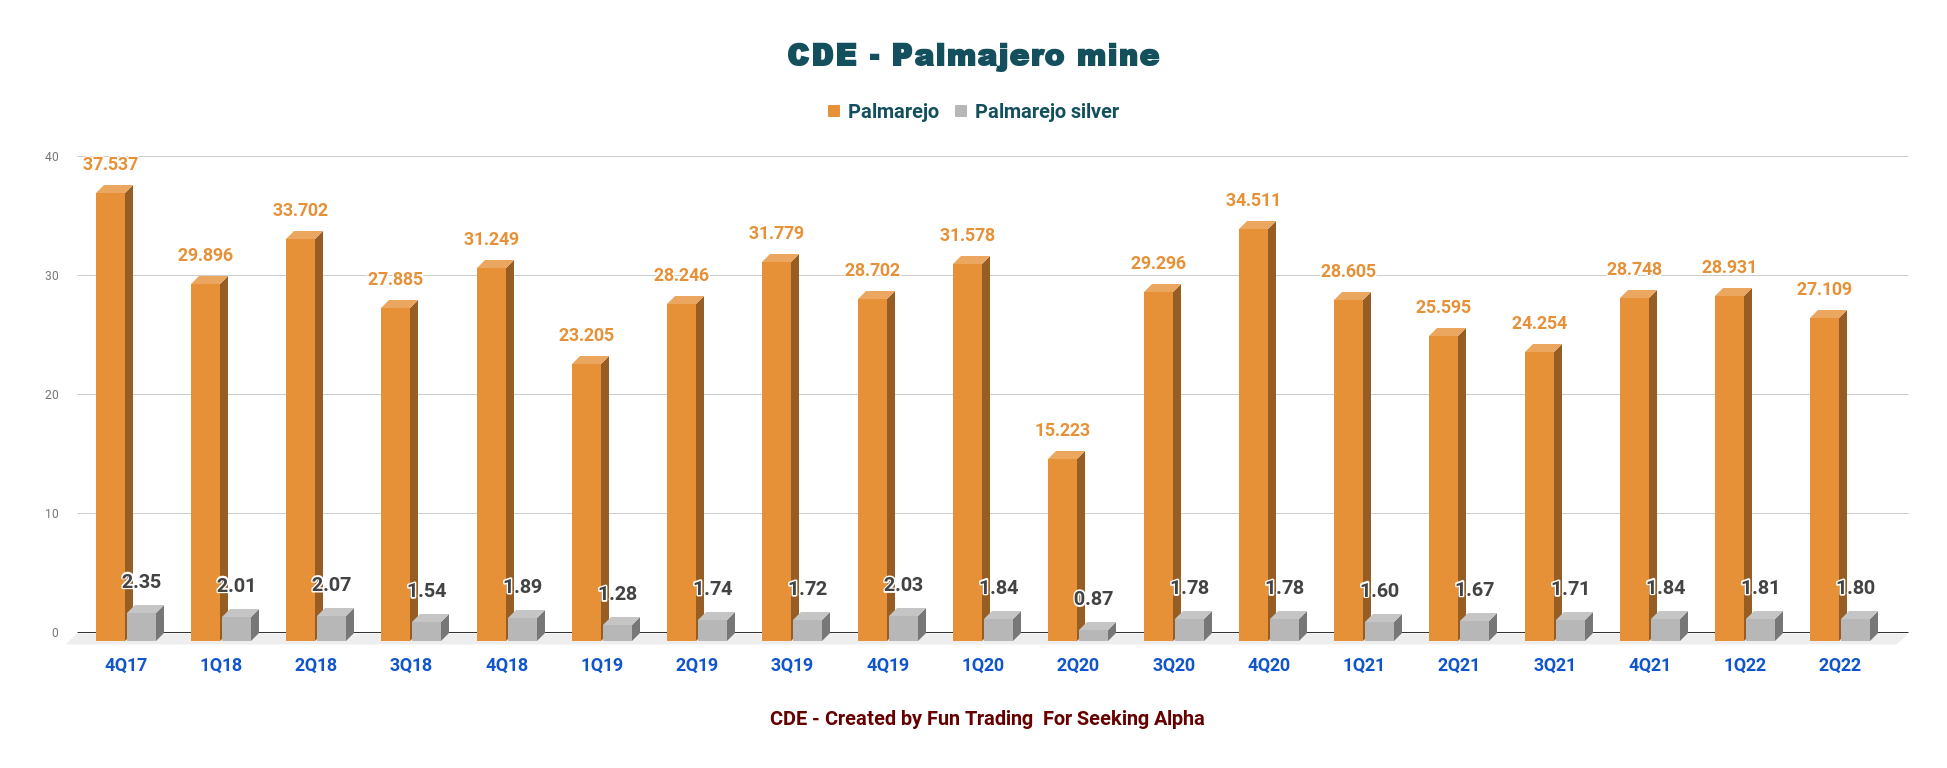
3.2 – Kensington mine. A better production this quarter.
CDE Kensington Production history (Fun Trading)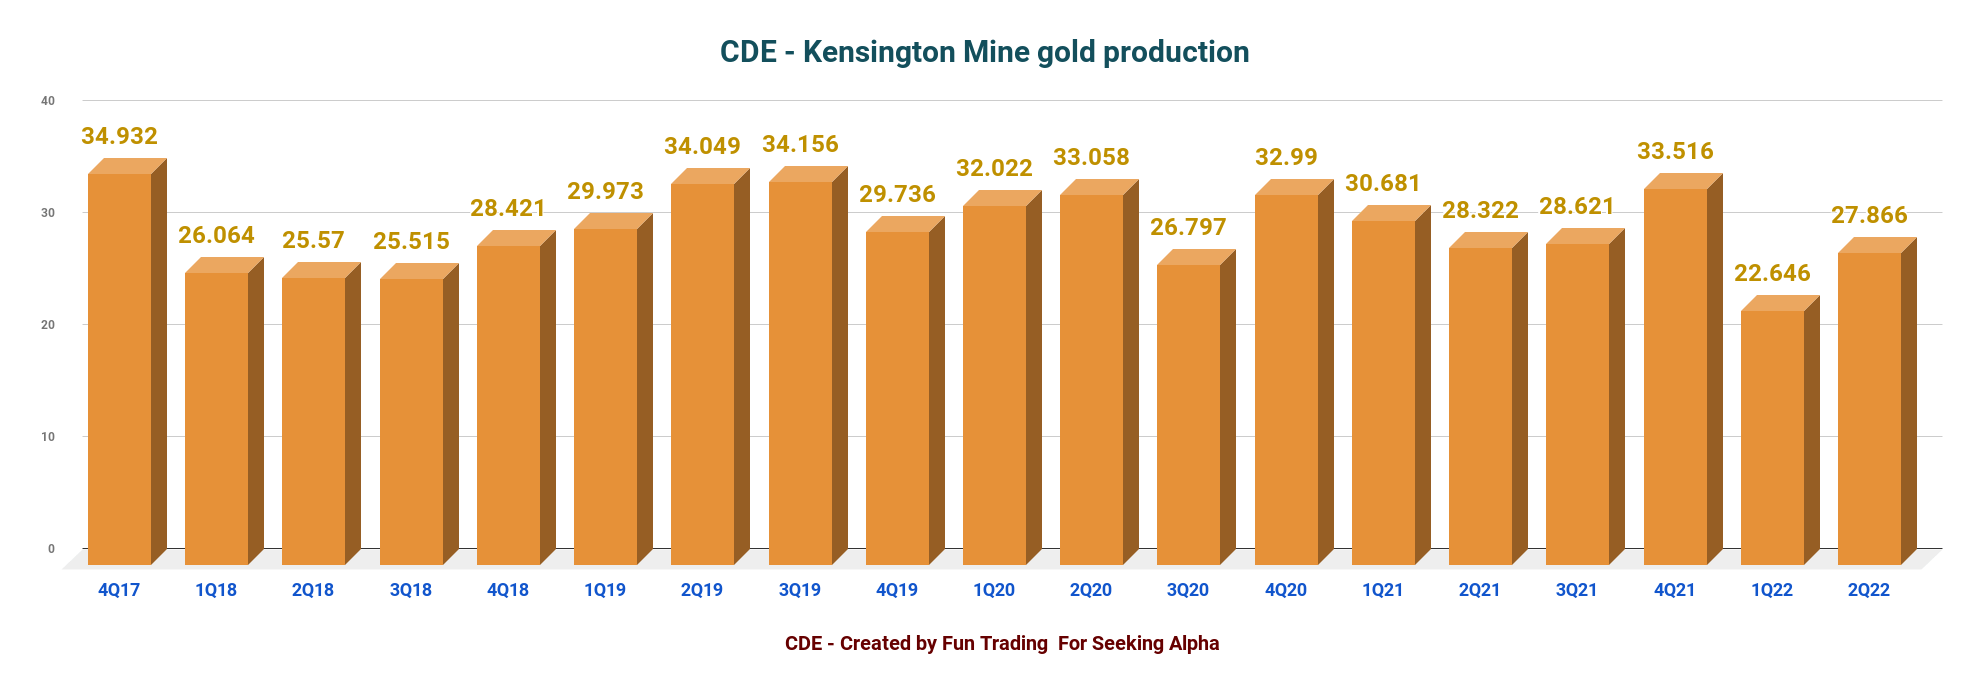
3.3 – Coeur Mining metal production
Gold and silver sales were 72% and 28% of quarterly revenue. Coeur Mining produced 83,772 Au ounces of gold (but sold 84,786 Au Oz) and 2.484 million Ag ounces (sold 2.5 Ag Moz) during the second quarter.
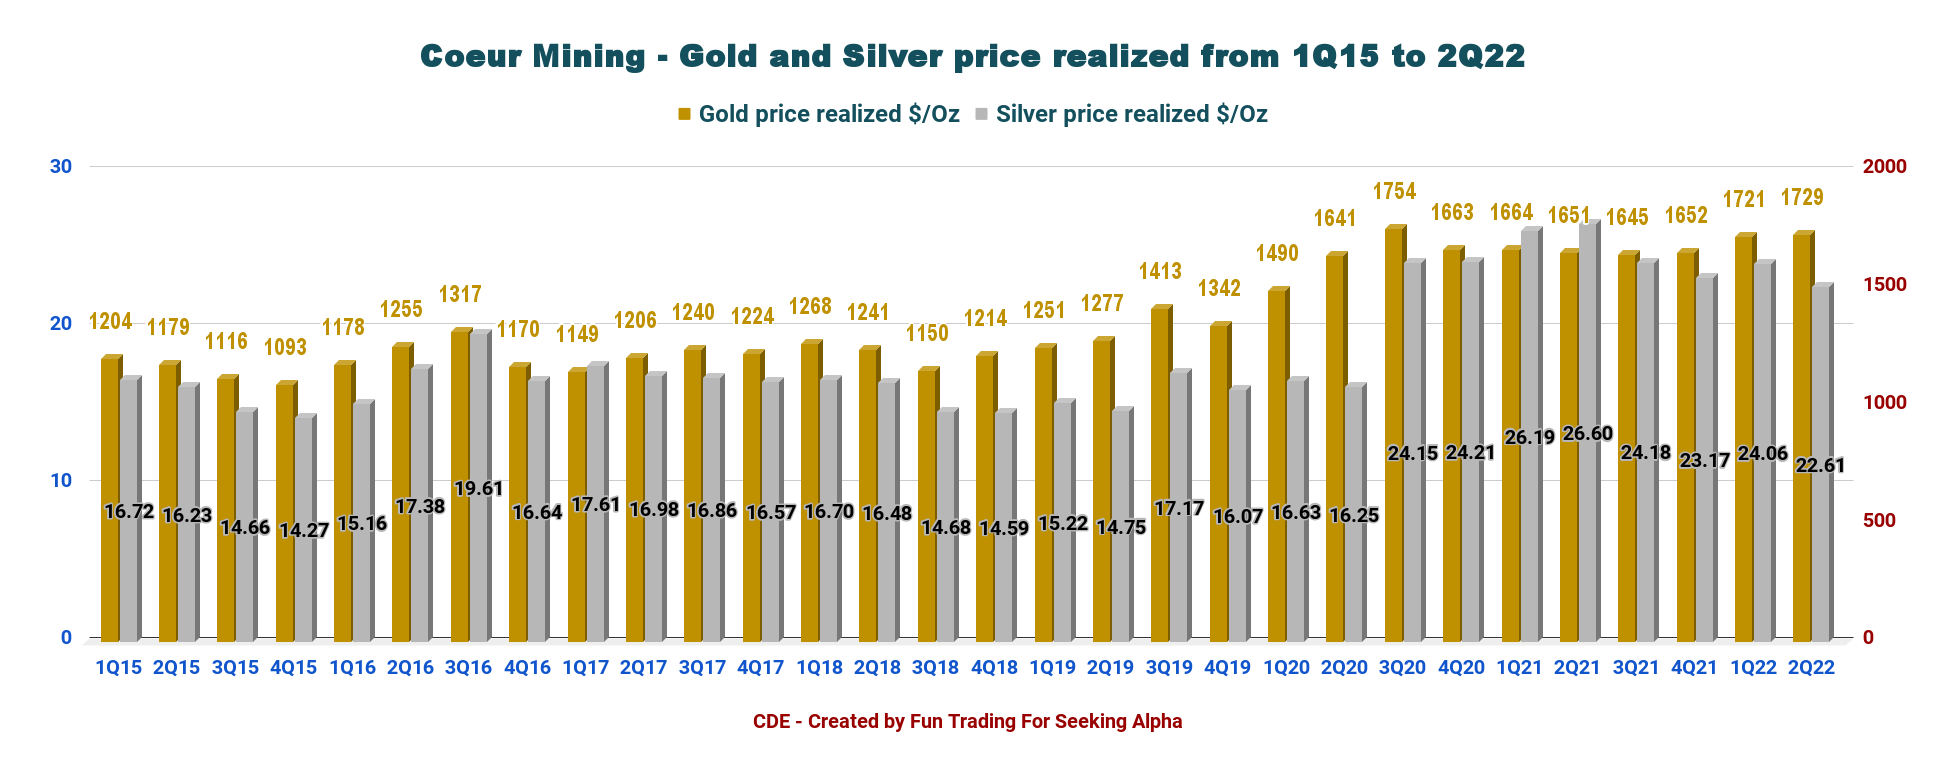
Average realized gold and silver prices for the quarter were $1,729 and $22.61 per ounce, respectively, compared to $1,651 and $26.60 per ounce in the prior period.
The Company’s U.S. operations accounted for approximately 58% of second-quarter revenue.
CEO Mitch Krebs said in the conference call:
With the completion of the Rochester expansion coming into view, we look forward to delevering the balance sheet with the strong cash flow we expect to generate. The next stage that awaits us post expansion, higher production, lower costs, positive free cash flow and reduced debt, will place Coeur in a great position to pursue other opportunities to further enhance the business.
CDE Quarterly production history (Fun Trading)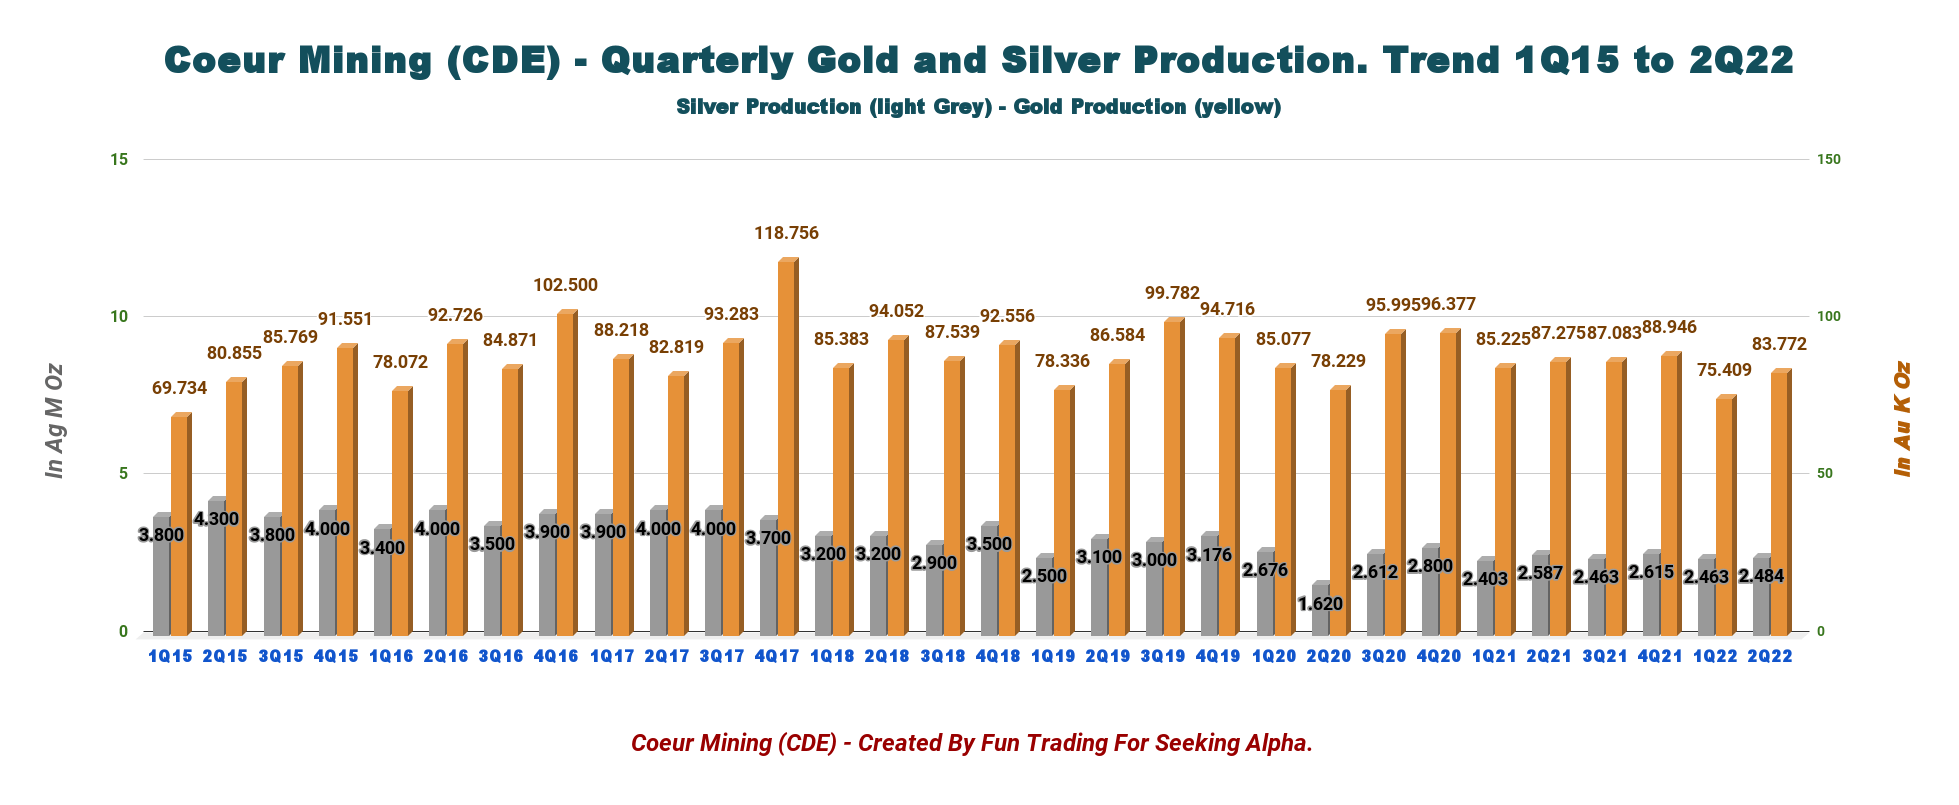
Below is the production per mine:
CDE Quarterly Production per mine in 2Q22 (Fun Trading) CDE gold and price history (Fun Trading)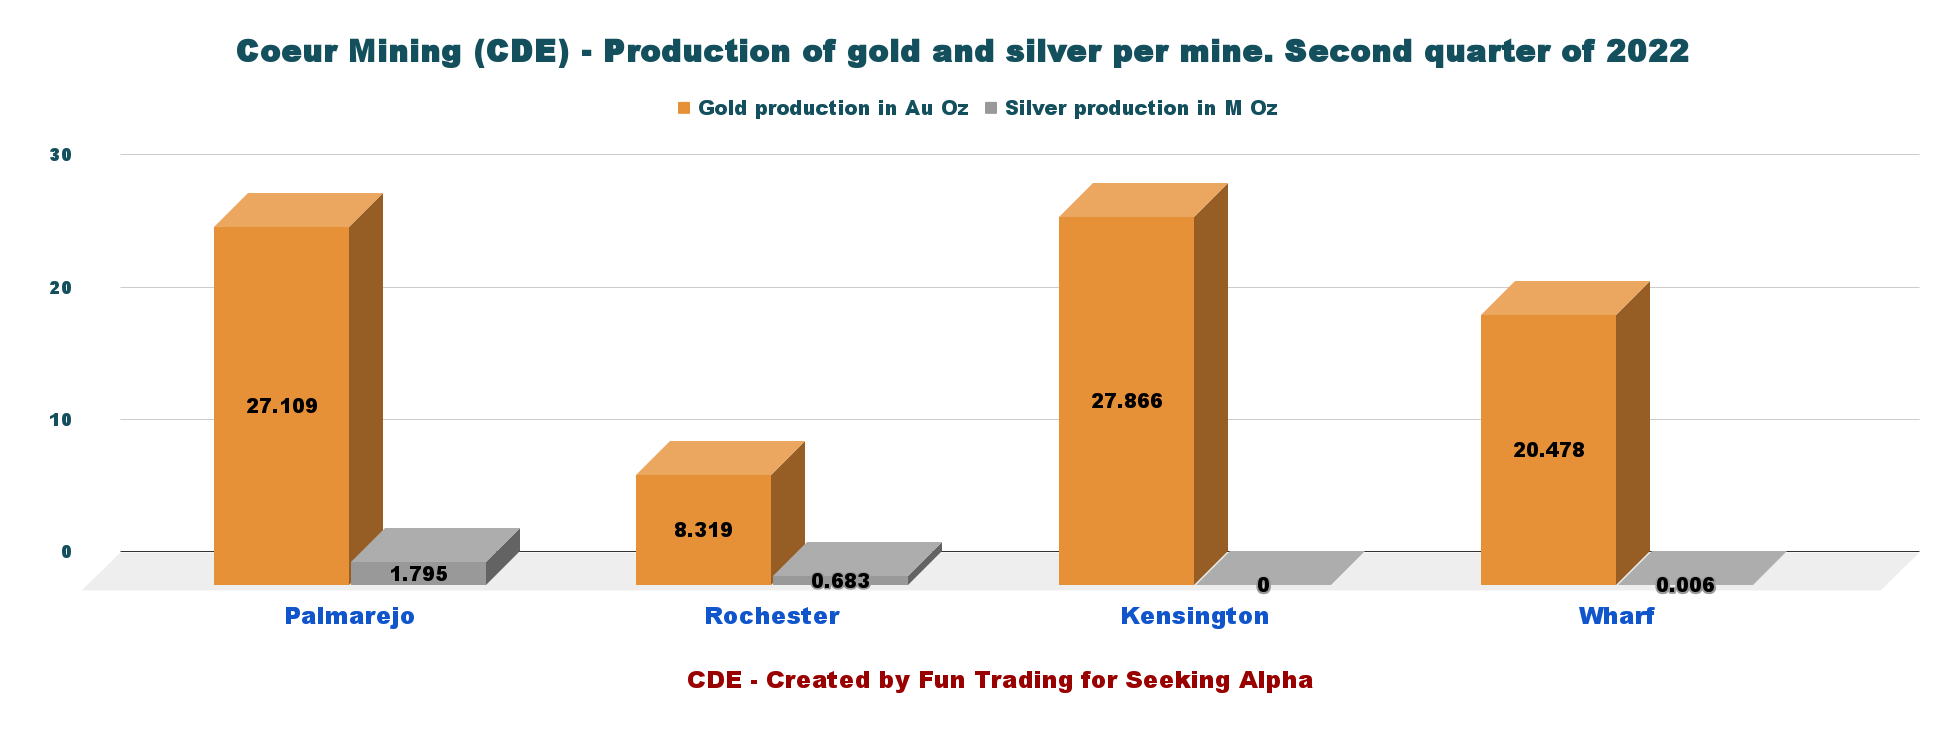
Note: Silvertip is expected to restart production in 2023, while Rochester expansion will be completed in early 2023. Also, the Rochester mine expansion is nearly completed and will significantly increase gold and silver production.
Rochester Expansion As of June 30, 2022, the total estimated project capital cost remained approximately $600 million. With the commencement of structural, mechanical, piping, electrical and instrumentation construction work, completion of final major high-voltage electrical contracts and initial commitments for the pre-screen addition to the expanded crusher circuit, the Company has committed approximately $523 million and incurred $350 million of the total estimated project cost through June 30, 2022. (Source press release).
Part II – Coeur Mining: Financials In 2Q22 – The Raw Numbers
| Coeur Mining | 2Q21 | 3Q21 | 4Q21 | 1Q22 | 2Q22 |
| Total Revenues in $ Million | 214.86 | 207.97 | 207.88 | 188.40 | 204.12 |
| Net income in $ Million | 32.15 | -54.77 | -10.76 | 7.68 | -77.43 |
| EBITDA $ Million | 84.07 | -14.58 | 27.91 | 39.96 | -33.29 |
| EPS diluted in $/share | 0.13 | -0.21 | -0.05 | 0.03 | -0.28 |
| Cash from operating activities in $ Million | 58.06 | 21.85 | 34.94 | -6.43 | 22.64 |
| Capital Expenditure in $ Million | 78.22 | 71.27 | 100.87 | 69.50 | 73.16 |
| Free Cash Flow in $ Million | -20.16 | -49.42 | -65.93 | -75.93 | -50.51 |
| Total cash $ Million | 124.08 | 85.02 | 56.66 | 73.33 | 161.70 |
| Total Debt (including lease obligation) In $ Million | 414.25 | 419.42 | 487.50 | 485.51 | 547.5 |
| Shares outstanding in Million | 252.1 | 254.7 | 257.15 | 263.56 | 278.04 |
Data Source: Company release
Analysis: Revenues, Free Cash Flow, Debt, And Production Details
1 – Revenues and trends – Revenues were $204.12 million in 2Q22
CDE Quarterly Revenues history (Fun Trading) Coeur Mining posted $204.12 million in revenues, with an EBITDA loss of $33.29 million and a cash flow loss from operating activities of $22.64 million. The adjusted net income was a loss of $13.1 million, or $0.05 per share.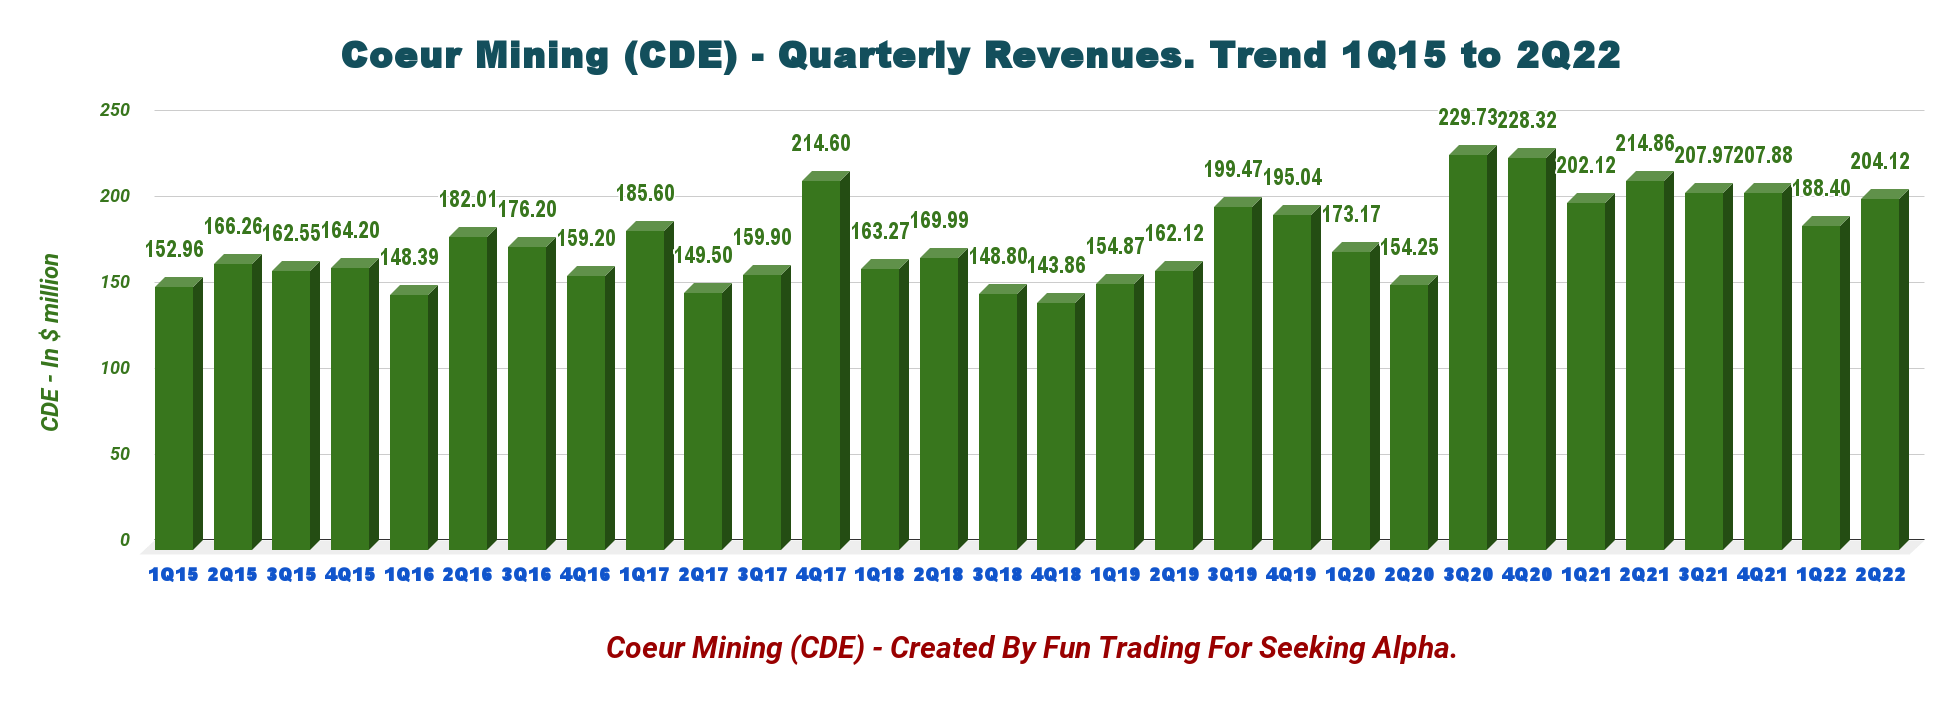
The company reported a net loss of $77.43 million, or $0.28 per diluted share, compared with an income of $0.13 per share a year ago.
Costs applicable to sales increased quarter-over-quarter to $151 million due to inflationary pressures on consumable costs.
On June 28, 2022, the Company announced the sale of 5 million shares of Victoria Gold for net proceeds of approximately $40 million, which is not included as part of Coeur’s second-quarter results.
2 – Free cash flow was a loss of $50.51 million in 2Q22
CDE Quarterly Free cash flow history (Fun Trading)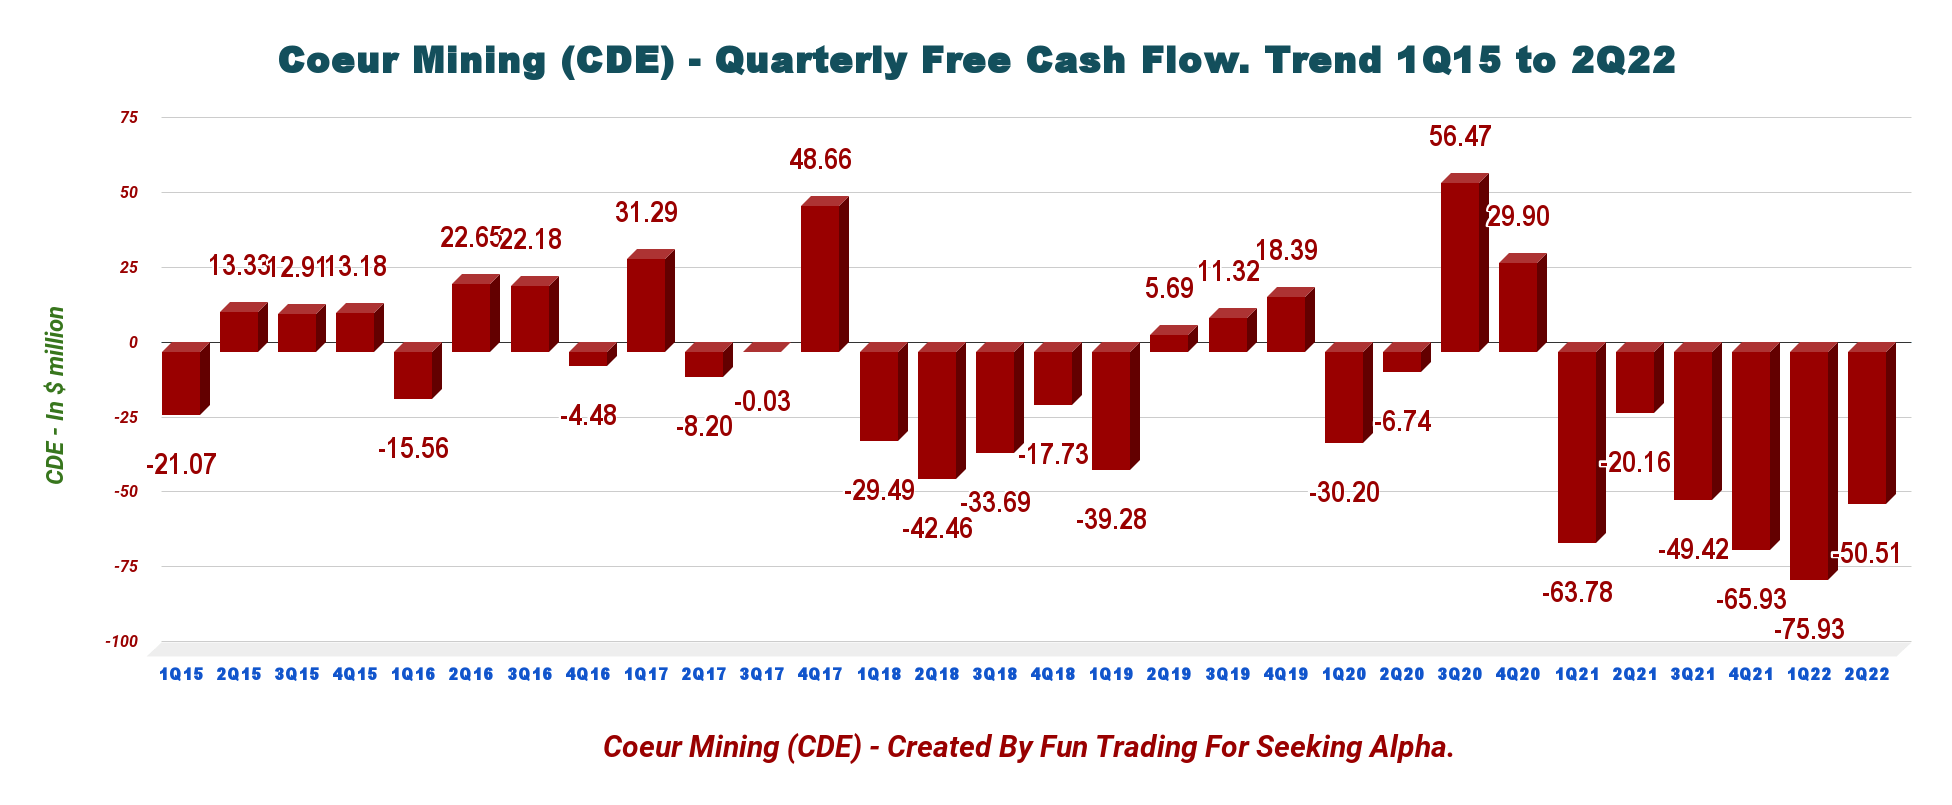
Note: Generic free cash flow is cash from operations minus CapEx
Coeur Mining’s free cash flow for the second quarter of 2022 was a loss of $50.51 million, and the trailing 12-month free cash flow was a loss of $241.79 million.
The company’s CapEx in 2Q22 was $73.16 million.
3 – Available capital, net debt, liquidity, and hedges
CDE quarterly Cash versus Debt history (Fun Trading)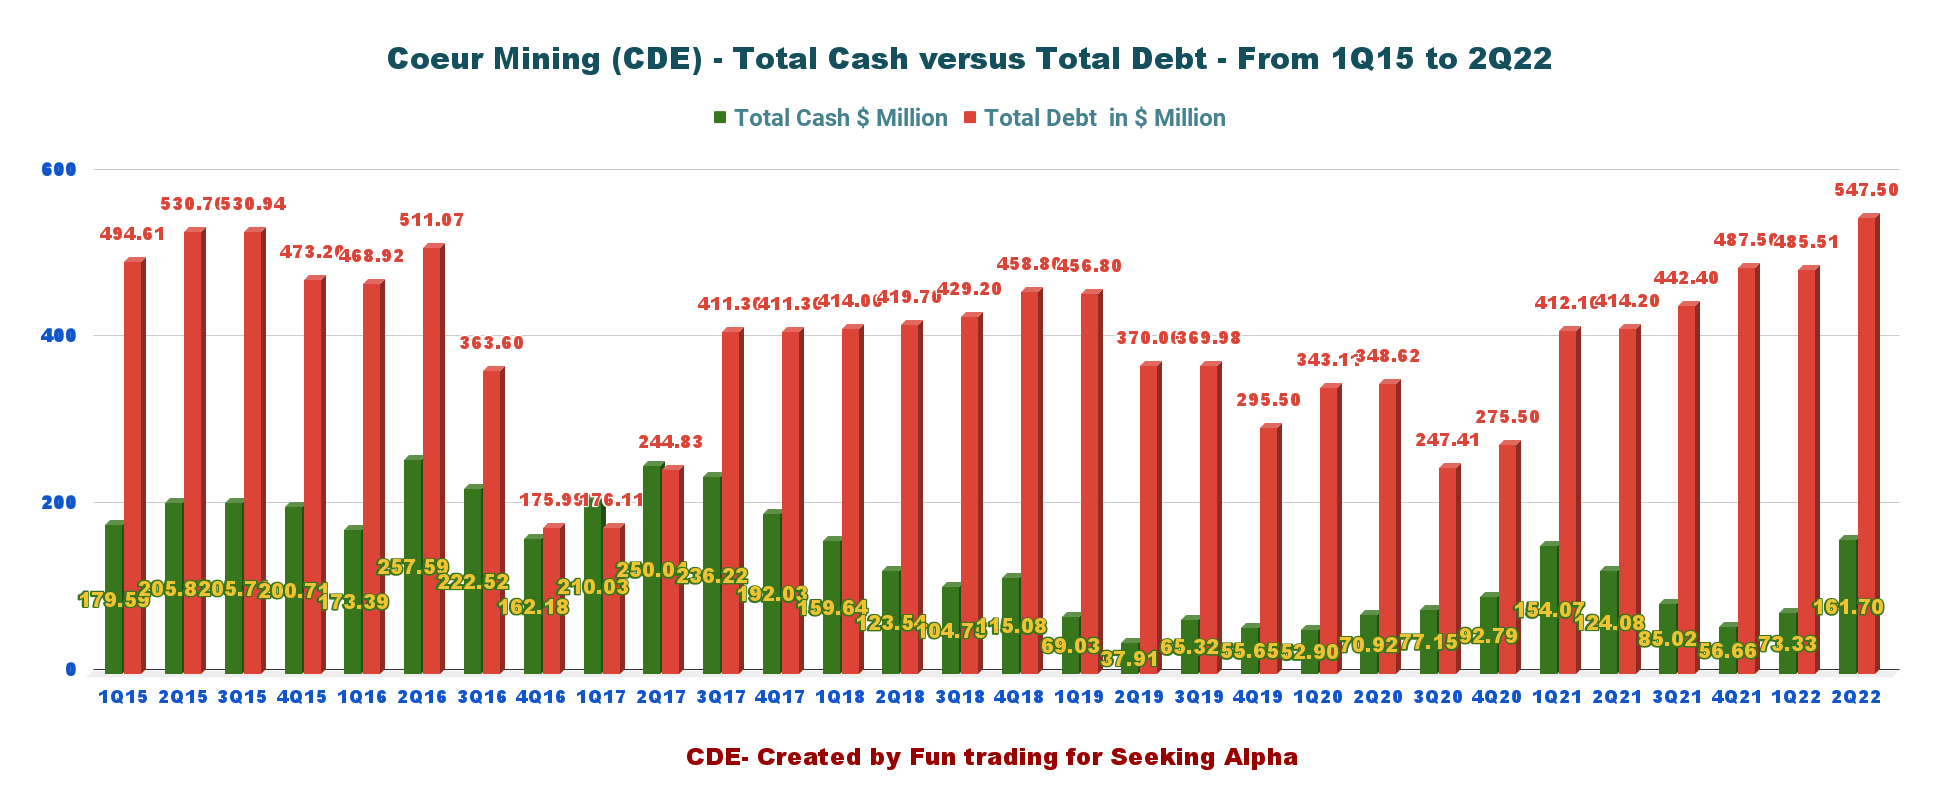
Total debt was $547.5 million, and net debt was $385.8 million. Cash, cash on hand, and marketable securities were $161.70 million.
For financial ratios and Metal sales hedges, please see below:
CDE Balance Sheet presentation (Coeur Mining)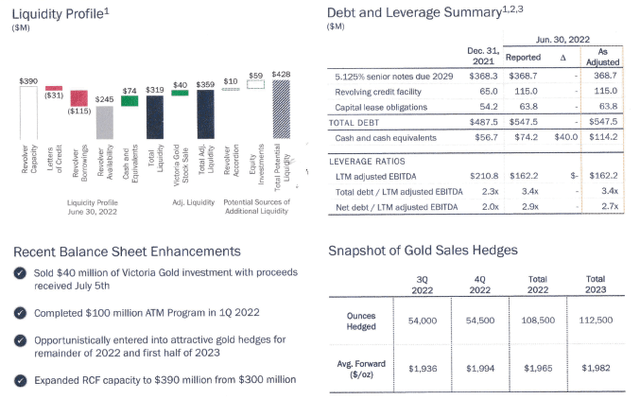
CEO Mitch Krebs said in the conference call:
The balance sheet remains in solid shape, with total adjusted liquidity of nearly $360 million, including the recent Victoria Gold share sale proceeds with an additional $59 million of potential liquidity in the form of marketable securities.
4 – 2022 Outlook updated to reflect inflationary pressure
2022 gold production is expected to be between 315K-353K oz, while silver production is between 9,000 to 11,000 Koz.
CEO Mitch Krebs said in the conference call:
We also modified our full year guidance to reflect our decision to invest an additional $11 million in exploration during the second half to follow-up on recent positive drilling results at Kensington, Palmarejo and the Silvertip project,
CDE Guidance (Coeur Mining)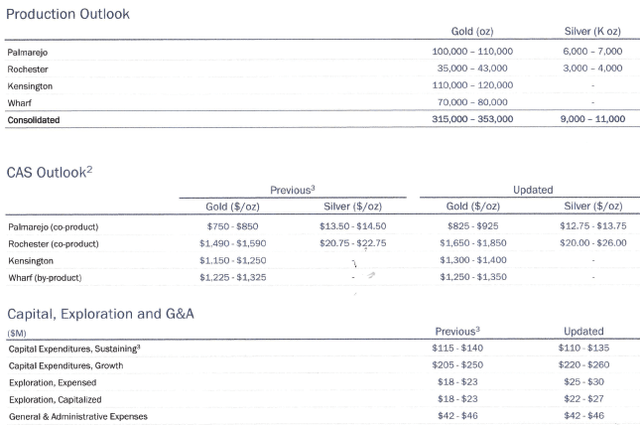
Technical Analysis And Commentary
CDE TA Chart short-term (Fun Trading)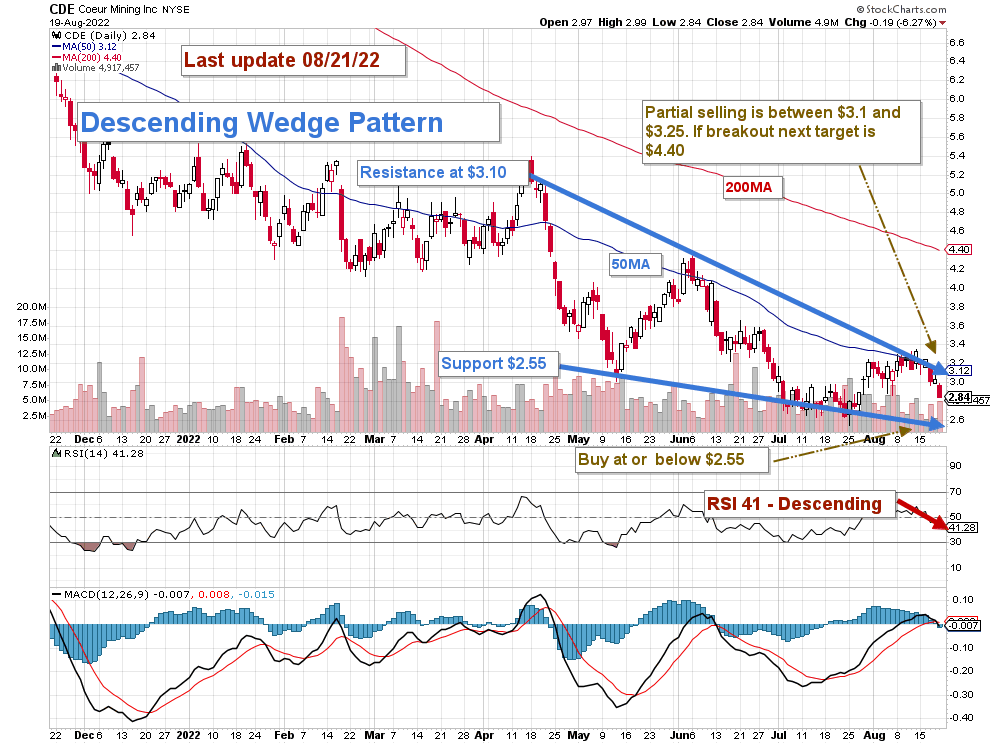
CDE forms a descending wedge pattern with resistance at $3.10 and support at $2.55. The trading strategy is to sell about 40%-50% of your position LIFO and keep a core long-term position for a higher target back, around $5 to $6.
I suggest taking profits (about 40%-50%) between $3.1 and $3.25 and waiting patiently for a retracement below $2.55 to accumulate again.
CDE is highly correlated to the gold and silver prices which are weakening due to the FED’s action against rampant inflation.
The market expects the FED to hike interest by 50-point or 75-point this month after hiking already two times 75-point. Gold miners will likely suffer if the FED decides to hike by 75-point, and CDE could drop to $2. Conversely, if the FED decides on a 50-point hike, CDE could reach the next resistance at $4.40.
Be cautious and watch the gold and silver prices like a hawk.
Note: The LIFO method is prohibited under International Financial Reporting Standards (IFRS), though it is permitted in the United States by Generally Accepted Accounting Principles (GAAP). Therefore, only US traders can apply this method. Those who cannot trade LIFO can use an alternative by setting two different accounts for the same stock, one for the long term and one for short-term trading.
Warning: The TA chart must be updated frequently to be relevant. It is what I am doing in my stock tracker. The chart above has a possible validity of about a week. Remember, the TA chart is a tool only to help you adopt the right strategy. It is not a way to foresee the future. No one and nothing can.
Author’s note: If you find value in this article and would like to encourage such continued efforts, please click the “Like” button below to vote for support. Thanks.
Be the first to comment