

Torsten Asmus/iStock via Getty Images
Energy stocks have gotten clobbered this month. The Energy Select Sector SPDR ETF (XLE) is down a whopping 18% in June. To put that in perspective, the group of oil and gas stocks was up nearly 70% for 2022 at its peak just a few weeks ago – it’s now higher by under 30% YTD.
XLE Is Now Up ‘Just’ 30% This Year
Stockcharts.com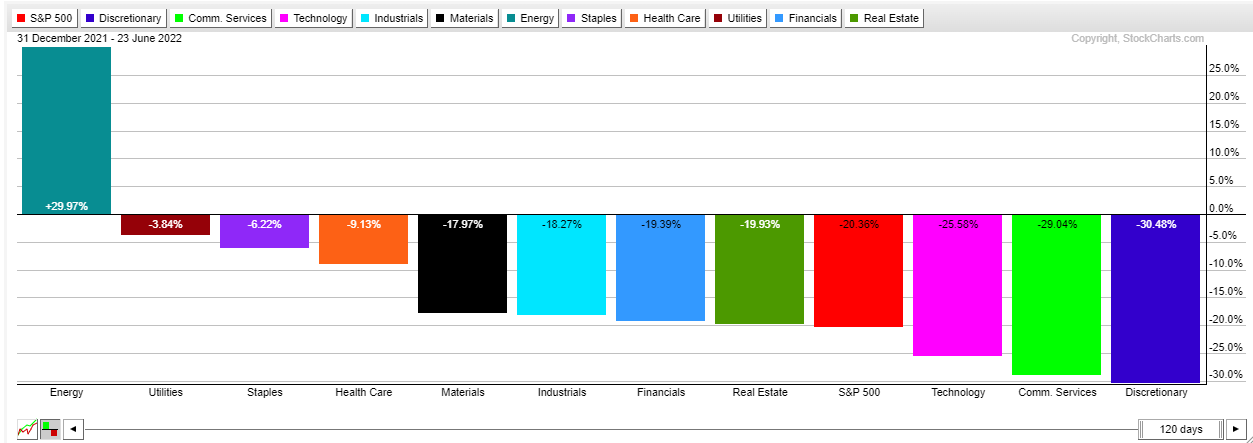
Moreover, XLE plunged 23% just in the last 10 trading days. That’s the worst such drop in the last 20 years, outside of October 2008 and March 2020.
Oil’s Drubbing: Worst 10-Day Stretch On XLE Since COVID
Stockcharts.com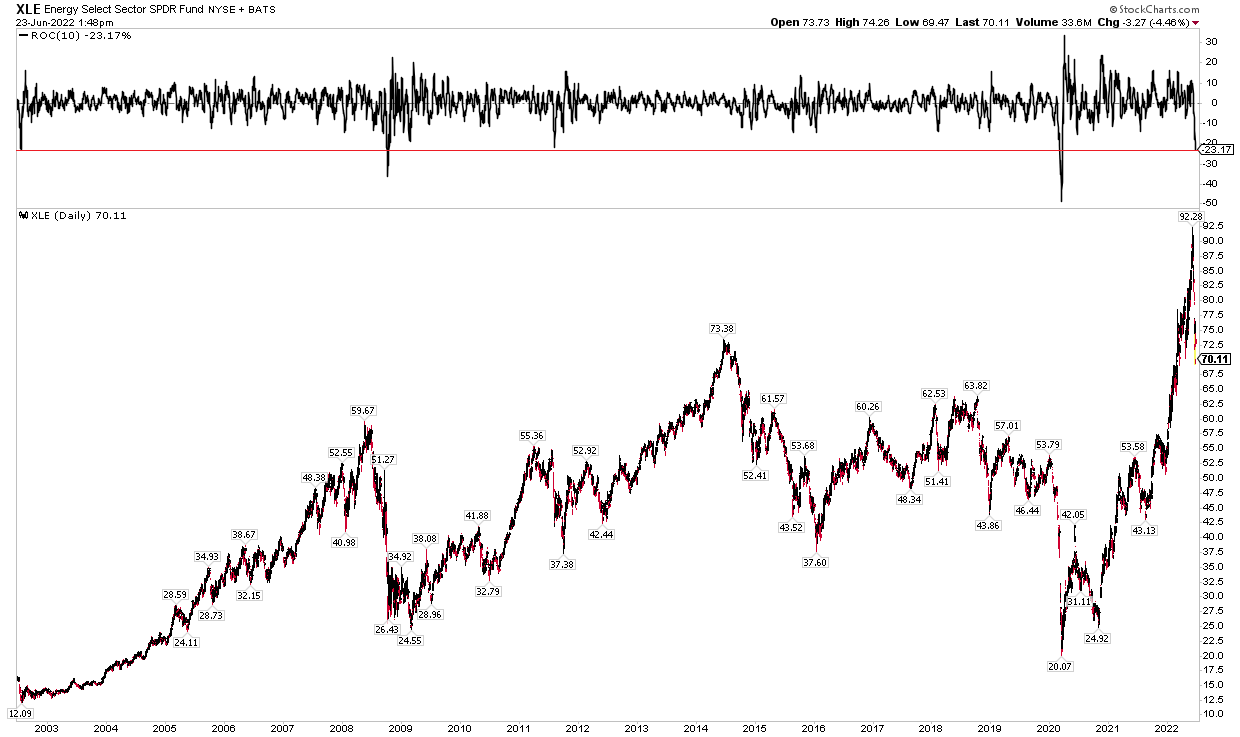
Many factors are at play for the sector. Perhaps the biggest driver is the narrative shift from inflation fears to a global growth scare. Just this week, Bank of America Global Research, using EPFR fund flow data, found that investors pulled money out of resource-based stocks at the biggest clip ever.
Biggest Resource Outflow Ever
BofA Global Research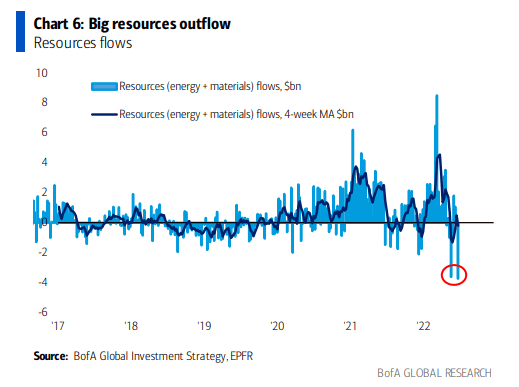
Lower oil prices are a primary culprit. So too is a massive decline in the prompt-month price of natural gas futures. CNX Resources Corporation (NYSE:CNX), an independent natural gas and midstream company, “acquires, explores for, develops, and produces natural gas properties in the Appalachian Basin”, according to Fidelity Investments.
CNX has been taken to the woodshed in this brutal 10-day stretch for the Energy sector – the stock is off more than 30% after more than doubling from last summer. The $3 billion small-cap firm does not pay a dividend but share buybacks could provide support. The company produced $234 million of free cash flow in Q1 and bought back 9.2 million shares (5% of the float).
Looking ahead, its management team expects to earn $700 million of free cash flow this year. Based on the current market cap, that is a FCF yield near 22%. On valuation, the firm trades under 5x forward FCF.
1Q Conference Call Presentation: Management Optimistic About FCF Growth And Share Buybacks
CNX Resources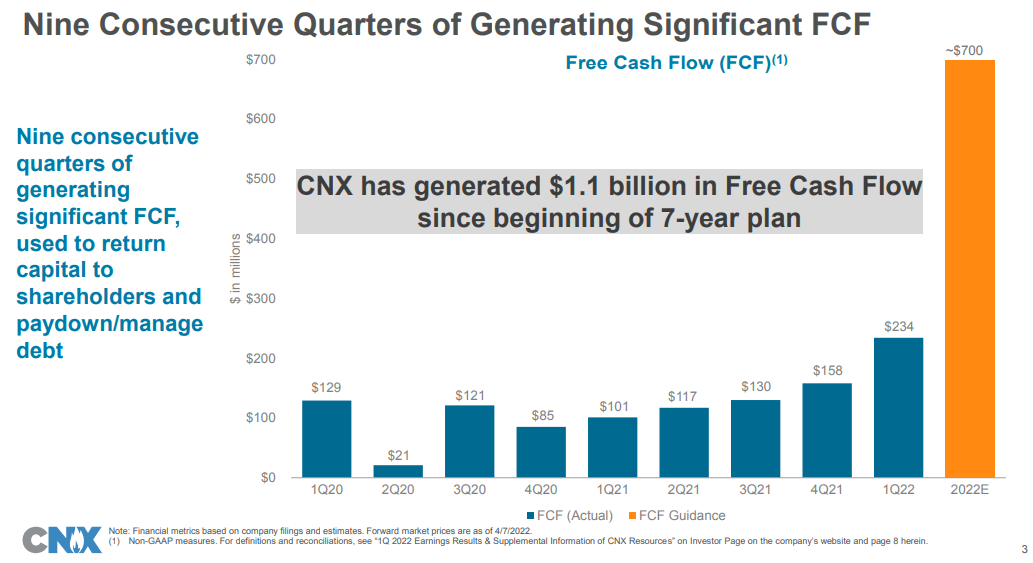
The next earnings date is July 28 BMO (unconfirmed), according to Wall Street Horizon.
Corporate Event Calendar
Wall Street Horizon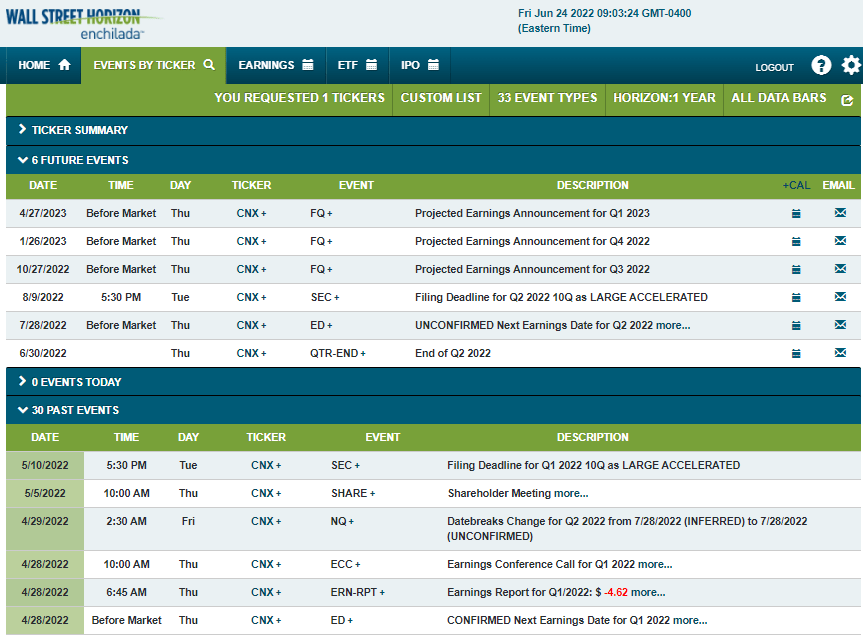
The Technical Take
Turning to the charts, there’s long-term resistance at $24. Notice how it was support back from 2012 through early 2015. The stock then approached this key spot earlier in the month. Long-term bulls want to see a breakout above $24 for a continuation of the uptrend of its March 2020 nadir.
CNX Long-Term Chart: $24 Resistance, $16 Support
Stockcharts.com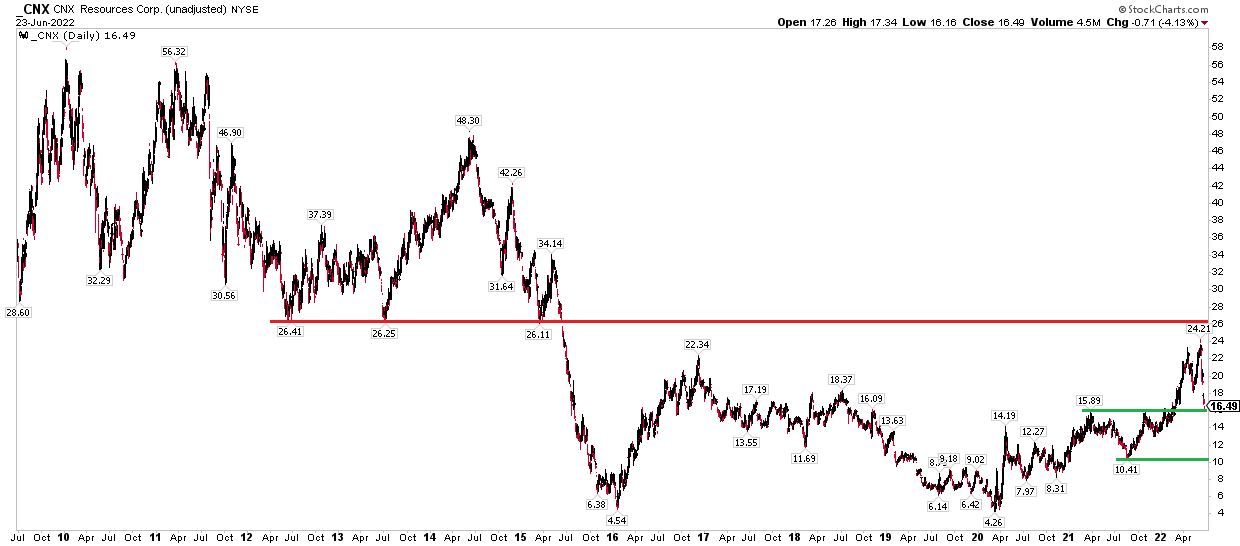
Near-term, CNX shares have dropped back to support near $16. This could be a good risk/reward setup. Traders could consider going long here with a stop under the 2021 to early 2022 highs. The next support point is just above $10, but that’s a long way down. Your stop should not be that low.
Additionally, the 200-day simple moving average (daily) is also in-play here. I am worried about a breach of an uptrend support line from the early 2020 low, however.
CNX Near-Term Chart: $16 Support Confluence, But Shares Are Under The Uptrend Line
Stockcharts.com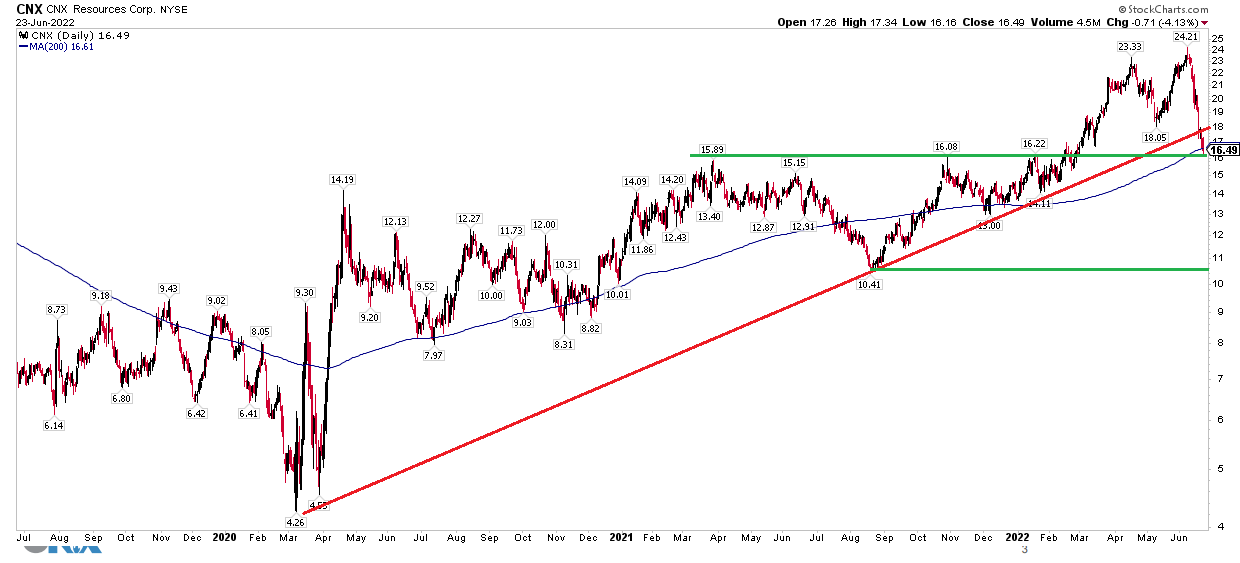
The Bottom Line
CNX shares have plunged 30% in a matter of days. I believe there’s value here, though. A strong free cash flow yield and its FCF valuation multiple look good from a fundamental perspective. The technicals are mixed but the stock is back to $16 support. Short-term traders could go long here with a stop cushioned under $16. Long-term investors should consider owning the stock for its compelling cash generation and buyback potential.
Be the first to comment