

Scott Olson/Getty Images News
I’m a long-term CME Group Inc. (NASDAQ:CME) bull. My most recent article was written on June 23, 2021. CME Group is one of the three companies in the stock exchange industry that I monitor. The other two are Nasdaq, Inc. (NDAQ) and CBOE Global Markets (CBOE). I bought Nasdaq, Inc. because I did not have a lot of tech exposure as I only owned Apple Inc. (AAPL). More importantly, I bought it after it came close to dropping 20% from its all-time high as I love buying things well below their all-time highs. That said, it’s the reason I’m covering the CME Group again. It was on my radar when it dropped to the low $190s last year and I did not pull the trigger. I regret it tremendously, and in this article, I will tell you why. The company is a high-yield stock flying under the radar, its business quality is phenomenal, and it currently benefits from a number of tailwinds. It’s a stock that deserves to be on people’s radars as I’m not going to miss another opportunity to buy CME in the future.
Here’s why:
CME Is Actually A High-Yield Stock
In this busy month, I’ve discussed a lot of high-yield and low-yield stocks with more growth potential. Especially in this environment where the S&P 500 is yielding less than 1.4%, I feel that there’s a desire to buy a high yield. The problem is, high yield often comes with higher risks, which is why a lot of investors are buying stocks they would not have bought under normal circumstances, so to say.
That’s where CME comes in.
But wait? CME recently announced a $1.00 quarterly dividend? That’s $4.00 annualized and it translates to a 1.60% yield? That’s not a high yield.
The beauty of CME is that it pays almost all of its free cash flow as dividends. That’s base dividends (currently $4.00 per year) and special dividends (variable).
What makes CME special is its dominant position in financial markets. Using its most recent 4Q21 numbers, the company made most of its money in interest rates (32% of total revenue). This includes interest rate hedging, clearing services, and related. Equity index sales include trading fees from the famous E-mini S&P 500 future and options. The company also has significant exposure in agriculture and energy where it owns various top-tier futures like CBOT corn, wheat, and soybean future.
CME Group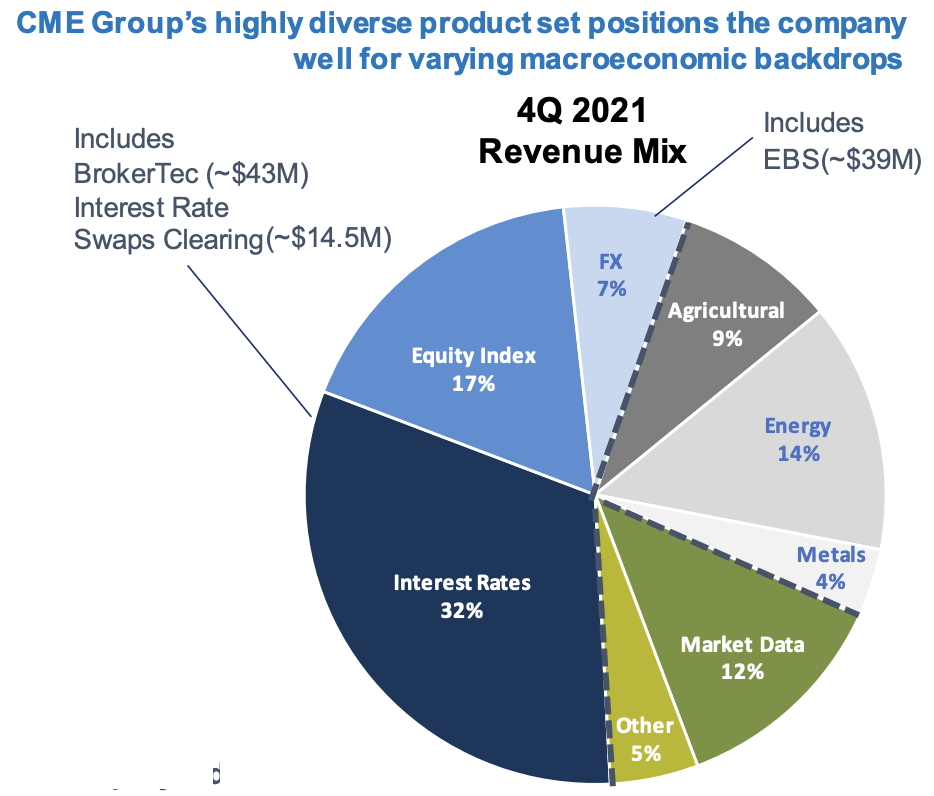
What this means is that recessions do not necessarily mean lower revenues. The contrary is often true as recessions often come with higher volatility (more trading) and the need to hedge certain events – I will get into that in this article.
As a result, the company has grown EBITDA and free cash flow very consistently. In 2012, the company did close to $1.9 billion in EBITDA and $1.1 billion in free cash flow. Note that normalized net income was $1.0 billion in 2012. The company’s free cash flow exceeds net income almost every single year, which indicates what I like to call “quality earnings”, or the ability to generate cash, which is extremely important for dividend (growth) investors and value investors in general.
In this case, however, there’s not only value but growth as well. EBITDA has grown from $1.9 billion in 2012 to $3.2 billion in 2020 when the world was confronted with a load of uncertainty related to the pandemic. Trading volumes accelerated, resulting in steady EBITDA and higher free cash flow. 2012 was slightly down due to a strong 2020 performance – there was no way lower volatility could keep up with 2020. However, by 2024, EBITDA is expected to make it above $4.2 billion with free cash flow coming in close to $1.6 billion. This implies the following 2012-2024E compounded annual growth rates:
- EBITDA: 6.1%
- Free cash flow: 9.5%
TIKR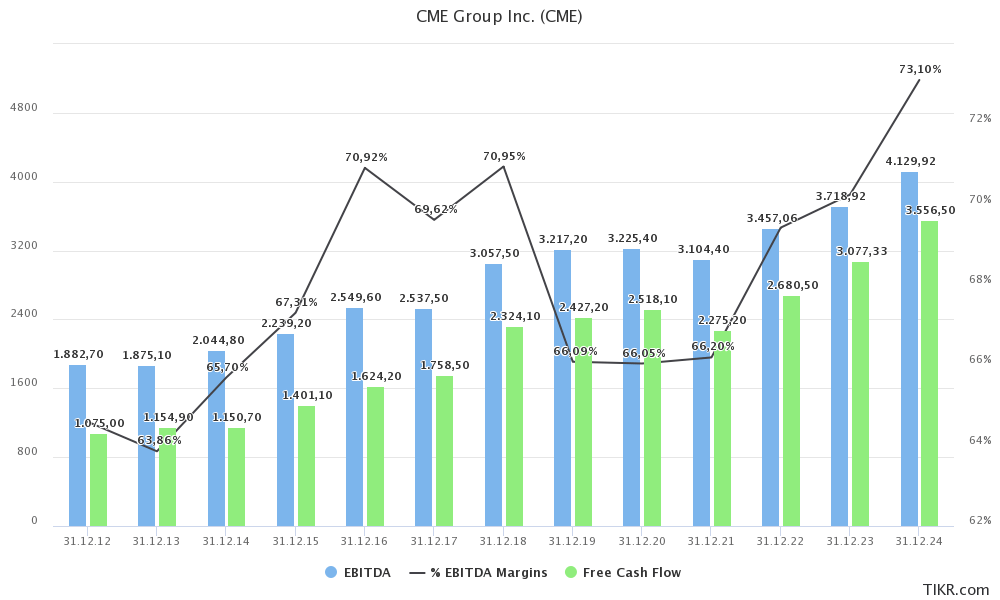
These numbers are absolutely fantastic for a company that can be considered very “mature”. However, there’s more to it. If we use next year’s free cash flow estimate of $3.1 billion, we’re dealing with a free cash flow yield of 3.5% using the $89 billion market cap. That’s not extremely high, but that’s OK because the company doesn’t really need that much cash. Also, free cash flow already excludes capital expenditures.
That’s where the high yield comes in. The company’s current dividend yield is 1.60% based on a $4.00 annual dividend. The company announced an 11.1% hike on February 3, 2022. Last year, the company’s dividend was roughly $0.90 per quarter with an additional special dividend of $3.25 per share announced on December 9. This pushed the total payout to 3.3%.
In 2020 and 2019, the special dividend was $2.50. In 2019, it was $1.75.
The graph below shows the total common dividends paid per year (regular + special). When comparing it with the graph above, we quickly see that all of the company’s free cash flow ends up in shareholders’ pockets. The company does not engage in net buybacks, meaning all distributions are (direct) dividends.
TIKR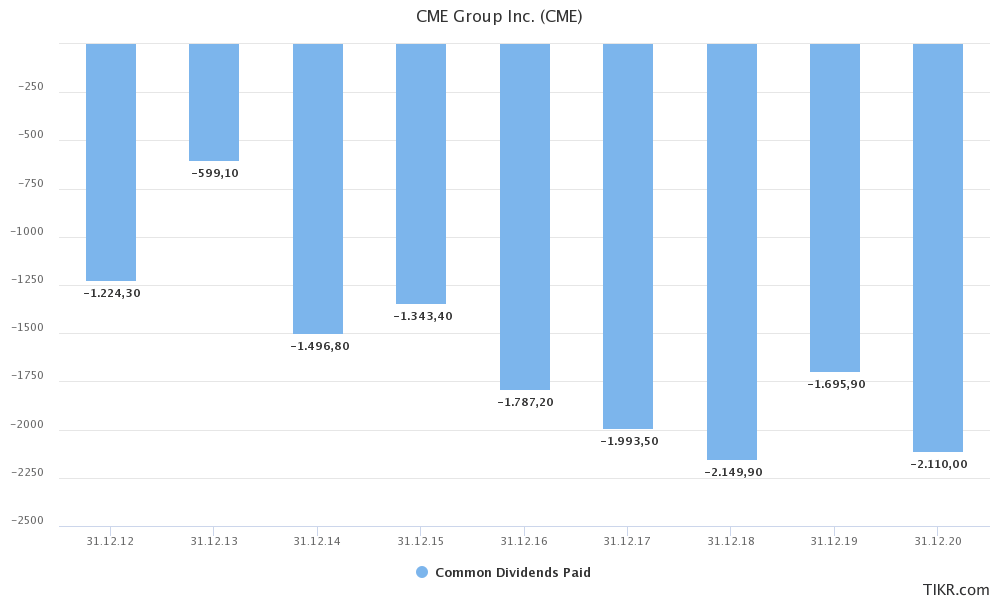
In this case, the emphasis is shifting a bit from dividend growth to free cash flow growth as special dividends have a bigger impact on the total payout than regular dividends. This means free cash flow growth is basically equal to total dividend growth. I’m painting with a broad brush here, but you get the idea.
Excluding special dividends, the regular dividend has grown by 11.2% compounded over the past 10 years. Over the past 5 years, this number has dropped to 8.5%, which is still satisfying. This is according to Seeking Alpha data.
Please bear in mind that free cash flow is expected to grow by 9.5% in the 2012-2024E period as I calculated in this article, which is in line with regular dividend growth rates.
With that being said, none of this would be responsible without a healthy balance sheet. Every investor prioritizes balance sheet health over payout as the payout is not sustainable if it results in a long-term uptrend in debt.
The company had an increase in net debt in 2018 due to the acquisition of London-based NEX Group for $5.5 billion. While it looks like a big move in the graph below, net debt still did not make it above 1.0x EBITDA that year. Since then, net debt has declined to a mere $610 million, or less than 0.2x EBITDA.
TIKR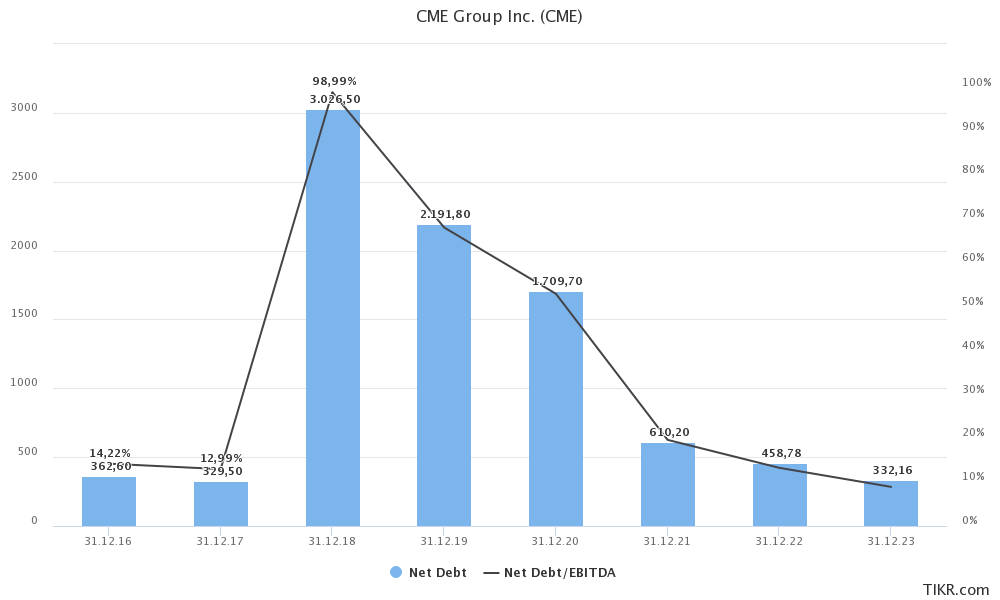
Now, let’s discuss the valuation.
CME Group – Recent Events & Valuation
CME Group’s stock price has done very well. This year, it has advanced 8.4%. The S&P 500 is down 4.7% during this period.
FINVIZ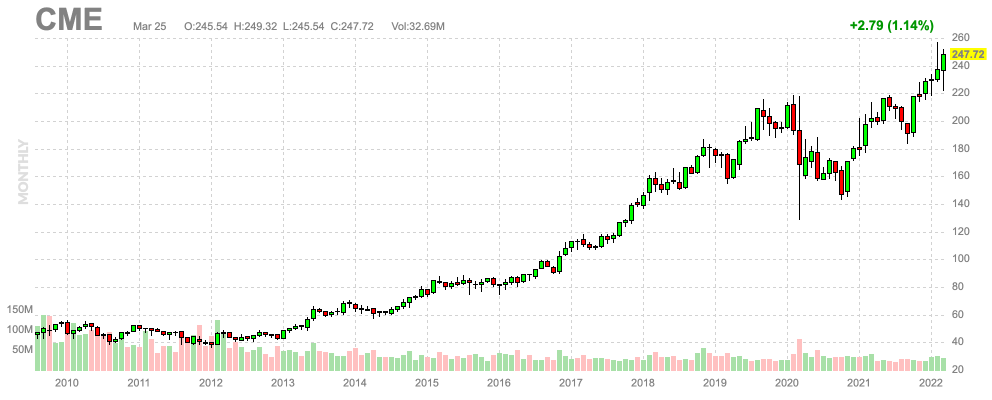
CME benefits from a number of things. For example:
- Above-average stock market volatility
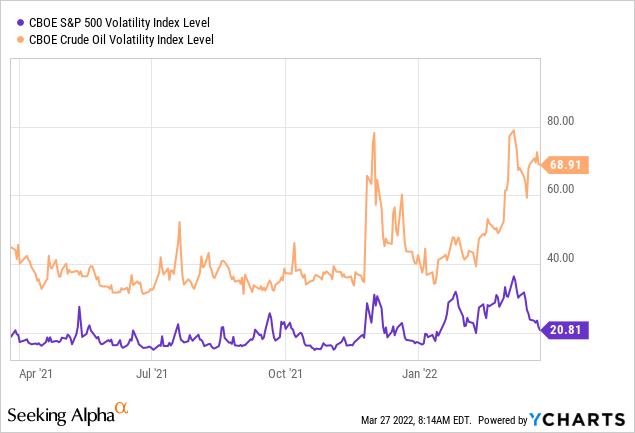
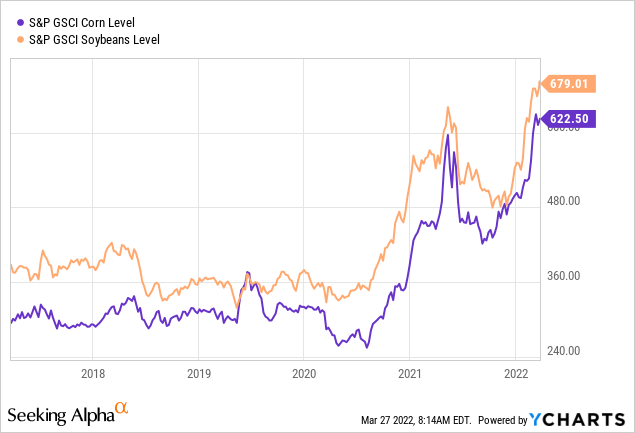
- Accelerating agriculture prices related to the war in Ukraine.
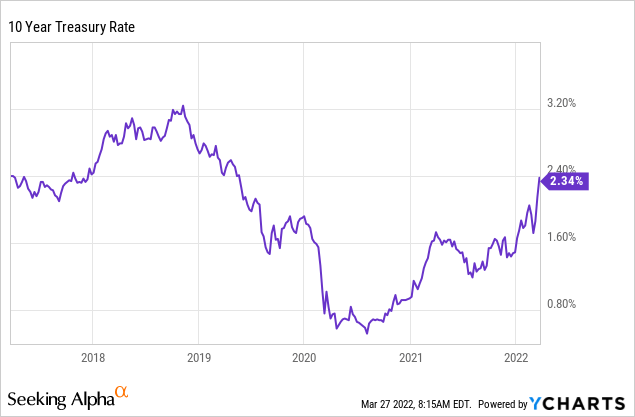
- Rising interest rates and related uncertainty.
As a result, the most recent data (as of February 2022) shows that the company is indeed seeing high growth in ADV (average daily volume). Total ADV year-to-date is up 23% with strong growth in interest rates (the need to hedge), equities (higher volatility), and energy + forex. Agriculture was somewhat flat with a decline of 21% in the company’s smallest segment, metals.
Author (CME Group data)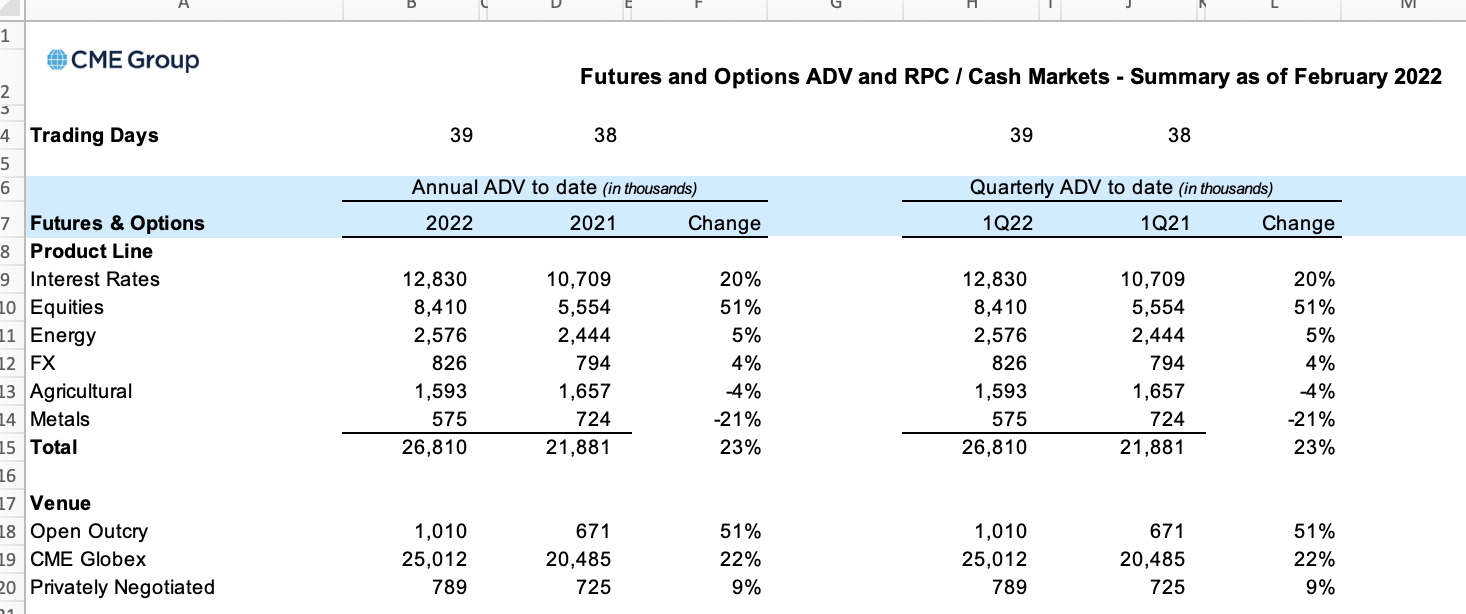
Hence, the company is outperforming the market. Related to that, on March 10, Bank of America raised its CME outlook:
Bank of America analyst Craig Siegenthaler on Wednesday raised first-quarter earnings per share estimates for U.S. exchanges CME (NASDAQ:CME), Intercontinental Exchange (NYSE:ICE), Tradeweb Markets (NASDAQ:TW) and Nasdaq (NASDAQ:NDAQ) on the basis of robust trading volumes amid Russia’s invasion of Ukraine.
“The invasion has disrupted global commodity markets, which has contributed to volatility and rising volumes across most asset classes,” Siegenthaler wrote in a note to clients. “Given the long-term impact of sanctions as well as the newfound interest in reducing Western dependence on Russian energy, we anticipate higher energy prices and contract volumes on an ongoing basis.”
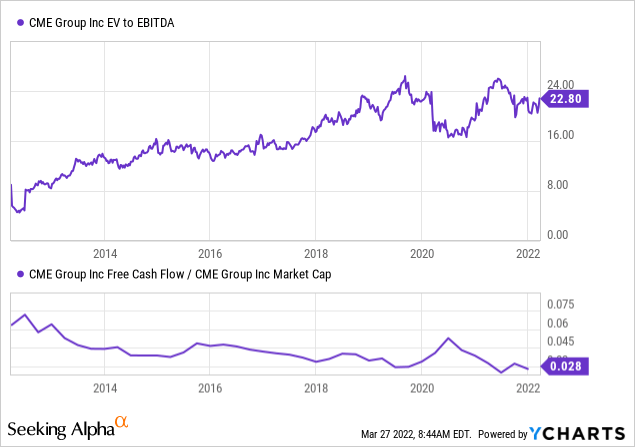
With that said, using the company’s $89 billion market cap and roughly $500 million in net debt, we get an enterprise value of $89.5 billion. That’s 24.2x next year’s expected EBITDA.
This valuation is not cheap. It’s one of the highest in recent history. While it does make sense that the EV/EBITDA multiple is elevated given high free cash flow generation, it’s not a price I’m comfortable paying. The same goes for the implied free cash flow yield of 3.5%. It’s close to the average of the past 4 years. It’s better than the EV/EBITDA valuation, but not something I’m comfortable with.
Takeaway
I’m a huge fan of CME. The company has an excellent business model, which allows it to steadily grow its revenue, EBITDA, and free cash flow. Net debt is close to 0.2x EBITDA, which means almost every penny in free cash flow is being distributed to shareholders. Dividend growth is decent, and even free cash flow is rising at a rapid rate.
The implied dividend yield of >3.3% makes it a high yield stock in the current environment. Moreover, investors are not giving up on growth, which is often the case when buying a high yield.
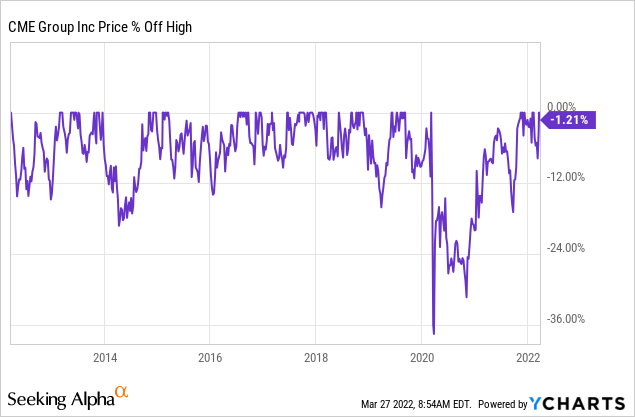
Right now, however, the only problem is that the valuation isn’t that attractive. The stock is up more than 8% this year as it benefits from volatile and rising agriculture, bond, and energy prices as well as a volatile stock market.
I recommend investors who are not long yet to wait for weakness. It could mean we miss more upside, but I prefer that over chasing a stock price that has done rather well.
I’m looking for an 8-10% dip, which happens on a regular basis.
People who are already long should do nothing except for enjoying their investment and use stock price weakness to add to their existing position.
(Dis)agree? Let me know in the comments!
Be the first to comment