

damircudic
It was another good week for the entire list of Volume Breakout Report stocks picked since late June, although top gains were reached before Friday’s big market selloff. On an equally-weighted basis (excluding dividends and trading costs), the 38 VBR equities fell a mean average of -1.37% vs. a Russell 2000 small-cap index decline of -2.97% and S&P 500 large-cap drop of -3.98% over the last five trading days (August 19th close to August 26th close). I would categorize this past week’s relative outperformance as some of the best results since starting the momentum buy list months ago.
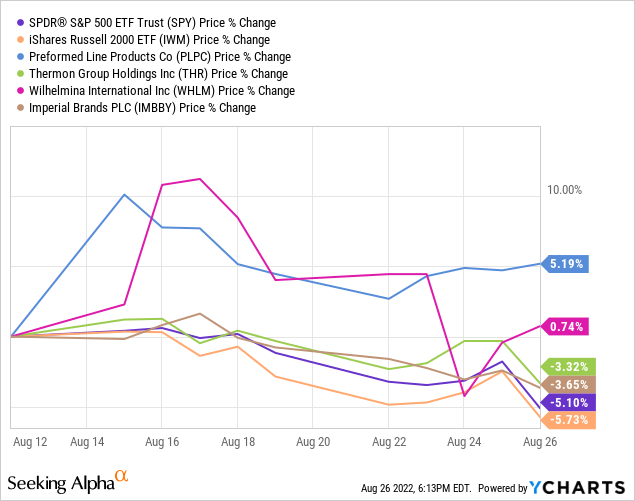
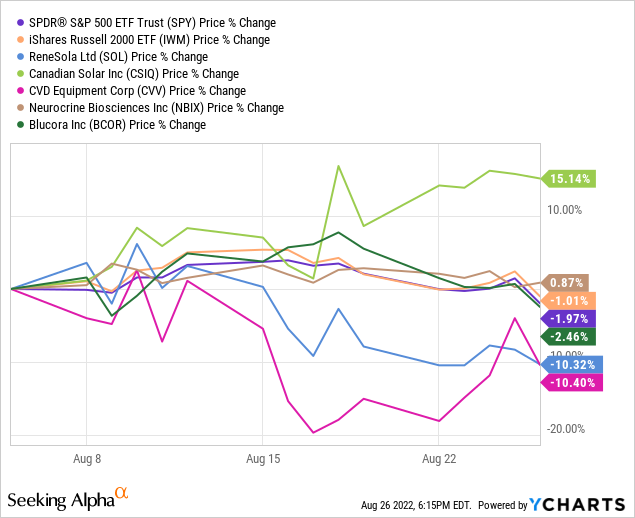
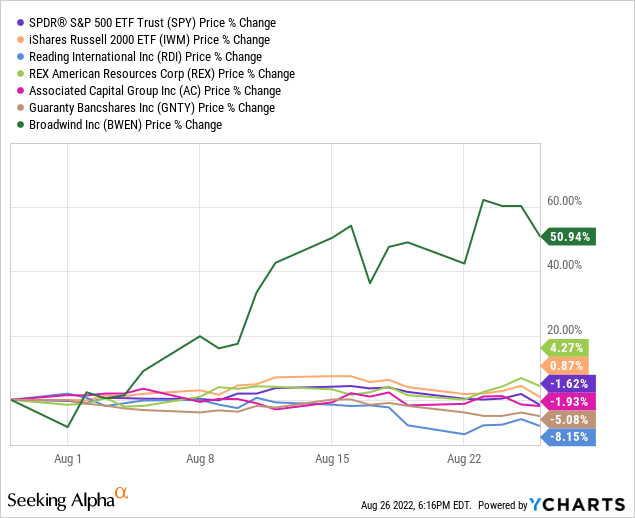
I am happy to relay that all 38 stocks (39 picks with LGL picked twice) are now outperforming both sectors of the U.S. stock market (small and large companies), with a slight outperformance number of +0.51% (mean average) vs. the Russell 2000 and extra +2.11% (mean average) return vs. the S&P 500.
Even better news is the last 5 weeks of selections have performed +6.49% better (mean average) than the Russell 2000 index equivalent time-period changes (low single-digit advances or declines for iShares IWM). And, a price gain +7.78% stronger (mean average) than the S&P 500 (SPDR ETF – SPY) was achieved. This idea is pictured below, with a price performance summary of 23 VBR stocks measured against both indexes. Again, these calculations have taken place over a very short span of 5 weeks or less.
VBR Picks from August 19th Closing Price VBR Picks from August 12th Closing Price VBR Picks from August 5th Closing Price VBR Picks from July 29th Closing Price VBR Picks from July 22nd Closing Price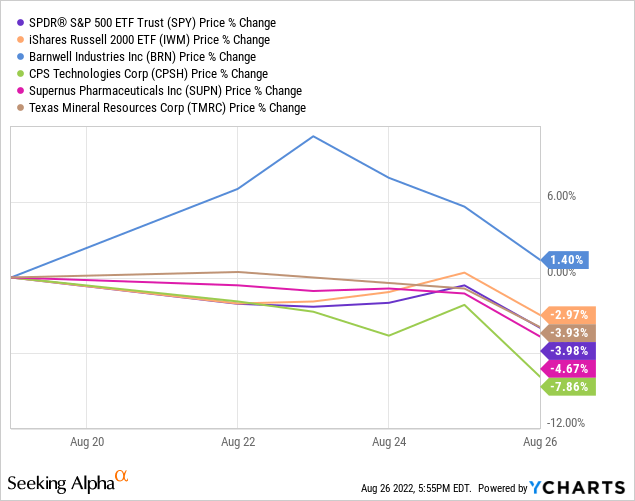
New VBR Buy Signals
LSI Industries
Specialty lighting solutions and fixtures, with integrated design and installation is the main focus of LSI Industries (NASDAQ:LYTS), serving retailers and business clients across North America. One potential catalyst for stock gains since late July came with the signing of the Inflation Reduction Act in Washington. LSI offers a solar panel installation option that now has the potential for really strong growth starting next year, on the government tax breaks adopted for green energy buildout.
LSI Industries – Q4 2022, Investor Presentation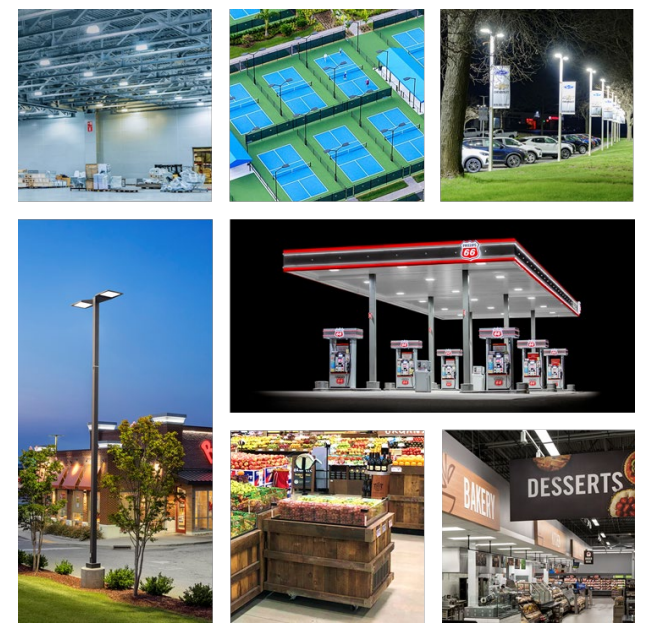
Some financial highlights include a 2.4% dividend, and a P/E of 14x for investors. Q4 ending in June saw +31% sales growth YoY (from its 2021 purchase of JSI Store Fixtures), and non-GAAP EPS of $0.21 beating analyst forecasts by almost 40%. The good news is profitability is projected by Wall Street analysts to reach new records into 2023, with a forward P/Ex of 12x.
Seeking Alpha, LSI Industries, Analyst Estimates – August 26th, 2022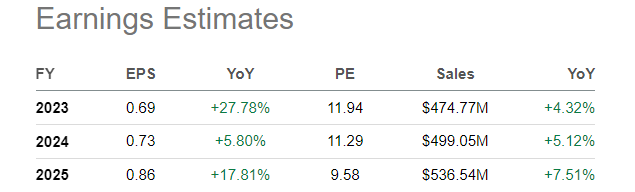
Against a $220 million stock market cap, LSI owns $158 million in current assets vs. $80 million in debt and $163 million in total liabilities. I rate the balance sheet as much stronger than the average small cap I review. Outside of the accounting effects of a large cash acquisition, the company delivered around $24 million in free cash flow, about $0.90 per share. For a steady growth name, today’s adjusted free cash flow yield of 10%+ is quite intriguing.
When you get down to the bare bones, forward enterprise value (equity + debt – cash) to EBITDA (earnings before interest, taxes, depreciation and amortization) of 7.4x is projected to be near a decade low reading next year. And, forward EV to Revenues of 0.63x is estimated at a below normal setting vs. 10 years of data. If LSI Industries can figure out a way to grow faster than anticipated (perhaps by expanding its solar panel installation business), a fair value target of $12 or higher is within reach in 2023.
YCharts, LSI Industries – 10 Years, Trailing and Forward EV Ratios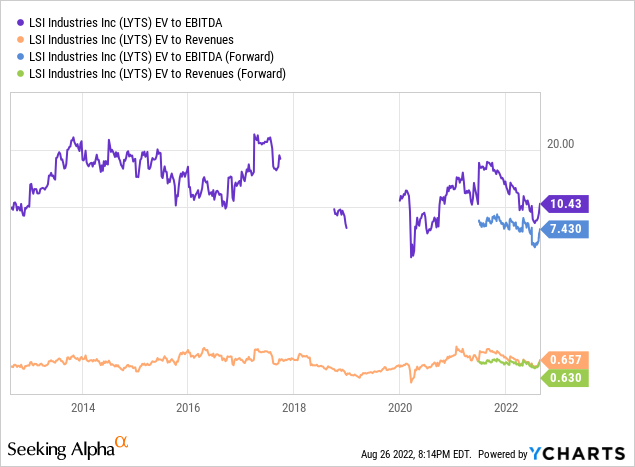
Insiders have been buyers, mostly through stock-based compensation, with no sellers over the past 12 months.
Nasdaq Website, LYTS Insider Trading – August 26th, 2022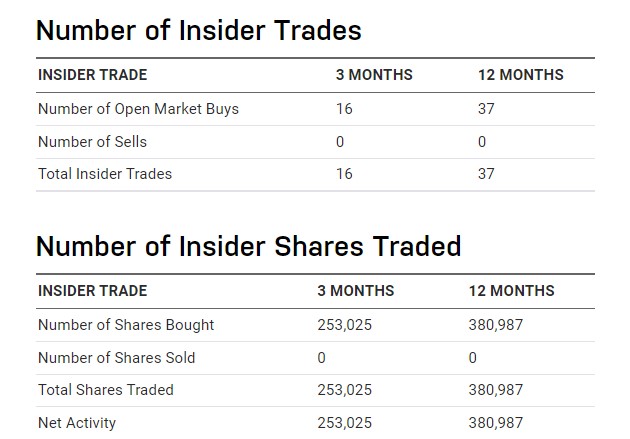
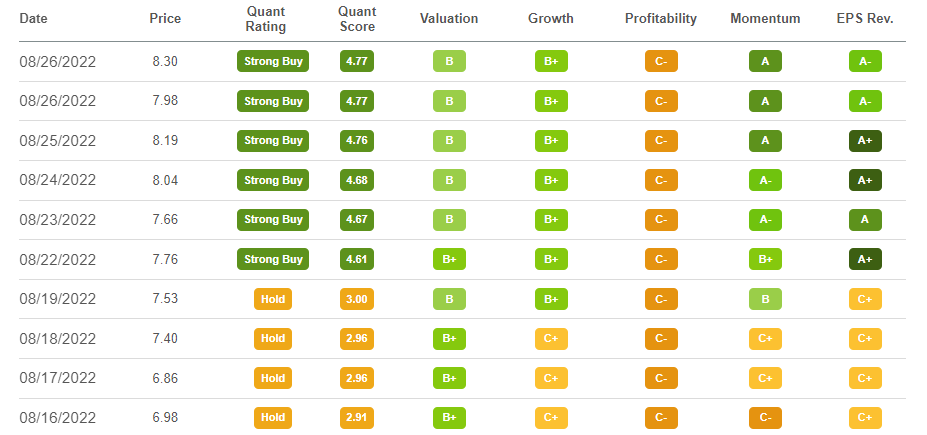
Seeking Alpha’s computer rankings of LSI have undergone a major turn higher in the last couple of weeks with better-than-expected quarterly earnings and a strengthening stock price. In fact, the Quant Ranking is now in a top 4% position, out of a universe of 4,667 names.
Seeking Alpha Quant Ranking, LSI Industries – August 26th, 2022 Seeking Alpha Quant Rating, LSI Industries – August 26th, 2022, Previous 10 Days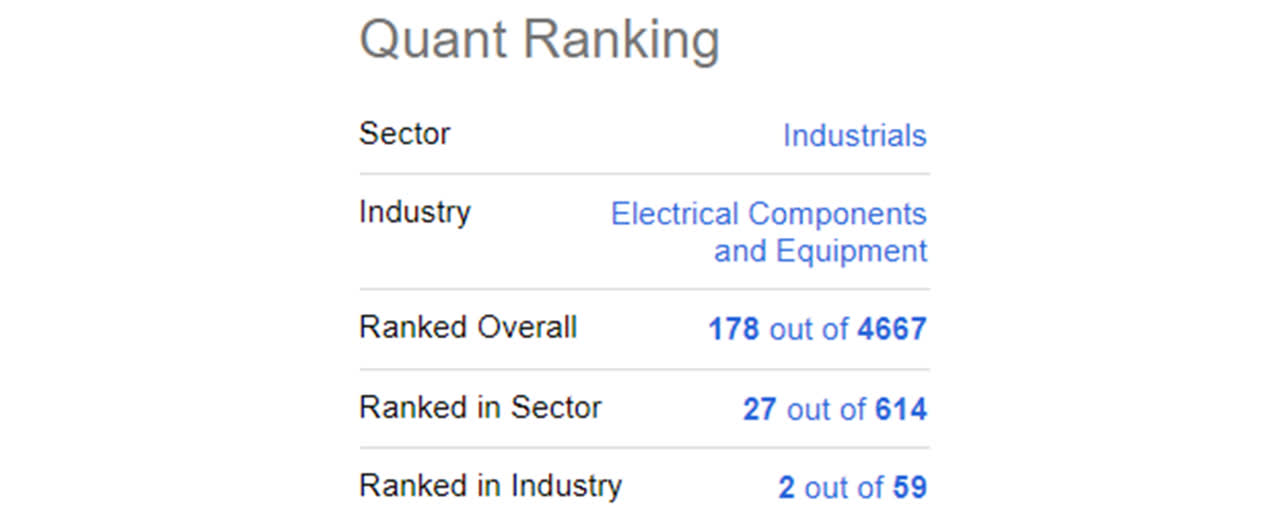
The stock has witnessed a solid 2 weeks of heavy volume buying, with price breaking out to a 52-week high on Thursday. On the chart below, sharply rising relative price strength vs. the S&P 500, alongside much improved Negative Volume Index and On Balance Volume action are the main bullish trading story.
StockCharts, LYTS – 1 Year Graph of Daily Trading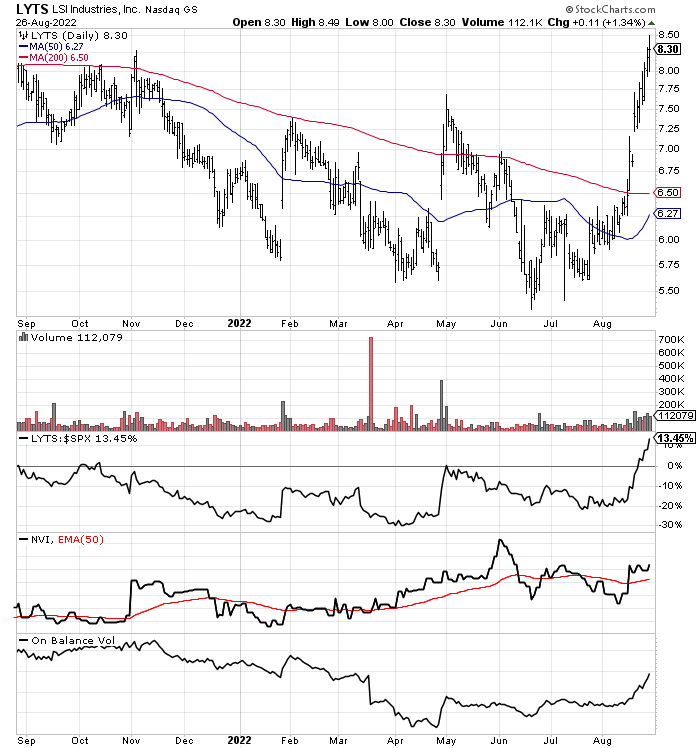
Evolution Petroleum
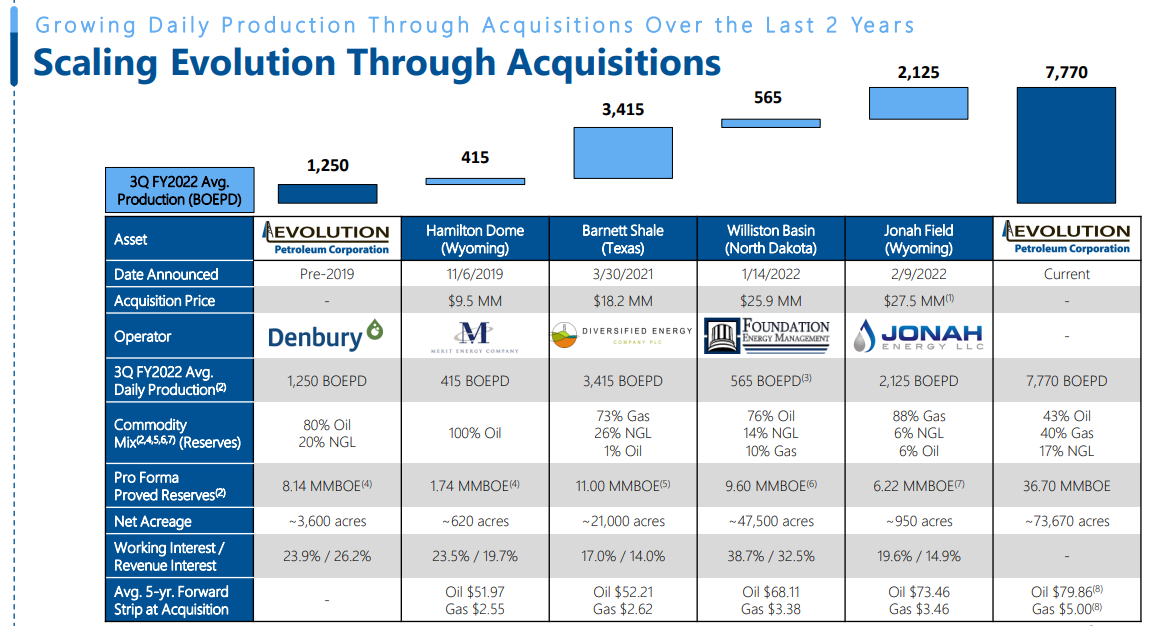
A high-risk, potential big payoff oil play is Evolution Petroleum (EPM). The company acquires older, less productive oil fields across the U.S. from existing operators, and shares in the upside of oil/gas prices over time. It represents something of a “call option” on crude oil prices (and to a lesser degree natural gas). The company has added reserves all over America the past few years, and currently pays a 4.6% annual dividend rate, backed by strong sales and earnings in 2022. A potential catalyst could be Russia cutting off all oil/gas supplies to Europe this winter, making domestic producing assets far more valuable.
EPM – June 2022 Investor Slideshow EPM – June 2022 Investor Slideshow EPM – June 2022 Investor Slideshow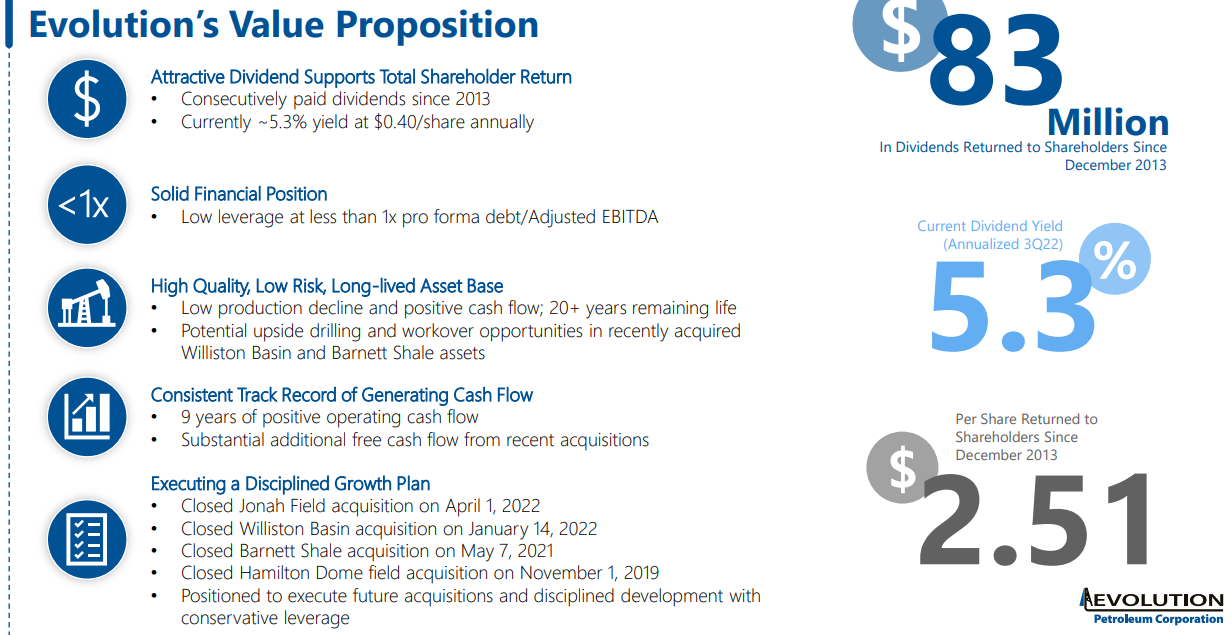
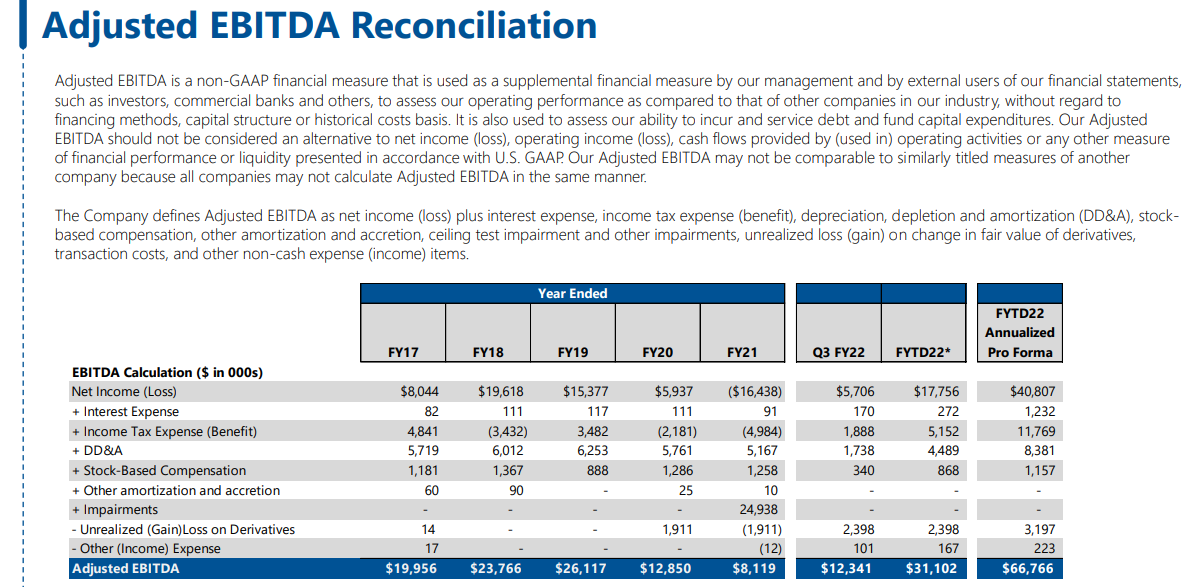
At the end of March, the company held $32 million in cash and current assets vs. $20 million in debt and $51 million in total liabilities. The company is projecting most debt from recent acquisitions will be paid off by the end of calendar 2022, assuming oil/gas prices remain around current levels. After 2022, the continuation of high energy prices will be gravy for EPM shareholders. Potential uses of excess cash flow include a raised dividend, stock buybacks and/or the purchase of new producing properties. Of course, downside for investors will appear if crude oil and natural gas prices fall appreciably. Evolution is basically trading close to its cheapest valuation on trailing results over the past decade, pictured below.
YCharts, Evolution Petroleum, 10 Years – Fundamental Ratios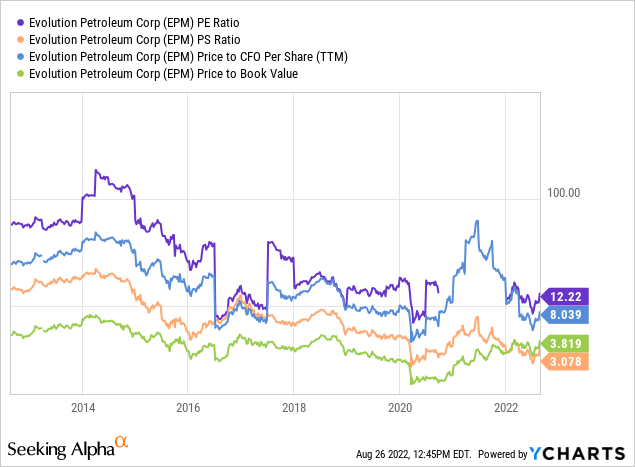
Rising production on top of rapidly rising selling prices is ramping revenues and profits straight up in fiscal 2022, with little if any material drop expected in 2023-24 by Wall Street analysts.
Seeking Alpha, Evolution Petroleum, Analyst Estimates – August 26th, 2022 StockCharts, EPM – 1 Year Graph of Daily Trading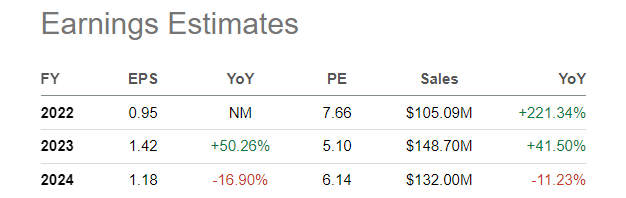
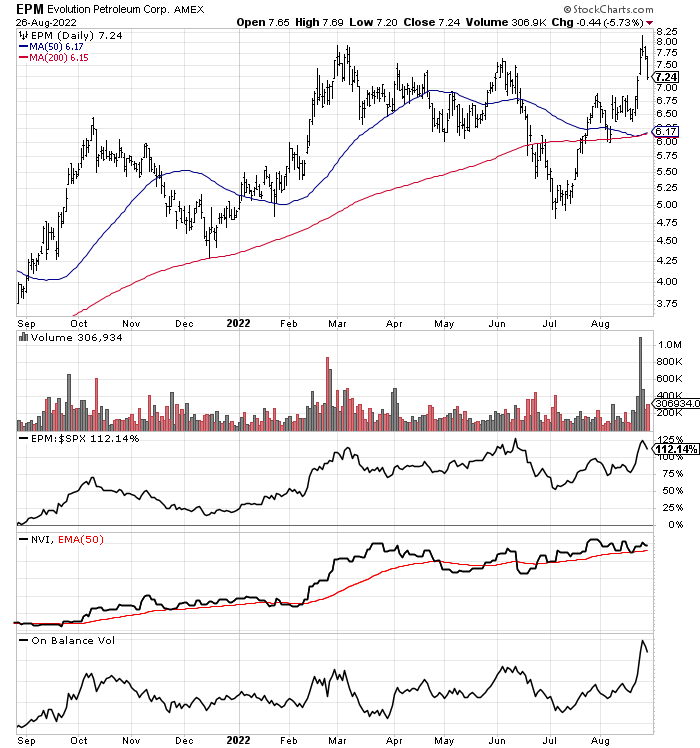
Harbor Diversified
51% owned by a board member, Harbor Diversified (OTCPK:HRBR) is a regional airline ( Air Wisconsin) with 64 smaller jets slowly being phased out by the industry. Its flight services are moving from a feeder line for United Airlines (UAL) to American Airlines (AAL) in 2023, transporting customers to minor airports and destinations in the Midwest. Before the announcement last week of a new partnership with American, investors were worried the company would close shop next year and sell its fleet of depreciated planes. Seeking Alpha contributor Rational Expectations wrote a solid piece several days ago here explaining the underlying net value of HRBR could rise to $5 per share next year on the new deal, based on its sizable and growing cash position (around $212 million expected by next March, with 4 more quarters under the United contract) plus added cash flow from the American deal and an estimate of plane liquidation values, minus total liabilities ($155 million four months ago). Against a trailing book value of $218 million, the current $2.90 stock quote works out to $135 million in equity value, a nice discount to underlying net assets. With liquid asset holdings high and projected to grow during the next 4-6 quarters, I don’t see a whole lot of risk in HRBR shares, especially compared to the typical U.S. stock with stretched valuations averaging 5x to 10x net book accounting worth.
StockCharts, HRBR – 1 Year Graph of Daily Trading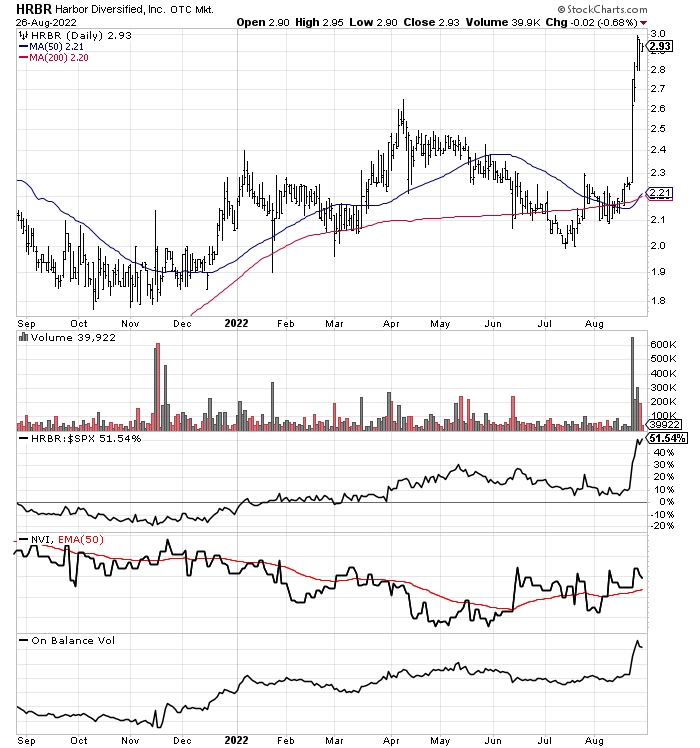
L.S. Starrett
L.S. Starrett (SCX) just moved some U.S. production to Brazil in 2021 to lower manufacturing costs, and the positive results of this restructuring have inflated income levels dramatically, to the strongest levels in at least a decade. Its products include precision tools, electronic gages, gage blocks, vision and laser measuring equipment, custom engineered granite solutions, tape measures, levels, chalk products, squares, band saw blades, hole saws, hacksaw blades, jig saw blades, reciprocating saw blades, M1 lubricant and precision ground flat stock. L.S. Starrett operates in 100 countries selling to all types of customers, from carpenters/builders to auto mechanics and heavy industry buyers. Market leading brand-name measurement and cutting tools score well in customer surveys and are recognized around the world.
47% of sales in 2022 were made overseas, with manufacturing done in America, Brazil, and China. EPS reached $2.06 for the fiscal year ended in June, giving the stock a trailing P/E under 5x. The value of the whole company on Wall Street is around $70 million at $9 per share on $253 million in trailing 12-month sales. Revenue rose +15% for the fiscal year, with operating margins 1% higher than FY2021. The company is tightly controlled with two classes of shares, and minor odds of a takeover or merger are the reason for its super-low valuation. $133 million in current assets vs. $97 million in total liabilities are part of a conservative management style. The book value is listed as $14 per share. I would recommend the company reinstate a dividend, perhaps of $0.50 (or greater) annually to get the stock quote back above book value.
StockCharts, SCX – 1 Year Graph of Daily Trading
Final Thoughts
The Volume Breakout Report has highlighted a number of big winners over the past 9 weeks. For shorter-term traders, strong momentum with outlier trading volume action can be clues of future price gains. Of course, a diversified basket of selections (at least 20-30 names) is the smartest way to reduce risk, as smaller companies tend to have volatile price swings, with minor dollar amounts able to move marketplace equilibrium quickly. By the time good news events are released to the public, insiders and knowledgeable long-term investors in each company often buy shares before the typical retail investor can act. The VBR is an early signal tool for investors looking for a trading edge.
If new to the Volume Breakout Report series, you can read past efforts to get a better understanding of this research effort. The July 9th update is a good place to start, with strategies on how to use VBR picks. High volume (vs. the recent past) advances in price are just one part of the system and proprietary formulas I have invented. Daily computer searches that utilize as many as 15 indicators of technical trading momentum are ranked against thousands of equities, to find the best opportunities. Then, a review of company fundamentals and growth prospects (using 35 years of investing experience) narrows each short list to the picks I write about.
I suggest readers take the time to do further research into any of the VBR selections that appeal to you, a function of your risk appetite or sector exposure needs in portfolio construction. Understand small-cap choices should be a limited portion of portfolio design, with higher risk and reward characteristics. Please consider using preset stop-loss sell orders to reduce downside potential in individual names. Depending on your risk tolerance, 10% to 30% stop levels are recommended. Cutting your losses quickly is an important part of the investing process, while winners should be allowed to run for a spell. My goal is VBR selections can deliver a win/loss success rate of 60% over 6-8 weeks of trading.
Thanks for reading. Please consider this article a first step in your due diligence process. Consulting with a registered and experienced investment advisor is recommended before making any trade.
Be the first to comment