

JHVEPhoto
CME Group (NASDAQ:CME) is owns and operates various futures markets globally including well known exchanges such as CBOT, NYMEX, COMEX and others. Name a commodity or other financial instrument and CME Group likely has a futures market that you can trade or hedge on. Things like interest rates, equity indexes, foreign exchange, agricultural commodities, energy, and metals.
Additionally, CME Group offers clearing and settlement services for their exchanges. CME Group also has access to plenty of data regarding historical pricing and can be sold in conjunction with risk mitigation services.
The various financial intermediary/markets businesses are some of my favorite. They need little in the way of additional capital investments while still being able to grow. Also, once a market becomes liquid enough that market becomes a de facto monopoly for that vehicle as investors and traders seek out liquidity.
In effect, CME Group makes its money through higher trading volumes. Over time and with the introduction of new trading vehicles CME Group should continue to benefit from higher activity and trading levels.
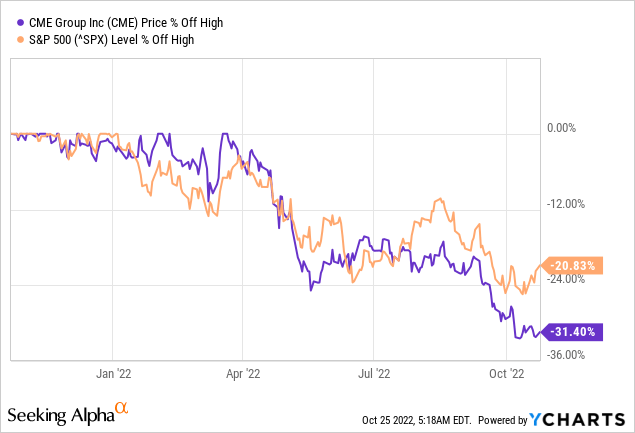
CME Group’s shares are currently around 31% off their high from early January compared to the S&P 500’s 21% pullback over that same time. The decline over that time was likely warranted as CME Group appeared quite expensive when I last examined the business. With the 31% pullback I wanted re-examine what I believe is a strong business to see if the valuation finally makes sense.
Dividend History
Dividend growth investing is the strategy that most appealed to me when I began investing my savings into individual companies. The strategy is simple in theory: find companies that have a history of paying and growing their dividend over time and that you believe will continue to do so and then don’t pay too much to own a stake.
CME Group Dividend History (CME Group Investor Relations)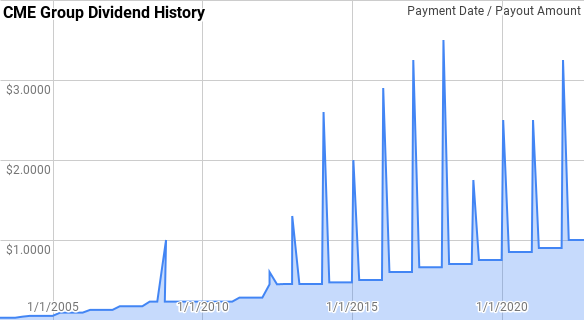
CME Group’s dividend growth streak currently sits at 12 years old giving them the title of Dividend Contender. However, they’ve paid the same or higher dividend each year since 2003. There was a brief pause in dividend growth in both 2009 and 2010 which considering that the financial world was in chaos, I’m willing to forgive that. Additionally CME Group has routinely paid out special dividends which amount to $26.15 paid out thus far.
Since 2003 CME Group’s year over year dividend growth has ranged from 0.0% to 76.9% with an average of 21.9% and a median of 11.1%.
There’s been 15 rolling 5-year periods over that time with annualized dividend growth coming in between 8.1% to 34.6% with an average of 16.1% and a median of 15.4%.
Additionally there’s been 10 rolling 10-year periods with CME Group’s annualized dividend growth spanning from 8.4% to 30.5% with an average of 16.4% and a median of 14.2%.
The rolling 1-, 3-, 5-, and 10-year annualized dividend growth rates from CME Group, excluding special dividends, since 2003 can be found in the following table.
| Year | Annual Dividend | 1 Year DGR | 3 Year DGR | 5 Year DGR | 10 Year DGR |
| 2003 | $0.126 | ||||
| 2004 | $0.208 | 65.08% | |||
| 2005 | $0.368 | 76.92% | |||
| 2006 | $0.504 | 36.96% | 25.99% | ||
| 2007 | $0.688 | 36.51% | 49.00% | ||
| 2008 | $0.920 | 33.72% | 35.72% | 29.56% | |
| 2009 | $0.920 | 0.00% | 22.21% | 34.63% | |
| 2010 | $0.920 | 0.00% | 10.17% | 20.11% | |
| 2011 | $1.120 | 21.74% | 6.78% | 17.32% | |
| 2012 | $1.792 | 60.00% | 24.89% | 21.10% | |
| 2013 | $1.800 | 0.45% | 25.07% | 14.37% | 30.46% |
| 2014 | $1.880 | 4.44% | 18.84% | 15.36% | 24.63% |
| 2015 | $2.000 | 6.38% | 3.73% | 16.80% | 18.45% |
| 2016 | $2.400 | 20.00% | 10.06% | 16.47% | 16.89% |
| 2017 | $2.640 | 10.00% | 11.98% | 8.06% | 14.39% |
| 2018 | $2.800 | 6.06% | 11.87% | 9.24% | 11.77% |
| 2019 | $3.000 | 7.14% | 7.72% | 9.80% | 12.55% |
| 2020 | $3.400 | 13.33% | 8.80% | 11.20% | 13.96% |
| 2021 | $3.600 | 5.88% | 8.74% | 8.45% | 12.39% |
| 2022 | $4.000 | 11.11% | 10.06% | 8.67% | 8.36% |
Source: Author; Data Source: CME Group Investor Relations
The dividend payout ratio lets you know how sustainable the dividend has been, at least compared to historic earnings or cash flow, and in effect how much cushion is built into the dividend payment.
CME Adj Dividend Payout Ratios (CME SEC filings)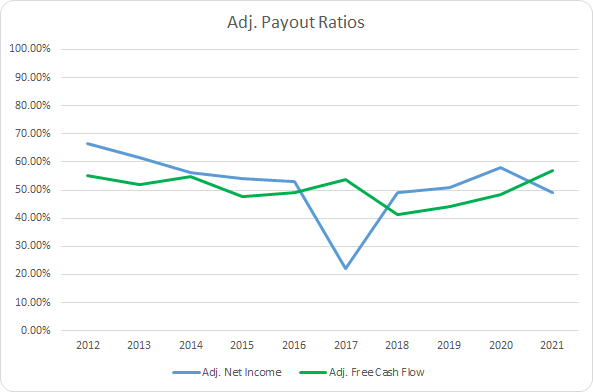
Since CME Group is one of the rare companies that pays both a regular and special dividend I’ve adjusted the payout ratios to reflect just the regular payment. Over the last decade the net income payout ratio has averaged 52.0% with the 5-year average coming to 45.8%. Similarly, the average free cash flow payout ratios are 48.8% and 48.9%, respectively.
Quantitative Quality
Investing for the long term is easiest when accompanied with a high quality business. Having a business that you don’t have to fret and worry about is one of the easiest ways to sleep well at night while letting the business compound over time. As such I examine a variety of financial metrics to get comfortable with a business’ quality.
CME Revenue Profits and Cash Flow (CME SEC filings)
CME Group has shown steady, albeit modest, growth over time with revenues climbing 60.9% in total over the last decade or 5.4% annualized. Gross profits have tracked right along with revenue growth rising 62.0% in total or 5.5% annualized.
Operating profits lagged slightly behind improving by just 56.3% or 5.1%; however, operating cash flow far outpaced sales growth increasing by 97.0% or 7.8% annualized. Most importantly, free cash flow rose by 111.1% or 8.7% annualized.
My expectation is that great businesses should be able to defend their positioning with at a minimum stable margins over time although rising margins is always a plus. I want to see free cash flow margins greater than 10% and take that as a sign of a strong cash generative business.
CME Margins (CME SEC filings)
CME Group’s gross margins have been steady with a 10-year average of 82.5% and a 5-year average of 82.9%. Free cash flow margins have generally been rising as well; although that have levelled off for the last 4 years. The 10-year average free cash flow margin for CME Group is 45.2% with the 5-year average coming to 49.9%.
An alternative profitability metric can be determined by comparing the free cash flow to some measure of assets or capital. This lets you know how efficient the business is able to use its assets or invested capital base to generate free cash flow. Once again I prefer to see a FCF ROIC greater than 10%; however, it should at least be stable and preferably rising over time.
CME Free Cash Flow Returns (CME SEC filings)
CME Group doesn’t pass the 10% FCF ROIC threshold; although, it has been trending higher which is a plus. The 10-year average FCF ROIC for CME Group is 6.6% with the 5-year average coming to 7.7%.
CME Group’s FCF return on tangible capital is extremely strong as there’s very little in the way of physical capital needs for the business. The 10-year average FCF ROTC is 115.2% with the 5-year average sitting at 149.3%.
To understand how CME Group uses its free cash flows I calculate three variations of the metric, defined below:
- Free Cash Flow, FCF: Operating cash flow less capital expenditures
- Free Cash Flow after Dividend, FCFaD: FCF less cash dividend payments
- Free Cash Flow after Dividend and Buybacks, FCFaDB: FCFaD less net cash used on share repurchases
CME Free Cash Flows (CME SEC filings)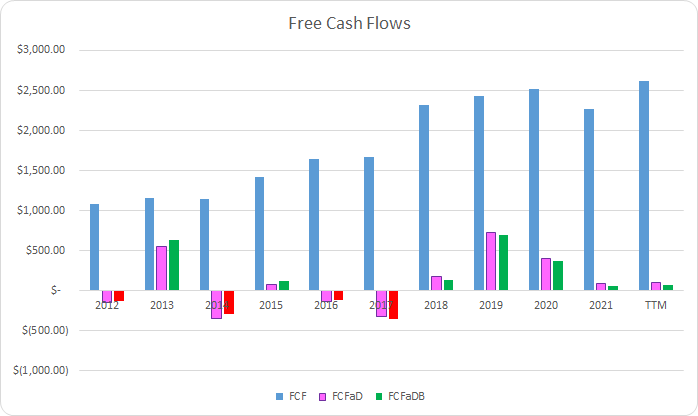
Over the last decade CME Group has generated a total of $17.67 B in FCF. Including both regular and special dividends CME Group has sent to shareholders a cumulative $16.59 B. That puts the 10-year total FCFaD at $1.08 B. CME Group’s cumulative net cash spent on share repurchases is +$0.45 B over that time which brings the FCFaDB to $1.12 B.
Since CME Group pays both regular and special dividends I’ve also included the free cash flow chart that excludes the special dividends as seen below.
CME Adj Free Cash Flows (CME SEC filings)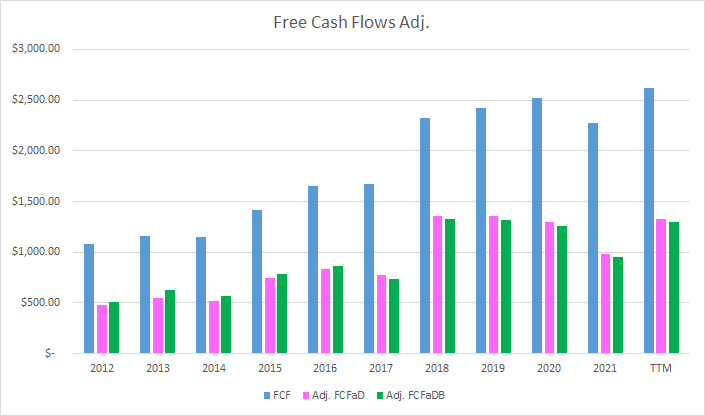
Adjusting for the special dividends, CME Group’s cumulative dividends paid is $8.77 B with the FCFaD then at $8.90 B.
With excess cash after paying a regular dividend companies are left with a few options. They can repurchase shares, pay down debt, build the cash up as a buffer or potential acquisition ammunition, or pay special dividends. Very few companies opt for the special dividend route, instead targeting share repurchases; however, CME Group is very much the exception.
CME Shares outstanding (CME SEC filings)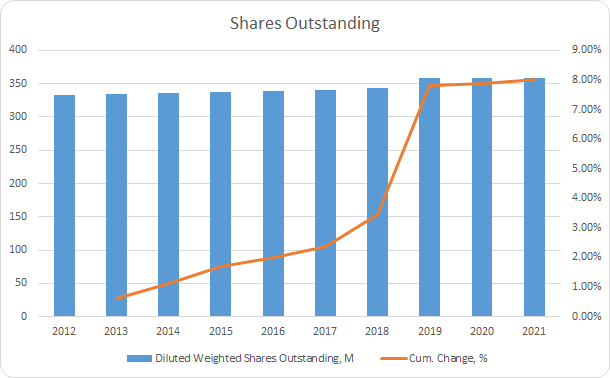
CME Group’s share count is actually higher between FY 2012 and FY 2021 as they don’t commit substantial capital towards share repurchases. Over that time the share count is higher by 8.0% or ~0.9% annualized. Much of that increase is related to the NEX acquisition.
When I’m examining potential investments I want to make sure the balance sheet is in good shape and that there is not excessive leverage to potentially jeopardize my equity stake. As we’ve seen thus far in 2022 interest rates can in fact rise. For companies that were heavily leveraged, especially with the balance coming due soon, they could see significantly higher interest rates on debt that is rolled over crimping their cash flows.
CME Debt to Capitalization (CME SEC filings)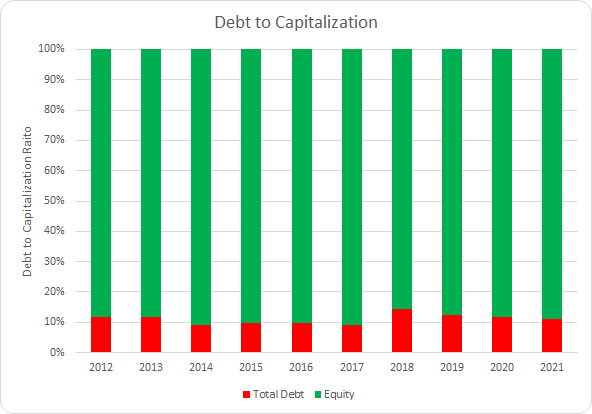
In terms of their capital structure, CME Group’s debt-to-capitalization ratio looks very solid and most importantly stable. The 10-year average debt-to-capitalization ratio is just 11% with the 5-year average sitting at 12%.
Additionally, I compare the net debt levels versus various profit or cash flow metrics. In effect this lets you know how quickly the debt load could be paid off if all of their cash and profit or cash flow for a given year was used to retire the debt.
CME Debt Ratios (CME SEC filings)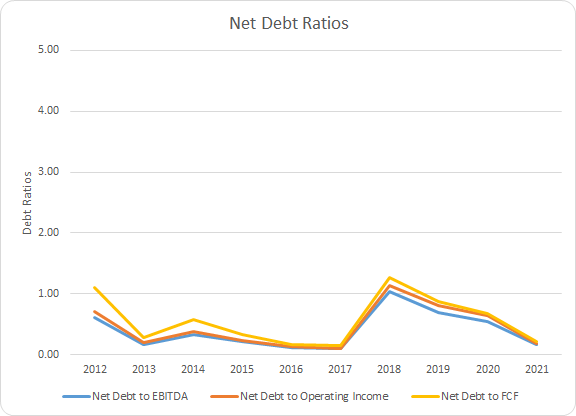
CME Group maintains very modest leverage compared to the income the business generates. The 10-year average net debt-to-EBITDA, net debt-to-operating income, and net debt-to-FCF ratios are 0.4x, 0.5x, and 0.6x, respectively. Accordingly, the 5-year averages come to 0.6x, 0.7x, and 0.8x.
How Did We Get Here?
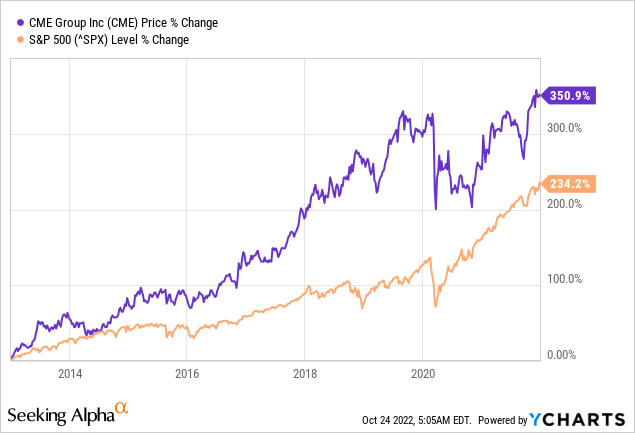
Between December 31, 2012 and December 31, 2021, CME Group’s share price rose 350.9% which works out to a 16.3% annualized growth rate. Compare that to the S&P 500’s 234.2% rise over the same time and CME Group has handily outperformed. Add in the 3.5% dividend yield at the beginning and the CAGR over that time, excluding the special dividends, is 19.8%.
Investors that bought and held since at the beginning of that period have benefitted greatly. Not only has the share price risen by 350% they’ve also received $23.52 in cash dividends plus an additional $24.25 in special dividends for total cash dividends of $47.77 per share. In other words you’ve received 94% of your initial investment back through dividends alone over that time.
Growth and improvement in the underlying business is what should drive the bulk of returns over time. CME Group, excluding special dividends has shown a 19.8% CAGR and I’ve broken that return down into components that should roughly estimate the business returns, capital allocation returns, and sentiment change.
- Business Returns: Measured as annualized revenue growth rate plus annualized rate of change in net profit margin
- Capital Allocation Returns: Measured as initial dividend yield plus annualized changed in share count
- Sentiment Change: Measured as annualized change between starting and ending P/E multiple
Revenues grew by a modest 60.9% in total which accounted for a +5.3% annual contribution to the returns. Additionally, CME Group’s net profit margin improved from 30.8% to 55.8% which was another +6.7% contribution to returns. All told the business returns justified +12.0% CAGR over that time.
As we saw earlier the share count rose by 8.0% over that time which represents a -0.8% contribution to returns. Combined with the initial dividend yield of 3.5% that brings the capital allocation return contribution over that period to +2.7% annualized.
Additionally, CME Group benefitted from investor enthusiasm, as most companies did as that end point represented nearly the top for the markets in general. The P/E multiple rose from 18.8x at the beginning to 31.3x at the end. That puts the sentiment change allocation of returns to +5.1%.
| Annualized Returns | % of Returns | |
| Business Returns | 12.0% | 60% |
| Capital Allocation Returns | 2.7% | 14% |
| Sentiment Change | 5.1% | 26% |
| Total Annualized Returns | 19.8% |
Source: Author
During that period, improving business fundamentals accounted for around 60% of the returns that investors received. Capital allocation accounted for around 14% excluding the special dividends with sentiment change making up the remaining 26%.
CME Return Breakdown (CME Group SEC filings)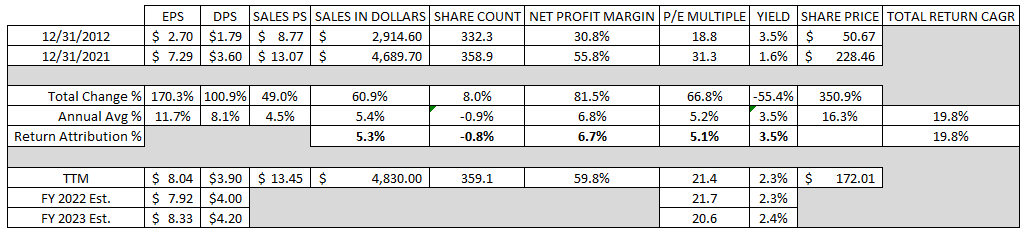
Looking forward to the next decade I would expect that CME Group should be able to still show revenue growth in the low to mid single digits ex-M&A. Additionally, I would expect net profit margin to still rise; however, not nearly at the pace that it showed over the prior decade.
CME Group currently offers a dividend yield around 2.3%. The question then becomes do they switch to share repurchases or maintain paying out around 100% of cash earnings. I would tend to expect special dividends will be their modus operandi barring the valuation getting extremely cheap.
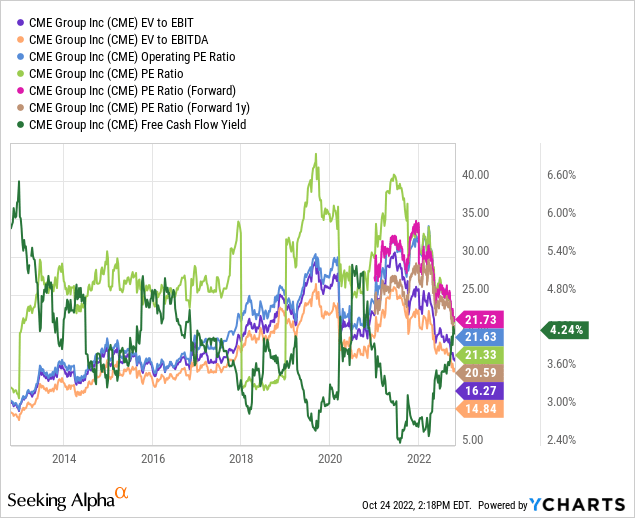
As far as sentiment change there’s a big range in potential outcomes. The current TTM and FY 2023 forward multiple don’t appear extremely expensive at 21.4x and 20.6x, respectively. However, with just modest growth expectations and using the Graham Number valuation, which accounts for growth in relation to interest rates, a fair P/E for CME Group to trade at is significantly lower in the 13-15x range. If interest rates fall that would push the fair multiple higher given the same growth expectations.
Valuation
In my opinion CME Group is a quality company that should continue to perform well for investors over time. The question now becomes whether the valuation appears cheap, reasonable, or expensive. I use 3 valuation methods to try and home in on a fair value range for CME Group including dividend yield theory, a reverse discounted cash flow analysis, and a minimum acceptable rate of return, “MARR”, analysis to value the business through different viewpoints.
Dividend yield theory a simple valuation methodology that operates under the assumption that investors, collectively, will value a business such that it offers a normal dividend yield over time. For CME Group I’ll use the 3-year average forward dividend yield as a proxy for fair value.
CME Group Dividend Yield Theory (CME Group Investor Relations and Google Finance)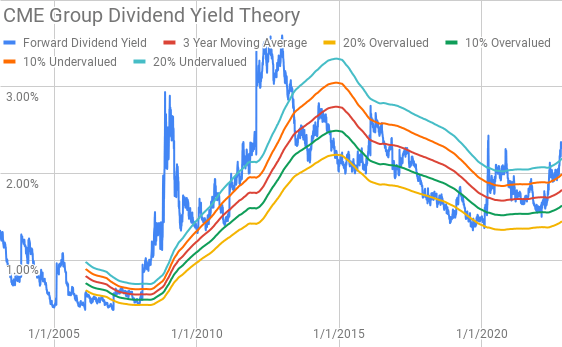
CME Group’s dividend yield currently sits at 2.33%, based on the regular dividend only, compared to the 3-year average forward dividend yield of 1.81%.
A reverse discounted cash flow analysis can be used to figure out what kind of growth and margin expectations you need to believe a business can show in order to generate the cash flows that would support the current market valuation. I use a simplified DCF model based on revenue growth, an initial free cash flow margin of 50% that improves to 55% during the forecast period and a terminal growth rate 3.0%.
For the discount rate I’ve used an after tax cost of debt of 3.5% with both a 10% and 8% cost of equity. That yields a discount rate of 9.6% and 7.8%, respectively.
With the 10% cost of equity / 9.7% discount rate scenario, CME Group needs to grow revenues 9.6% annualized during the forecast period in order to generate the cash flows that justify the current valuation. However, with an 8% cost of equity / 7.8% discount rate, the required revenue growth rate is just 4.4% during the forecast period.
The MARR analysis entails estimating the future earnings and dividends that a business will show over a given period of time. You then apply a reasonable and conservative exit multiple on those future earnings to determine what the share price could potentially be at that future date. If the expected return is greater than your minimum threshold in order to invest then you can feel free to invest in the business.
Analysts expect CME Group to show FY 2022 EPS of $7.92 and FY 2023 EPS of $8.33. They also expect CME Group to be able to grow EPS at a 6.0% annual rate for the following 5 years. I then modeled CME Group’s EPS growing at a 5.0% annual rate for the following 5 years. Dividends are assumed to target a 50% payout ratio.
Over the last decade, CME Group has typically been valued by investors for a TTM P/E ratio between ~15x and ~30x. Although for the majority of that period CME Group traded in a more narrow band around ~25x. For the MARR I’ll examine terminal multiples spanning that range.
The following table shows the potential internal rates of return that CME Group could earn for investors if the assumptions laid out above prove to be reasonable forecasts of the future. Returns assume that dividends are paid an increased along the time line that CME Group has usually followed and that shares are purchased around $172, Monday’s intra-day pricing. The following excludes the likely continued special dividends.
| IRR | ||
| P/E Level | 5 Year | 10 Year |
| 30 | 14.8% | 11.0% |
| 25 | 11.0% | 9.2% |
| 22.5 | 8.9% | 8.2% |
| 20 | 6.6% | 7.1% |
| 17.5 | 4.1% | 5.9% |
| 15 | 1.3% | 4.5% |
Source: Author
Alternatively, I’ve used the MARR analysis framework to calculate the maximum price I could pay for shares today in order to generate the returns that I desire from my investments. My base hurdle rate is a 10% IRR and for CME Group I’ll also examine 12% and 8% return targets.
| Purchase Price Targets | ||||||
| 10% Return Target | 12% Return Target | 8% Return Target | ||||
| P/E Level | 5 Year | 10 Year | 5 Year | 10 Year | 5 Year | 10 Year |
| 30 | $214 | $189 | $197 | $160 | $234 | $223 |
| 25 | $182 | $163 | $167 | $139 | $199 | $192 |
| 22.5 | $166 | $150 | $152 | $128 | $181 | $177 |
| 20 | $150 | $137 | $137 | $118 | $163 | $161 |
| 17.5 | $133 | $124 | $123 | $107 | $145 | $146 |
| 15 | $117 | $112 | $108 | $96 | $127 | $130 |
Source: Author
The following shows the purchase price targets if we include estimates for the special dividend payments. CME Group has paid special dividends consistently since 2012 with the special dividend being on average 108% of the regular quarterly payment total. To err on the conservative side I’ve assumed that special dividends will be just 50% of the regular dividend annual payout.
| Purchase Price Targets | ||||||
| 10% Return Target | 12% Return Target | 8% Return Target | ||||
| P/E Level | 5 Year | 10 Year | 5 Year | 10 Year | 5 Year | 10 Year |
| 30 | $222 | $204 | $204 | $175 | $242 | $240 |
| 25 | $189 | $179 | $174 | $153 | $206 | $209 |
| 22.5 | $173 | $166 | $159 | $143 | $188 | $194 |
| 20 | $157 | $153 | $144 | $132 | $170 | $179 |
| 17.5 | $140 | $140 | $129 | $121 | $153 | $163 |
| 15 | $124 | $127 | $115 | $111 | $135 | $148 |
Source: Author
Conclusion
CME Group is a very strong business and one that I would love to add to my portfolio. CME Group isn’t likely to show incredibly strong growth; however, I expect to see relatively stable growth over time. As an intermediary that largely deals in bits, not widgets, they are able to maintain very strong margins and need very little additional capital investments in order to grow.
Dividend yield theory suggests that shares are quite undervalued presently. The fair value range from this valuation methodology is $200 to $245.
The reverse discounted cash flow analysis suggests that 10% returns are not likely as the required revenue growth and margin expansion is pretty high at over 9% annualized. However, 8% returns appear much more likely based on the reverse DCF analysis.
The MARR analysis gives a fair value range between $133 and $166 with a 10% IRR target 5 years out and a fair P/E range between 17.5x and 22.5x. Including the likely special dividends that will be paid out the fair value range rises to $140 to $173.
The various financial markets businesses are some of my favorite as they typically carry high margins and need very little capital investment to grow. That means that earnings or free cash flow should grow faster than underlying revenue growth over time and that nearly all of the free cash flow can accrue to investors.
As such CME Group can afford to send out essentially 100% of free cash flow to investors and while maintaining growth. CME Group is one of those rare companies that opts for special dividends rather than share buybacks which is frankly a plus in my book especially since it comes with very pretty modest dilution headwind. My expectation would be for a special dividend of at least $2.00, likely higher, to be announced in early December to continue with their history of special dividends.
In my opinion, CME Group is a strong business that should continue to improve over time. My ideal target would be to purchase shares sub-$150; however, I know that it’s easier for me to keep an eye on the business if I own a stake already. CME Group appears to be somewhere within the range of fair value currently which I believe is good enough to warrant a starter position in the business with aims to add on further weakness.
Be the first to comment