

juliannafunk
Investment Thesis
Despite the extreme recessionary fears and the massive destruction in value the stock market has witnessed since November 2021, it seems that Cloudflare (NYSE:NET) has missed the correction memo and continued to trade at pandemic bubble valuations. The NET stock may have drastically plunged by -73.87% since hitting peak valuations in November 2021, compared to the S&P 500 Index’s fall of -19.98% at the same time. However, the former is still trading at ridiculously elevated NTM P/E valuations of 991.81x compared to its peers’ median of -15.38x. Otherwise, NTM MC/FCF of 4,160.58x to the industry median of 10.34x. Shocking, given the catastrophic bleeding we have seen on the streets.
In addition, NET is not expected to report meaningful improvement in its profitability through FY2024, thereby highlighting the company’s aggressive plan in growing its consumer base ahead at the cost of poor margins and continued share dilution. While this strategy had worked effectively during the pandemic, Mr. Market is less convinced now and obviously wants a more fruitful result, pointing to the stock’s poor performance thus far.
Combined with the worsening market sentiments, we are uncertain how NET would perform ahead, since the S&P 500 Index has also exhibited interesting optimism since plunging below its previous June lows. The latter has reported a 7.04% recovery in the short span of two weeks, with many analysts postulating its bottom levels and the incoming recovery cycle ahead. Well, no one knows for sure how long this rally will last, since the Feds are due to meet again by 02 November, potentially triggering more uncertainties. Therefore, investors who add at these levels should also be prepared for more short-term volatility, given the speculative nature of this stock.
NET’s Contract Wins Are Not Translated To Profitability Yet
S&P Capital IQ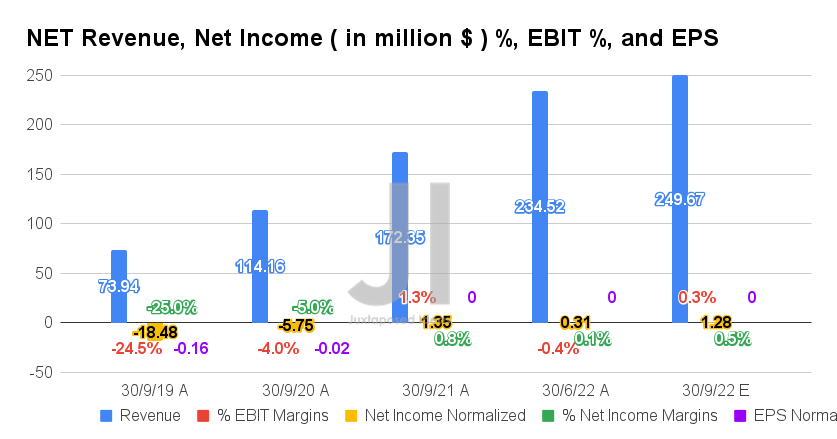
For its upcoming FQ3’22 earnings call, NET is expected to report revenues of $249.67M and EBIT margins of 0.3%, indicating excellent QoQ growth of 6.46% and 0.7 percentage point, respectively. Otherwise, an increase of 44.86% though a moderation of -1 percentage point YoY, respectively.
In the meantime, there are notable improvements in NET’s profitability, with the projected net incomes of $1.28M and net income margins of 0.5% for the next quarter. These numbers represent massive improvements of 412.90% QoQ though a moderation of -5.18% YoY. Nonetheless, its EPS remains in line with $0.00 for FQ3’22, potentially triggering further sideways price action ahead, as seen since May 2022.
S&P Capital IQ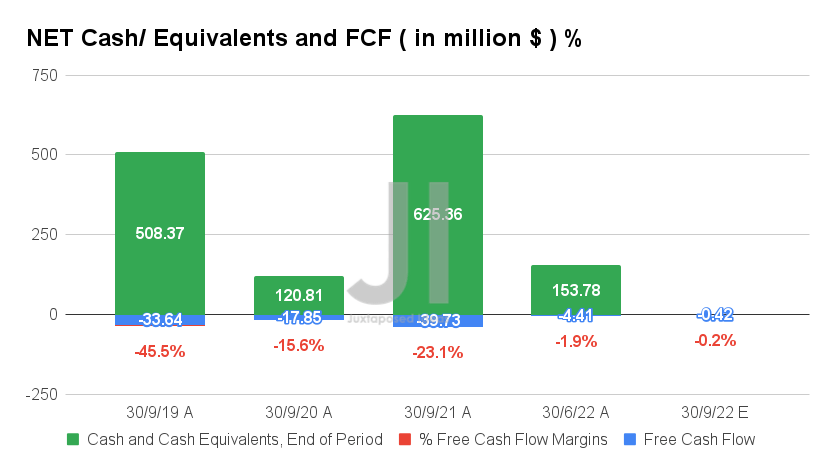
In the meantime, analysts are expecting to see a much improved Free Cash Flow (FCF) generation of -$0.42M and an FCF margin of -0.2% in FQ3’22, attributed to the NET management’s guidance on moderated expenditure though narrowed margins through the impending recession. We’ll see how the company performs in the next earnings call, since we are starting to see notable improvements of 93.15% QoQ in FQ2’22.
S&P Capital IQ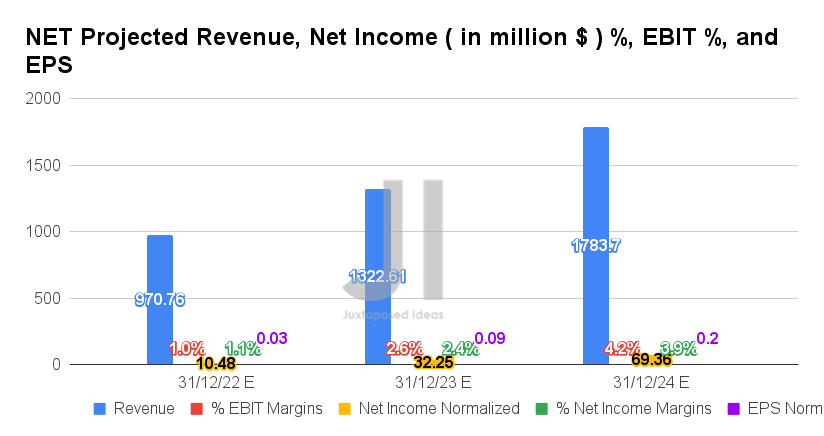
In the meantime, NET is still expected to record excellent revenue growth at a CAGR of 39.5%, while reporting net income profitability from FY2022 onwards at an impressive CAGR of 156.9% between FY2022 and FY2024. Analysts are projecting net income margins of 3.9% and FCF margins of 3.3% by FY2024, though we suppose Mr. Market is likely unsatisfied with those figures, seeing its current yoyoing stock valuations.
For FY2022, NET is expected to report revenues of $970.76M, net incomes of $10.48M, and EPS of $0.03, indicating massive YoY growth of 47.9%, 169.3%, and 164.4%, respectively. However, FCF profitability is still likely a distance away, though things may improve from FY2023 onwards with margins of 2.3%. We’ll see, since analysts also predict that NET will improve its liquidity on its balance sheet ahead.
S&P Capital IQ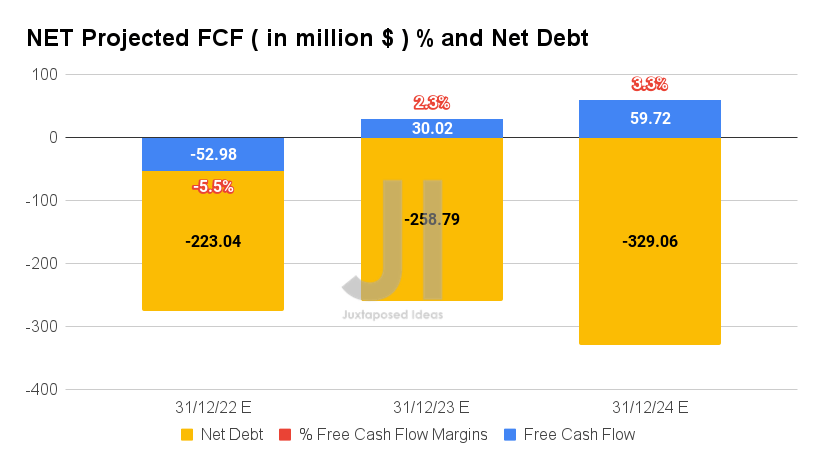
In the meantime, we encourage you to read our previous article on NET, which would help you better understand its position and market opportunities.
- Cloudflare: Stormy Clouds Ahead, Still Too Expensive
So, Is NET Stock A Buy, Sell, or Hold?
NET 3Y EV/Revenue and P/E Valuations
S&P Capital IQ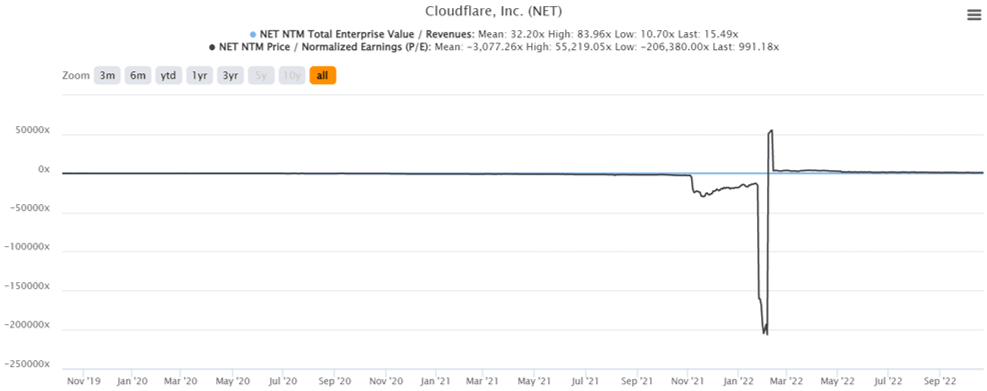
NET is currently trading at an EV/NTM Revenue of 15.49x and NTM P/E of 991.18x, lower than its 3Y EV/Revenue mean of 32.20x though massively improved from its 3Y P/E mean of -3,077.26x. The stock is also trading at $53.92, down -75.67% from its 52 weeks high of $221.64, though at a premium of 38.39% from its 52 weeks low of $38.96. Nonetheless, consensus estimates remain bullish about NET’s prospects, given their price target of $91.30 and a 69.32% upside from current prices.
NET 3Y Stock Price
Seeking Alpha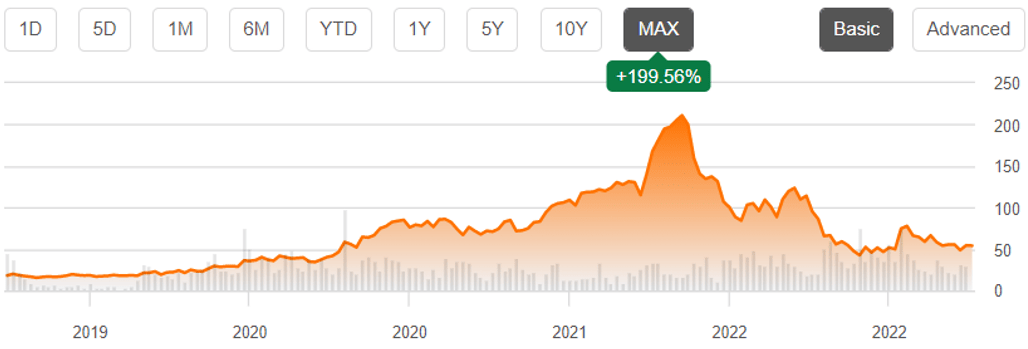
However, we are less optimistic, since there is little upside from current levels. The NET stock had continued to trade rangebound at the $50s level, despite its contract wins and customer growth thus far. The underperformance is probably attributed to the company’s lack of meaningful net income and FCF profitability for the next few years. Thereby, leading to increased SBC expenses and, consequently, share dilution moving forward. By now, NET has already reported a massive 249.12% growth in SBC expenses from FY2020 levels to $140.33M by the last twelve months. This has naturally contributed to the tremendous ballooning in its share count to 325.20M by FQ2’22, indicating an eye-watering increase of 275.45% since its IPO in September 2019.
With the September PPI remaining sticky thus far with the US labor market outperforming analysts’ estimates, the market is unlikely to capitulate in the short term as well. The Feds are liable to raise its terminal rates to over 5%, with 97.3% of analysts predicting a 75 basis points hike in the former’s upcoming November and, likely, December meeting. With reduced equity funding and elevated interest rates, we expect to see tightened industry spending ahead, as more companies embark on drastic cost-cutting measures. Even the leading software company, Microsoft (MSFT), had to recently lay off more staff due to the slowing top-line growth.
NET’s best-case scenario is naturally to trade sideways for the next few quarters, before potentially recovering by H2’23 once the hikes ease and industry spending returns. However, there is also the worst-case scenario of the company missing top-line estimates, which fortunately has not been the case for the past twelve consecutive quarters. That tragic event would definitely cause the stock to plummet to the $40s, as seen during peak pessimism levels in June 2022.
While there are multiple merits in the company’s technological offerings, we continue to rate NET stock as a Hold for now, due to the massive uncertainties ahead. Do not fall for the trap.
Be the first to comment