

raisbeckfoto
Q3 preview and thesis
Cisco (NASDAQ:CSCO) is scheduled to report its CY Q3 (or its Q1 FY 2023) earnings report (“ER”) on Nov 16, 2022. I view its results in H1 of 2022 so far to be more choked by component availability than by weaker demand. To wit, its June quarter gross margin was down 370 basis points, largely caused by higher component, commodity costs, and as well as increased freight and logistics expenses related to supply constraints.
In the coming Q3, I expect the effects of these above headwinds to continue. During the Q3 ER, I will pay special attention to updates on the supply chain conditions, especially, if there are any signs of the easing of components shortage. During the Q2 ER, management mentioned that Cisco has been adding new suppliers and leveraging alternative ones actively. They had also been redesigning hundreds of products to use alternative components with similar capabilities and executing targeted price increases. I will watch out for updates on the effectiveness of these measures as well during the ER.
All told, I do not believe component pricing and shipping costs will decline anytime soon. And consensus estimates seem to support such a view. As seen in the chart below, consensus estimates expect an EPS of $0.80 for Q3 2022. Compared to last year’s Q3 EPS of $0.84, this represents a 5% decline YoY.
Although, I think the market concern over its headwinds is overblown. And as a result, these headwinds have been more than priced in already. As such, I see the company entering a buy zone. Any downward price jitter during Q3 ER would make it even more attractive. And the remainder of this article shows how attractive its current valuation is from two independent assessments: the typical PE multiple and also an asset approach.
Source: www.marketbeat.com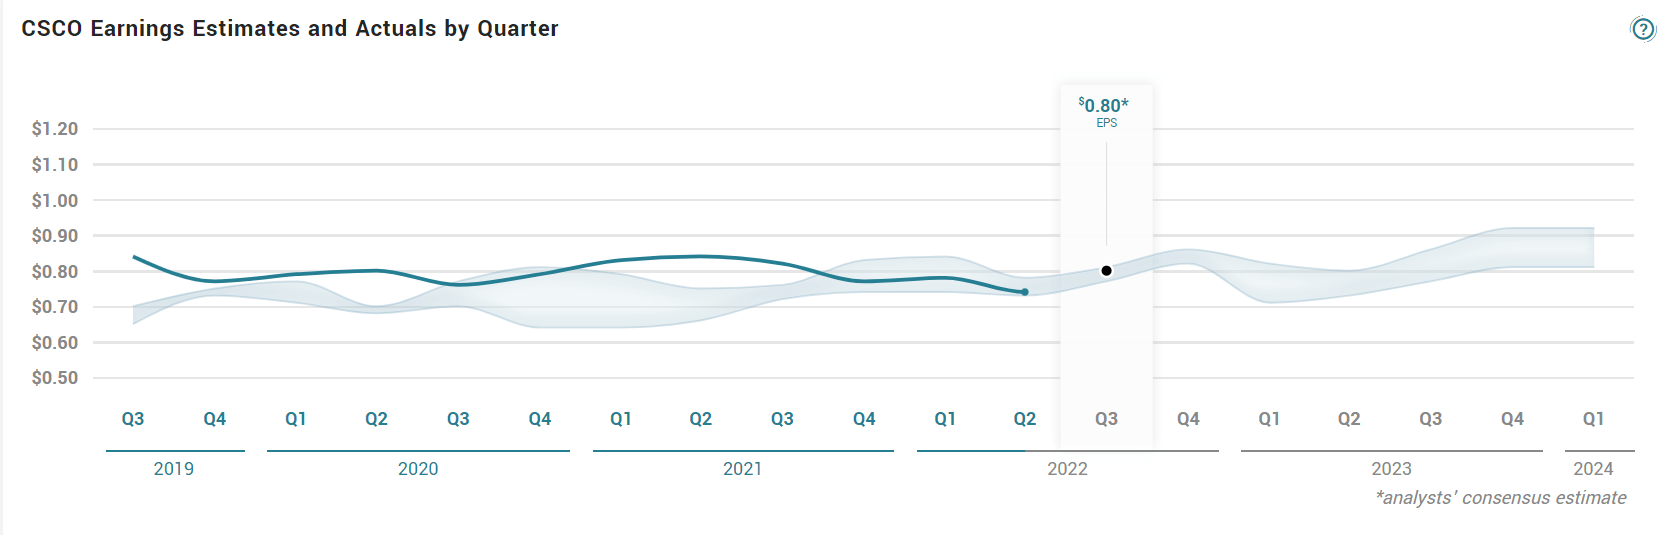
Assessment 1: Large discount in PE multiples
As seen from the top panel of the following chart, CSCO has been on average valued at 18.65x PE historically. As a mature business (and also a leader) in a relatively stable sector (Internet Protocol-based networking devices), its PE has been quite stable and only fluctuated in a narrow range from about 13x to 23x. Its current PE of 15.79x is at a significant discount from its past average of 18.65x.
In terms of FW PE, the discount is even larger. As you can see from the bottom panel of the chart, its FW PE is only 11.7x currently. In recent years, its FW PE has fluctuated between 10.3x to 18.1x with an average of 14.4x. Therefore, its current 11.7x PE is about 19% discounted from its average in recent years.
And next, you will see that such large discounts are confirmed by another independent assessment.
Source: Seeking Alpha data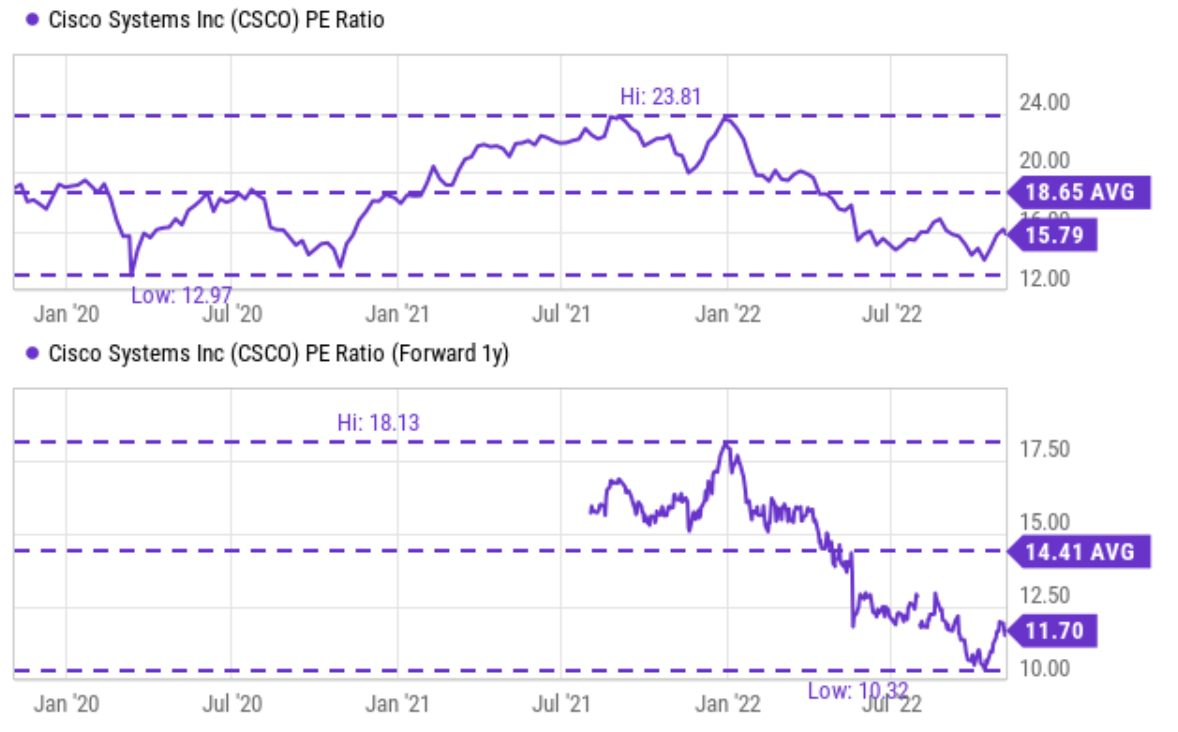
Assessment 2: Attractive asset and income too
For maturing businesses like CSCO in a relatively stable sector, another intuitive approach is based on its asset and income. The details are provided in our early articles. The gist of the idea is:
- If you think like a long-term business owner (instead of a stock trader), then investing in a mature business is nothing more than buying their asset to generate income in the form of dividends. So the investment value consists of two parts: the value of the assets and the dividends.
- In this valuation method, we approximate the first part by its book value (“BV”) and the second part by 10x of its dividends. In other words, the investment value (“IV”) should be: IV = BV + 10 x dividend
- This method offers the advantage of valuation anchored in the most easily obtainable data with the least amount of uncertainty: BV and dividend. In investing, we always prefer the use of a few data points that are reliable than many data points that are less reliable.
Following this method, the chart below compares the historical prices of CSCO vs. its IV. Note that in general, the above formula needs to be modified by a multiplier, M, into the following one.
IV = M x BV + 10 x dividend
The reason for using M is to adjust for the fact that some businesses’ assets are more valuable than others. In other words, $1 worth of assets can generate different amounts of income for different businesses, and the M factor adjusts such differences.
In this analysis, M was taken to be (ROE/10%)^2. A detailed description of this method is provided in Thomas Au’s book entitled “A Modern Approach to Graham and Dodd Investing”. The basic idea is:
The idea is that if a given business is earning an ROE that is above a benchmark (some kind of average, e.g., the ROE of the S&P 500 or the average ROE in its industry sector), then its BV should be valued more and M will be larger than 1 in this case, and vice versa. In the case of CSCO, because it’s such a well-established and large-cap business, I will just use 10% as the benchmark ROE, essentially the average ROE of the broader market in the long term.
As seen, the IV calculated this way captured the price actions quite closely in the long term. And currently, the IV based on its most recent BV and TTM dividend is about $58.1 per share. Compared to its price of $44.5 as of this writing, the stock is undervalued by about 23%, a bit larger but close enough to the 19% discount estimated by the PE assessment above.
Source: author based on data from Yahoo Finance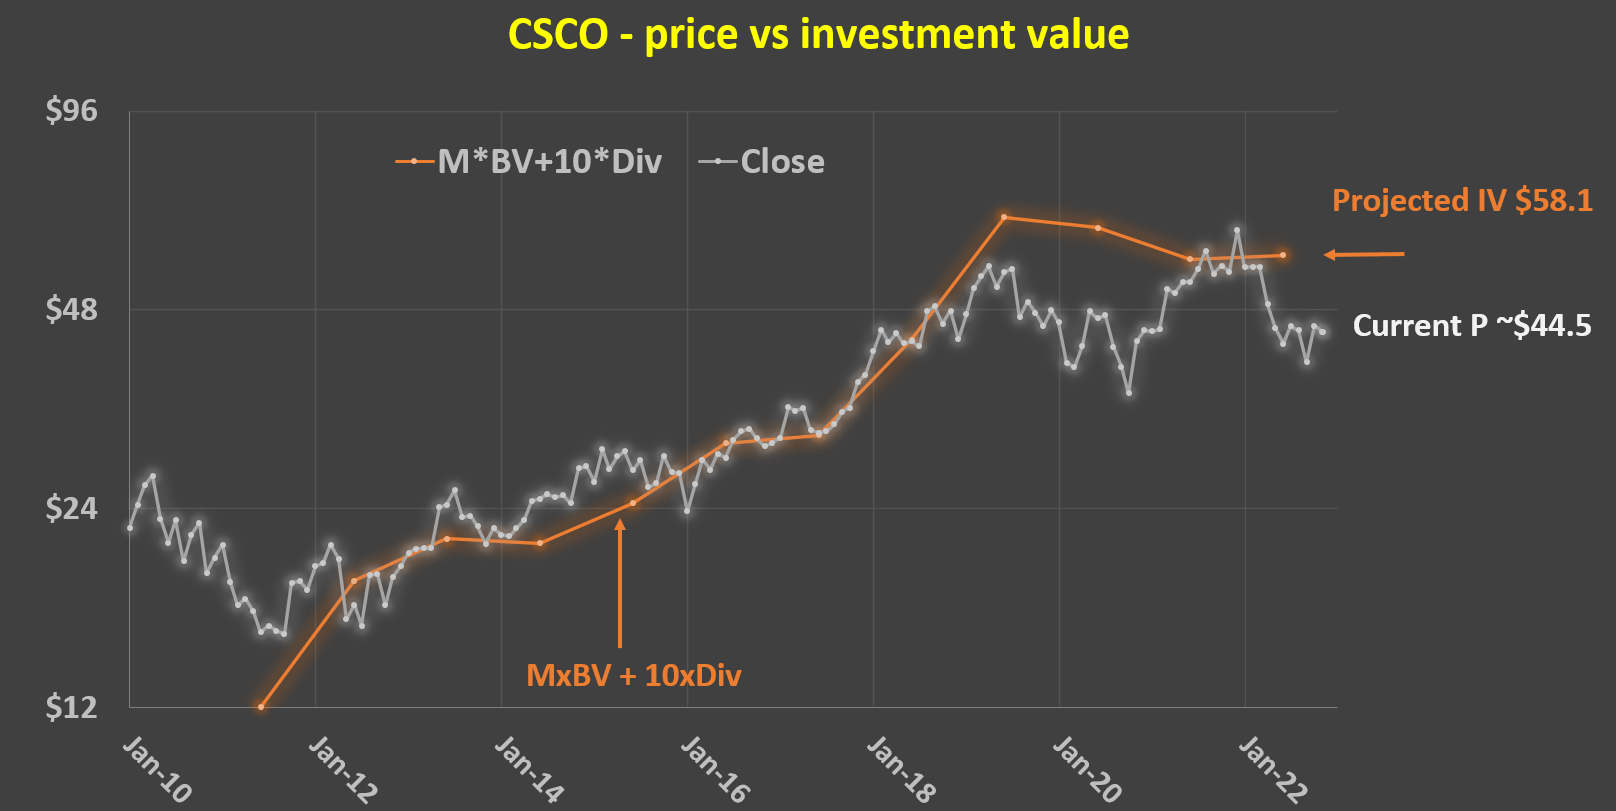
CSCO’s potential return in the next 5 years
Hope both of the above approaches are intuitive to you by now. If they are, it is quite simple to project return scenarios. The table below summarizes my projections based on both approaches.
Source: author based on Seeking Alpha data.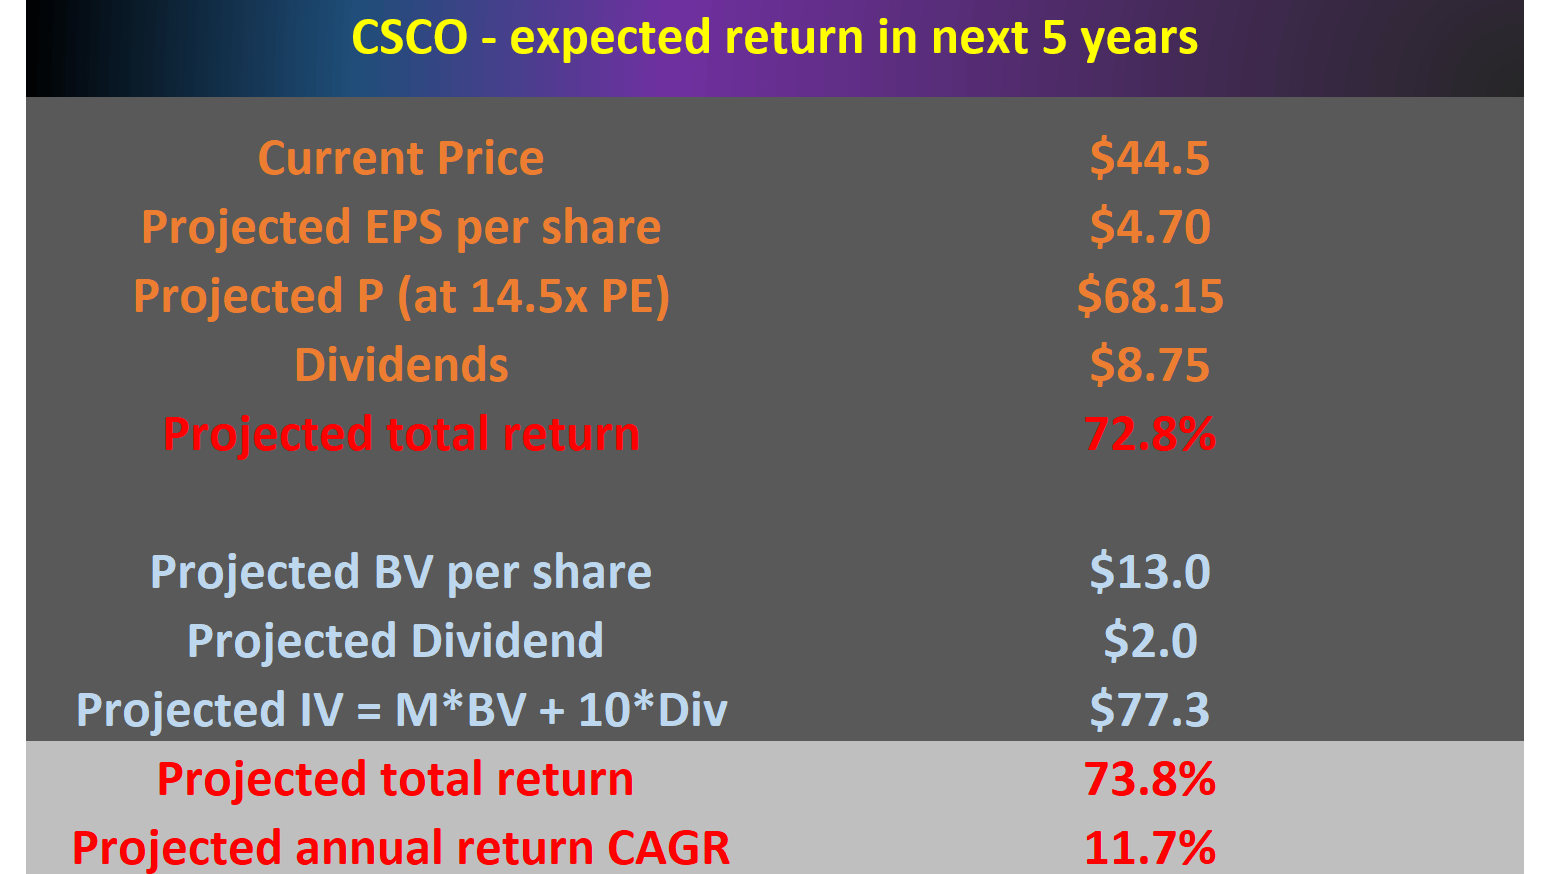
These projections are made under the following assumptions:
- In the PE approach, I assumed EPS to reach $4.7 in 5 years following the consensus estimate. And I assumed PE to revert to 14.5x, the historical average discussed above.
- In the IV-based approach, I assumed BV to grow to $13 per share. This is further based on the above EPS growth to $4.7 and also it maintaining the blowback ratio in the 15% to 20% range as it has in the recent few years.
- And finally, I am assuming dividend growth rates to match the EPS growth rates. And dividends are not reinvested.
Based on these assumptions, the PE approach shows a total return potential of 72.8% in 5 years. For the IV approach, the projected IV in 5 years would be about $77.3. And at the current price of $44.5, the projected IV is 73.8% higher, quite consistent with the 72.8% projected by the PE approach.
Risks and final thoughts
As aforementioned, the main risks I see are component availability, component pricing, and also cost control issues. Hence, in Q3 ER, I would especially watch out for signs of the easing of supply headwinds, global supply chain disruptions, and also cost issues.
Overall, my view is that the market concern over these headwinds is overblown, as reflected in the large valuation discounts. The discounts are confirmed by two independent assessments: the typical PE multiple and also an asset approach. In terms of PE, its current 11.7x FW PE is about 19% discounted from its historical average. By an asset and income approach, the stock is undervalued by about 23%, a bit larger but close enough to the 19% discount estimated by the PE assessment. At its current price, both approaches point to a large return potential in the next 5 years (both close to 73%), translating into a double-digit annual return potential of ~11.7%.
Be the first to comment