

Michael Derrer Fuchs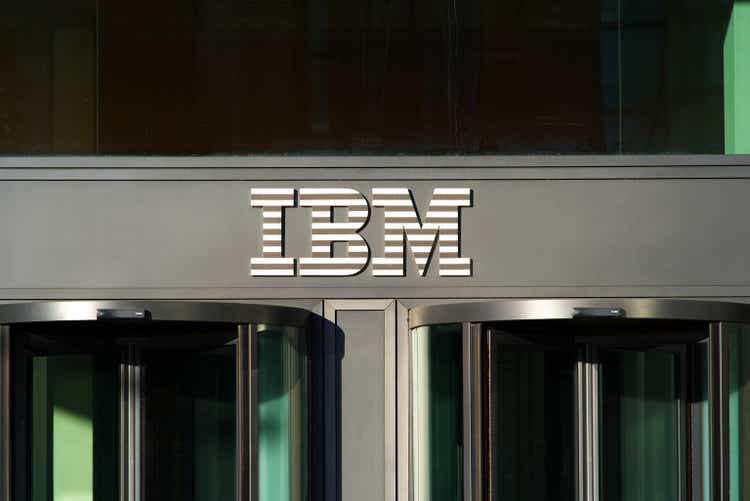
IBM’s (NYSE:IBM) share price is almost exactly where it was a year ago, but the substantial dividend yield brings the total 12-month return up to +5.7% vs. -6.5% for the S&P 500 (SPY). IBM’s Q2 results, reported on July 18th, highlighted steady revenue growth across the company’s business lines. This solid performance is exactly what investors want to see, a step towards validating Arvind Krishna’s vision of a revitalized IBM, focusing on hybrid cloud and AI offerings.
Seeking Alpha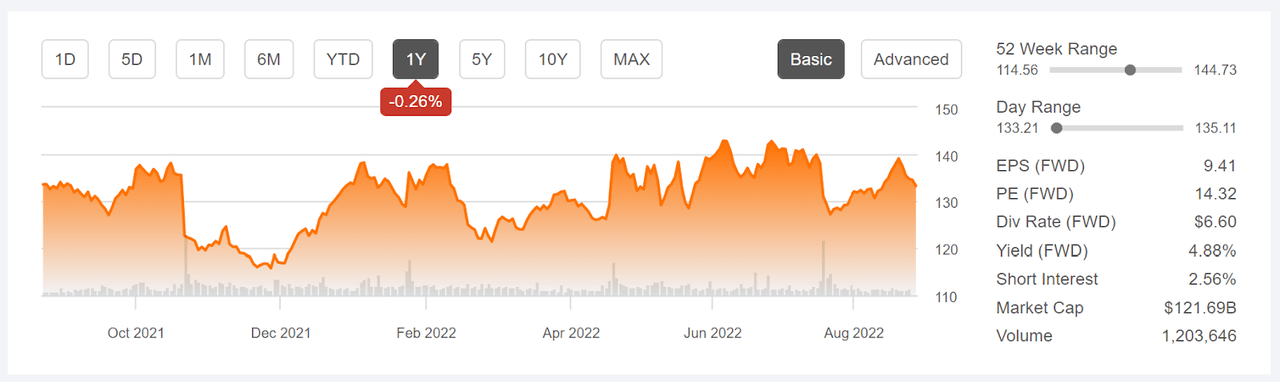
12-Month price history and basic statistics for IBM (Source: Seeking Alpha)
Rising interest rates tend to be more favorable for value stocks (like IBM) than for growth stocks. The net present value of growth stocks drops faster with rising rates because so much of the valuation depends on earnings that are expected to be realized further into the future. Over the past year, the iShares S&P 500 Growth ETF (IVW) has returned a total of -12% vs. -0.86% for the iShares S&P 500 Value ETF (IVE). This rate-driven rotation from growth to value has been a tailwind for IBM (IBM is the 30th largest holding in IVE).
IBM’s earnings have consistently beaten expectations in recent years, but always by small amounts. The combination of the first steps in transforming Big Blue with the economic disruptions from COVID makes it hard to see a growth trend. Earnings in Q1 of 2022 were lower than in Q1 of 2021 and 2020. The lack of a track record of consistent growth is largely why the company trades so cheaply relative to earnings, with a forward P/E of 14.3.
ETrade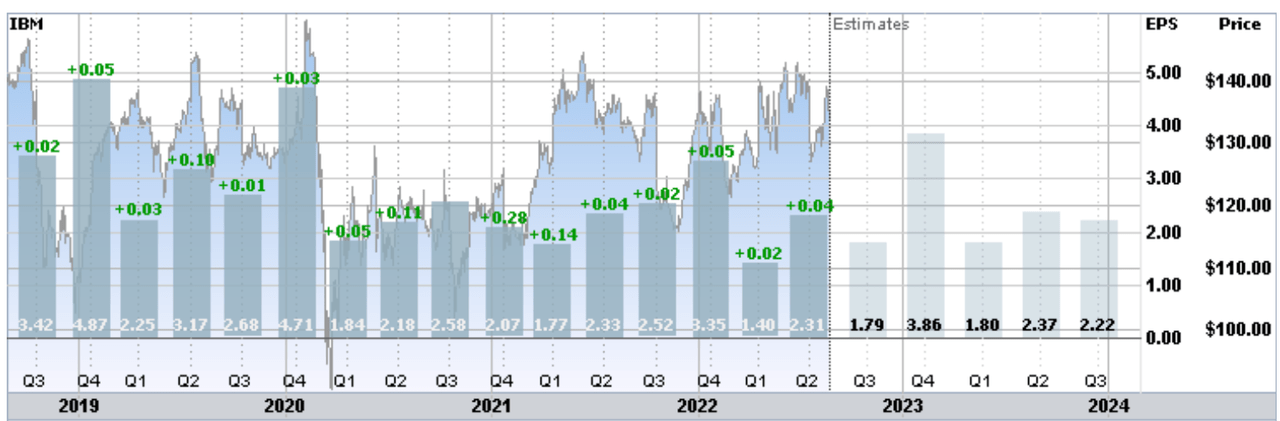
Historical (4 years) and estimated future quarterly EPS for IBM. Green values are amounts by which the EPS beat the consensus expected value (Source: E-Trade)
One of IBM’s notable features is the 4.9% forward dividend yield. It is important to note, however, that the dividend growth rate has been low in recent years. The 3- and 5-year annualized dividend growth rates are 2.6% and 3.5% per year, respectively.
I last wrote about IBM on December 23, 2021, 8 months ago, and I maintained my neutral/hold rating. My primary concern with IBM was that the company had not yet demonstrated that it could execute on its turnaround plan. The Wall Street analyst consensus rating on IBM was a buy, and the consensus 12-month price target implied a 12-month total return of 24.6%. The stock also looked cheap at that time, with a forward P/E of 12.6 and a forward dividend yield of 5.2%.
In analyzing stocks, I also consider the outlook implied by options prices (referred to as the market-implied outlook). In late December of 2021, the market-implied outlook to January of 2023 was slightly bearish. Considering the bullish Wall Street consensus outlook and the bearish market-implied outlook for 2022, I stuck with my neutral rating. Since the market close on December 23rd, IBM has returned +5.9% (including dividends), as compared to -11.5% for the S&P 500.
For readers who are unfamiliar with the market-implied outlook, a brief explanation is needed. The price of an option on a stock is largely determined by the market’s consensus estimate of the probability that the stock price will rise above (call option) or fall below (put option) a specific level (the option strike price) between now and when the option expires. By analyzing the prices of call and put options at a range of strike prices, all with the same expiration date, it is possible to calculate a probabilistic price forecast that reconciles the options prices. This is the market-implied outlook. For a deeper explanation and background, I recommend this monograph published by the CFA Institute.
Since my last post on IBM, the company has had 3 quarterly reports, each of which has slightly exceeded the consensus expectation for earnings. In addition, the interest rates have increased substantially. I have calculated updated market-implied outlooks for IBM and I have compared these with the current Wall Street consensus outlook in revisiting my rating.
Wall Street Consensus Outlook for IBM
E-Trade calculates the Wall Street consensus outlook for IBM using ratings and price targets published by 10 ranked analysts over the past 3 months. The consensus rating is a buy and the consensus 12-month price target is 10.9% above the current share price, implying a 12-month total return of 15.8%. The consensus price target was $155.16 back in December.
ETrade
Wall Street analyst consensus rating and 12-month price target for IBM (Source: E-Trade)
Seeking Alpha’s version of the Wall Street consensus combines the views of 19 analysts who have published ratings and price targets over the past 90 days. The consensus rating is a hold, and the consensus 12-month price target is 8.28% above the current share price.
Seeking Alpha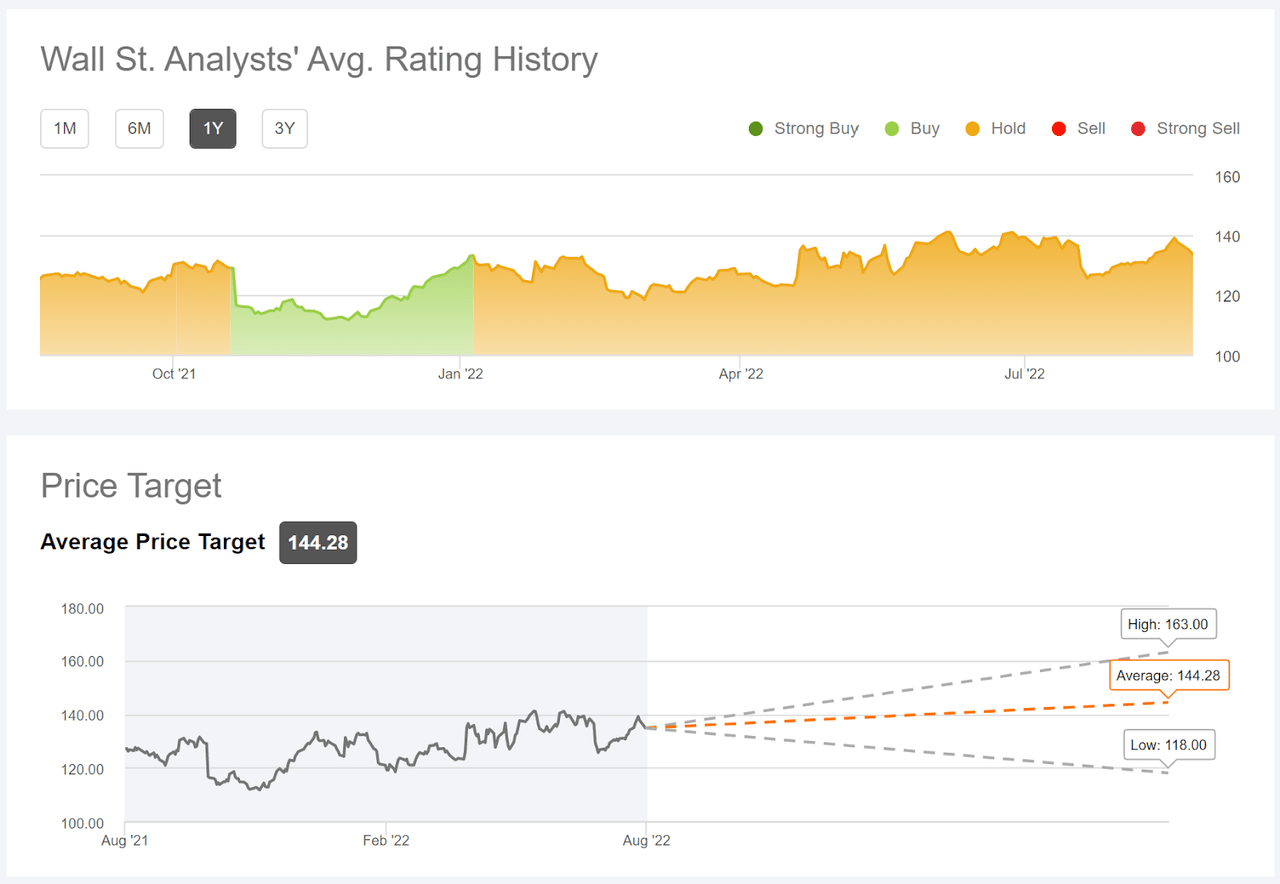
Wall Street analyst consensus rating and 12-month price target for IBM (Source: Seeking Alpha)
While E-Trade’s and Seeking Alpha’s calculation of the consensus rating on IBM differ, with a buy from E-Trade and a hold from Seeking Alpha), the consensus 12-month price targets are fairly close to one another. Averaging these two values results in an expected total return of 14.46% over the next year.
Market-Implied Outlook for IBM
I have calculated the market-implied outlook for the 4.9-month period from now until January 20, 2023 and for the 9.7-month period from now until June 16, 2023, using the prices of call and put options that expire on each of these dates. I chose these specific expiration dates to provide a view through the end of 2022 and to the middle of 2023, as well as because the January and June expiration dates tend to be among the most actively traded.
The standard presentation of the market-implied outlook is a probability distribution of price return, with probability on the vertical axis and return on the horizontal.
Geoff Considine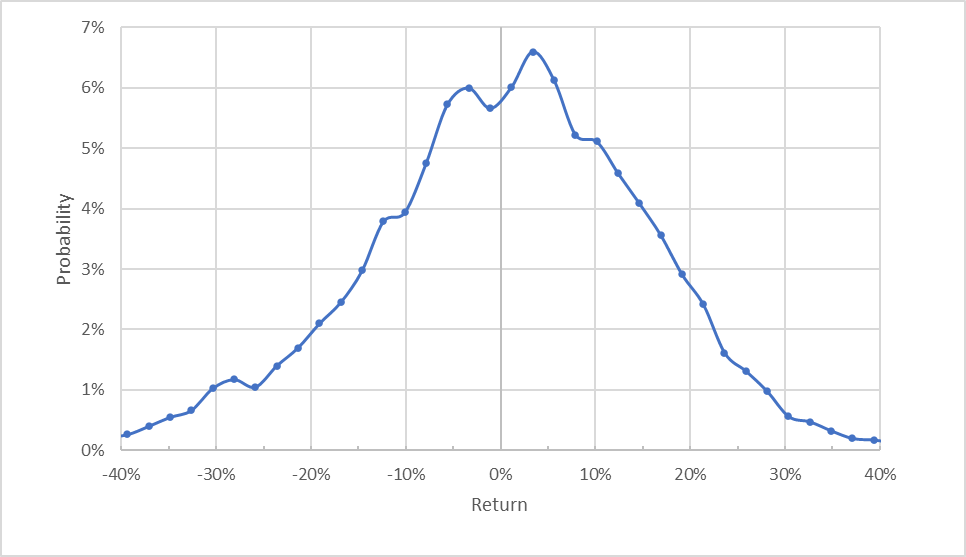
Market-implied price return probabilities for IBM for the 4.9-month period from now until January 20, 2023 (Source: Author’s calculations using options quotes from E-Trade)
While the market-implied outlook is generally symmetric, with comparable probabilities of positive and negative returns of the same size, there is a shift in the probabilities to favor positive returns. The maximum probability corresponds to a price return of 3.4%. The expected volatility calculated from this distribution is 25.8% (annualized).
To make it easier to compare the relative probabilities of positive and negative returns, I rotate the negative return side of the distribution about the vertical axis (see chart below).
Geoff Considine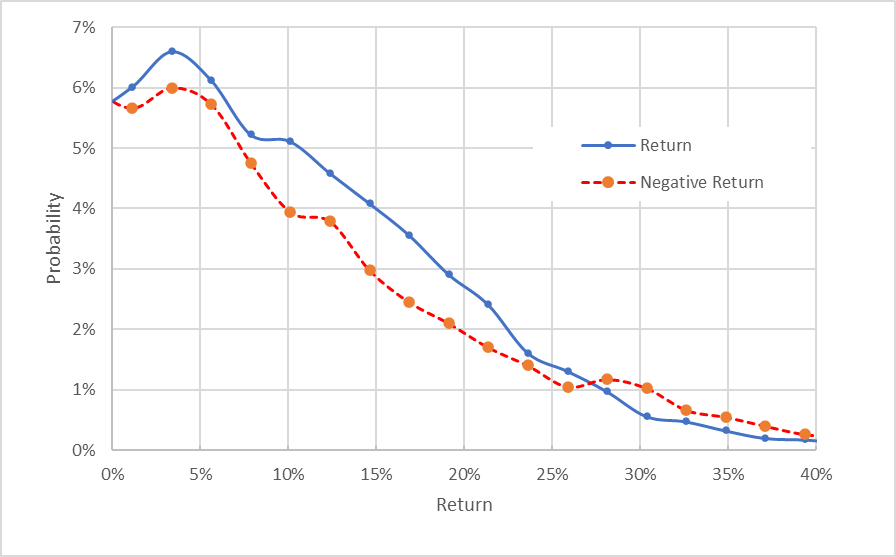
Market-implied price return probabilities for IBM for the 4.9-month period from now until January 20, 2023. The negative return side of the distribution has been rotated about the vertical axis (Source: Author’s calculations using options quotes from E-Trade)
This view shows that the probabilities for positive returns are consistently higher than for negative returns of the same magnitude, across a wide range of the most probable outcomes (the solid blue line is above the dashed red line over the left ⅔ of the chart above). This is a bullish outlook.
Theory indicates that the market-implied outlook is expected to have a negative bias because investors, in aggregate, are risk averse and thus tend to pay more than fair value for downside protection. There is no way to measure the magnitude of this bias, or whether it is even present, however. This potential bias reinforces the bullish interpretation of the market-implied outlook.
The market-implied outlook for the 9.7-month period to June 16, 2023 is also bullish, consistent with the shorter-term outlook. The expected volatility calculated from this outlook is 25.5% (annualized).
Geoff Considine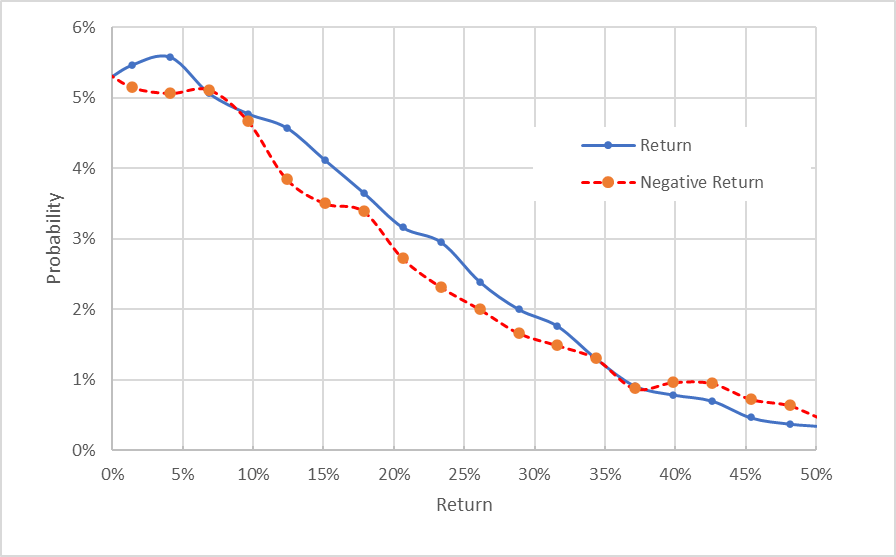
Market-implied price return probabilities for IBM for the 9.7-month period from now until June 16, 2023. The negative return side of the distribution has been rotated about the vertical axis (Source: Author’s calculations using options quotes from E-Trade)
The market-implied outlooks calculated using the prices of call and put options expiring in January and June of 2023 support a bullish outlook to the middle of the year. The expected volatility is stable and moderate.
Summary
IBM is going through a transformation that, it is hoped, will put the company on a growth trajectory. While the vision is compelling, the market has been waiting to see some traction. Recent quarters’ results are encouraging in this regard. Rising interest rates should continue to boost IBM. The Wall Street consensus outlook is somewhat positive, with the consensus rating at buy or hold, depending on the specific population of analysts.
The consensus 12-month price target implies a total return of 14.5% over the next year. While this is not a huge expected return, IBM is a fairly low-risk stock. As a rule of thumb for a buy rating, I want to see an expected return that is at least ½ the expected volatility (25.5%). Taking the consensus price target at face value, IBM meets this criterion. The market-implied outlooks for IBM to early 2023 and to the middle of 2023 are both bullish. I am changing my rating on IBM from neutral/hold to bullish/buy.
Be the first to comment