

Diego Thomazini
Written by Nick Ackerman, co-produced by Stanford Chemist. This article was originally published to members of the CEF/ETF Income Laboratory on November 5th, 2022.
Calamos Global Total Return Fund (NASDAQ:CGO) cut its distribution, and that saw the fund’s premium turn to a discount. Its sister fund, Calamos Global Dynamic Income Fund (CHW), had also cut its payout to shareholders. Both of these funds are globally focused funds, which have had weaker performance in the last decade. During a bear market, funds that require capital gains to fund their payouts are going to be at prime risk of distribution cuts.
CGO was one of those funds that I highlighted earlier this year as being at risk. That being said, the fund is still paying out an elevated distribution, and without some recovery in the broader markets, another cut is still likely. On the other hand, as the fund has slumped to a discount, it could be more appealing overall, but I still think it could be too early to buy aggressively.
The Basics
- 1-Year Z-score: -1.68
- Discount: -4.79%
- Distribution Yield: 10.50%
- Expense Ratio: 1.76%
- Leverage: 31.34%
- Managed Assets: $137.185 million
- Structure: Perpetual
CGO will “seek total return through a combination of capital appreciation and current income.” The way they attempt this is; “by investing in a globally diversified portfolio of equities, convertible securities and high-yield corporate bonds.” Generally, equity positions are the largest allocation of the fund. That’s followed by a material allocation to convertibles and then corporate bond exposure to a lesser degree.
The fund is small and only looking set to get smaller in this current environment. To keep the fund over $100 million in total assets requires a fair bit of leverage. However, during bear markets, it can mean deleveraging. That is exactly what CGO has experienced.
CGO Fund Data (Calamos)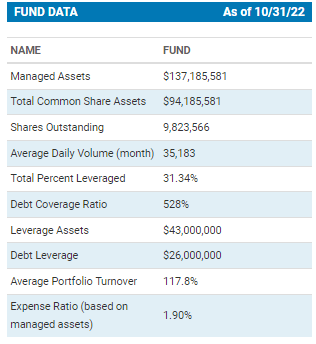
They took leverage down from $48 million to $43 million. This was another decrease from earlier this year, when they took borrowings down from $50.5 million at the end of April 2022.
The fund utilizes both a fixed and variable rate form of leverage. They can take out borrowings on a variable rate of OBFR plus 0.80%. That’s currently $26 million, so they’ve reduced their outstanding borrowings by almost half for this year.
The other portion is the fixed rate Mandatory Redeemable Preferred Shares. They had $21 million at the end of April 2022 of these outstanding, but $4 million was redeemed in September. So that portion wasn’t a forced deleveraging but simply a preferred getting to the end of its life. That has left us with $17 million. ($17M plus $26M gives us the current $43M in leverage total.)
CGO Preferred Leverage (Calamos)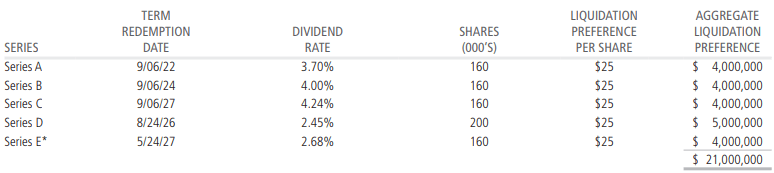
Most of their leverage is at a variable rate, meaning that higher interest rates will negatively impact the fund since the costs of leverage will rise. In a bear market, that’s not a good combination of higher costs but lower expected returns.
Performance – Discount After Cut
The performance of the fund historically hasn’t been anything too spectacular. Of course, 2022’s performance alone is dragging down the results of all the annualized periods since it is having such a drop.
CGO Annualized Returns (Calamos)
Compared to CHW, the performance between these two on a YTD basis is almost identical. I’ve also included Calamos Strategic Total Return (CSQ). This fund has a similar asset allocation but focuses on U.S.-based investments instead.
To provide the further context of the performance, I’ve also included the S&P 500 ETF (SPY) and the iShares Convertible Bond ETF (ICVT). These are non-leveraged barometers of the broader large-cap U.S. equity market and the convertible space’s performance. With a much further drop in the Calamos funds, I think it’s safe to say we are seeing the ramifications of leverage play out.
Ycharts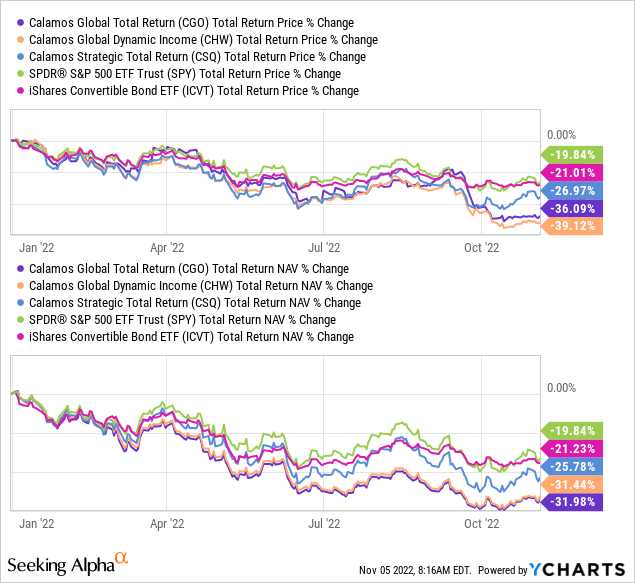
A silver lining here is that investors wanting to invest in CGO, despite the risks, could consider doing so at a more attractive valuation. My previous article’s headline was “Premium Rises Amid Portfolio Declines.” That’s the opposite of what you want to see if you are a CEF investor.
When the distribution cut came, the fund fell back to a discount. Historically, the fund has traded close to parity with the NAV. However, we are in a very different environment now. Investors were also likely bidding this fund up because it had a high yield and only one distribution cut in its history.
Ycharts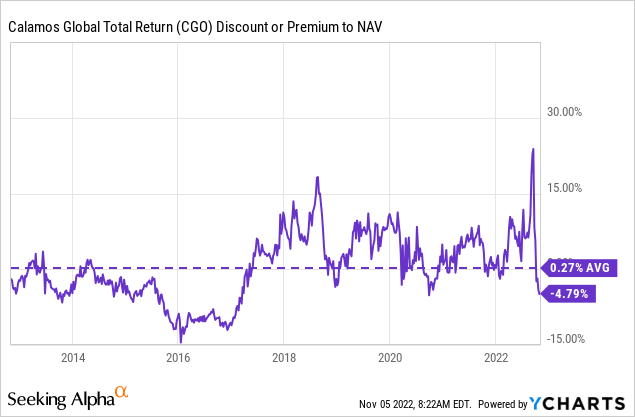
In my opinion, at least, I think that the discount could open up even further. So I wouldn’t be overly aggressive with initiating a large position.
Distribution – Possibly More To Come
We discussed previously at length the distribution coverage and how weak it was. There has been no new report until the annual report comes out. That should happen in late December. However, we do know that the fund has been deleveraged twice since the last report. At that time, they produced no net investment income to fund the distribution.
CGO Semi-Annual Report (Calamos)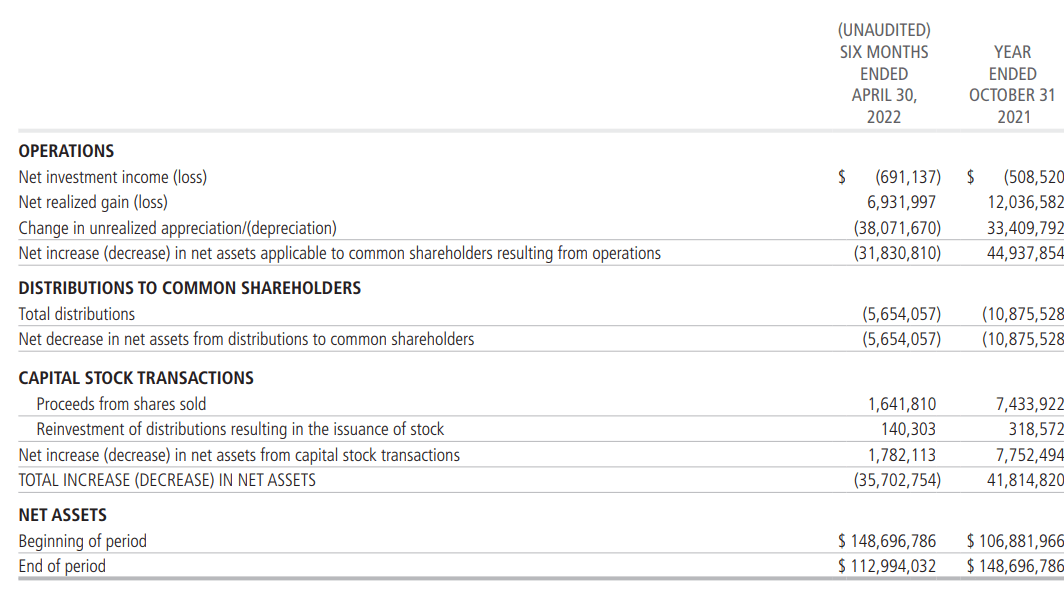
This was driven by the “(Amortization)/Accretion of investment securities” due to the convertible bonds in the portfolio. Even factoring that out, NII was only slim. After deleveraging, there is likely to be no NII again in the next report if I had to take a guess.
Therefore, with no or a significant lack of NII and likely further pressure to find capital gains, another cut could come. The fund’s distribution rate is 10.50% for shareholders, but it is also at that 10% level on a NAV basis. It is really hard to achieve 10% in this type of environment.
The longer they run a destructive payout, the harder and harder it becomes to sustain. At the same time, they know if they slash the payout by 50%, investors will flee even faster. It definitely is a balancing act.
So without a quick recovery in the market, we may see another trim. This was after a tremendous run on the fund paying out a consistent distribution to shareholders since the GFC.
CGO Distribution History (CEFConnect)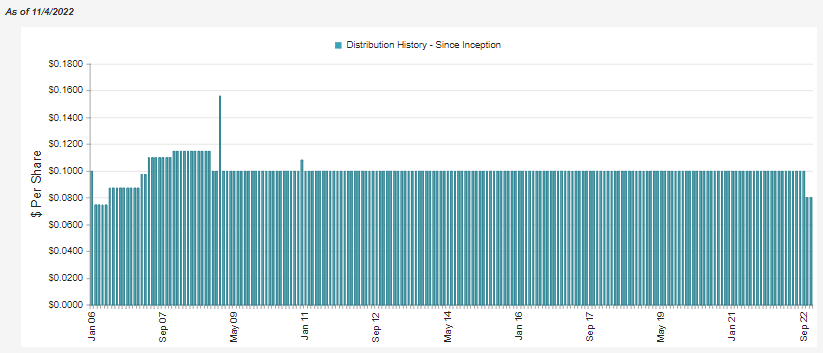
One interesting chart that Calamos provides for its funds is the cumulative distribution history. It shows us the fund’s total distributions since inception was $20.342. The fund launched with a NAV of $14.30, meaning it has earned and paid out the entire original amount of capital raised plus a significant amount. Not to mention that the NAV is most definitely not $0 today, so it is still kicking.
CGO Cumulative Distributions (Calamos)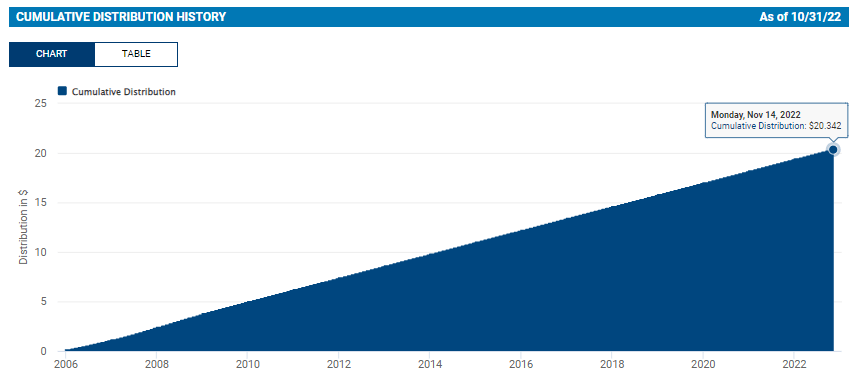
CGO’s Portfolio
The fund is primarily invested in equity positions, over 50% of the fund. Following this is the significant tranche of convertibles, and then corporate bonds also make up a meaningful allocation of the fund.
CGO Asset Allocation (Calamos)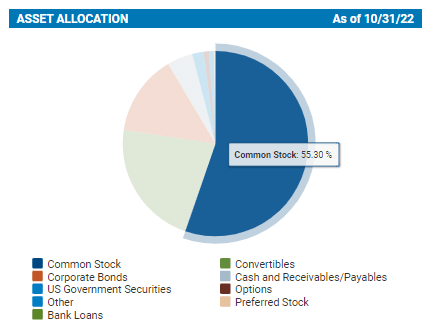
With an allocation to bonds, they provide a weighted average duration figure of 2.3 years. That means for every 1% interest rate rise, the expected decline in the underlying bond portfolio is 2.3%. With rates rising to almost 4% and expected to go higher, that’s a drag on the performance. They might not realize those losses, but it reduces the size of their portfolio due to unrealized depreciation.
Although that doesn’t mean the actual interest earned on those bonds is any less. Unfortunately for CGO, they invest in a significant portion of convertible bonds. The yield on these is quite minimal, and even a fair bit is 0% that were issued in 2020 and 2021.
The largest allocation of their bonds is rated as “Unrated Securities.” This is typically due to the convertible bonds often not getting rated. Convertible bonds are often issued to qualified institutional buyers or QIBs. They will often have their internal rating system. Therefore, the company can issue unrated convertibles faster and cheaper without the costs of going to a rating agency.
CGO Credit Quality (Calamos)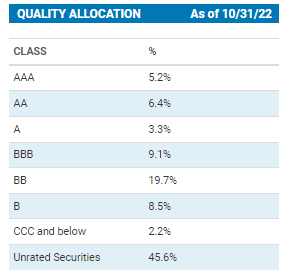
Otherwise, the credit quality is fairly split between investment-grade and below-investment-grade bonds.
For sector allocations, tech makes up the largest weighting. This is also fairly common in the market as it was what was working over the last decade. The next decade might differ, but many funds still mimic the S&P 500 weightings. Although, the S&P 500 is still even more overweight tech than something like CGO. CGO is fairly diversified if we compare it to the S&P 500 and its 25.42% weighting in tech.
CGO Sector Weighting (Calamos)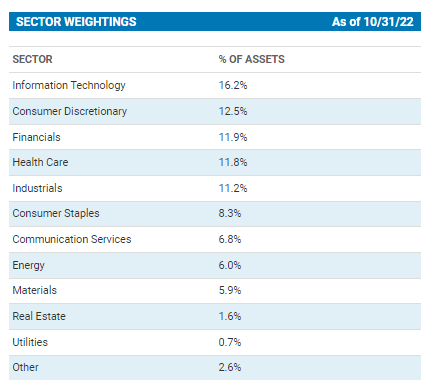
Diversification is also a theme in the fund’s holdings. If we look at the top ten holdings, the highest allocations are to a Ford (F) convertible and Alphabet (GOOG) (GOOGL). These are at 2.3% and 2.2% weightings, respectively.
After that, there is no position that makes up more than 2% of the portfolio. The entire top ten come out to a 17.9% weighting. According to CEFConnect, the fund carried 691 positions at the end of August 2022.
CGO Top Ten (Calamos)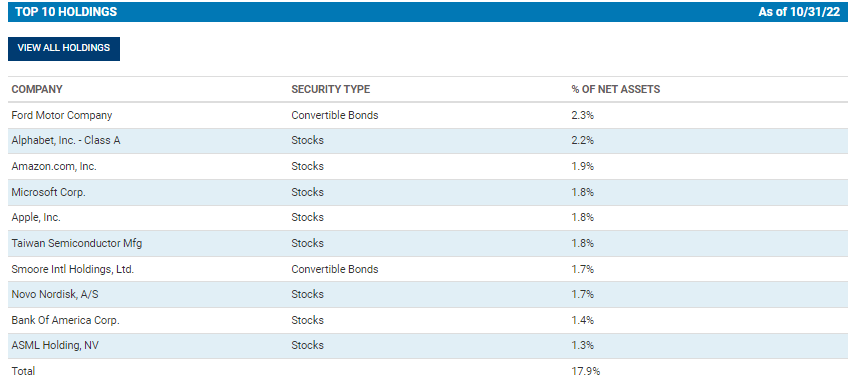
That convertible from Ford is an example of a 0.00% coupon convertible. It matures on March 15th, 2026.
Conclusion
CGO might be a better-valued CEF at this time after the distribution cut. However, given the current environment, the distribution could still be hard to sustain. That could mean a further distribution cut, barring any recovery in the market. An additional cut will likely have less of an impact on the valuation than the first. However, it could still pressure the fund as the discount isn’t necessarily a huge bargain.
Be the first to comment