

STOCK MARKET OUTLOOK
- S&P 500 begins the week on a positive note ahead of major risk events in the coming days
- The U.S. midterm elections will take center stage on Tuesday, but the October U.S. inflation report will steal the limelight on Thursday
- For risk appetite to rebound in a meaningful way, CPI must show convincing signs of slowing down
Trade Smarter – Sign up for the DailyFX Newsletter
Receive timely and compelling market commentary from the DailyFX team
Subscribe to Newsletter
Most read: S&P 500 Forecast – US Inflation Data Could Make or Break the Market
After struggling for direction for much of the session, U.S. equities pushed higher in late trading despite cautious sentiment ahead of high-impact events in the coming days. At the market close, the S&P 500 advanced 0.96% to 3,807, bolstered by a strong rally in telecommunication and energy stocks. Meanwhile, the Nasdaq 100 jumped 1.11% to 10,977, but higher yields across the curve appeared to cap its gains.
Looking ahead, all eyes will be on the U.S. midterm elections on Tuesday, where the Democratic party is expected to lose control of Congress, with recent polls suggesting Republicans could win a majority in the House of Representatives and possibly the Senate.
While a divided government could lead to political stalemate and paralyze President Biden’s agenda for the remainder of his term, this may not necessarily be bad news for stocks, as the Fed could attempt to offset economically damaging gridlock with a less hawkish stance. For this reason, it would not be surprising if a shift in the balance of power in Washington provoked a bullish reaction on Wall Street.
The calendar lightens on Wednesday, but Thursday brings a very important economic release: the October U.S. inflation report. Headline CPI is expected to have risen 0.6% m-o-m, bringing the annual rate to 8.0% from 8.2% in September. Meanwhile, the core gauge is seen clocking in at 0.5% m/m and 6.5% y/y.
For the mood to improve and risk appetite to rebound in a meaningful way, we need to see a convincing deceleration in price pressures. On the other hand, if data surprises to the upside as in previous months, FOMC terminal rate expectations will drift higher, pushing up bond yields and creating a more hostile environment for the equity market. This scenario could trigger the next leg lower for the S&P 500.
Recommended by Diego Colman
Get Your Free Equities Forecast
S&P 500 TECHNICAL ANALYSIS
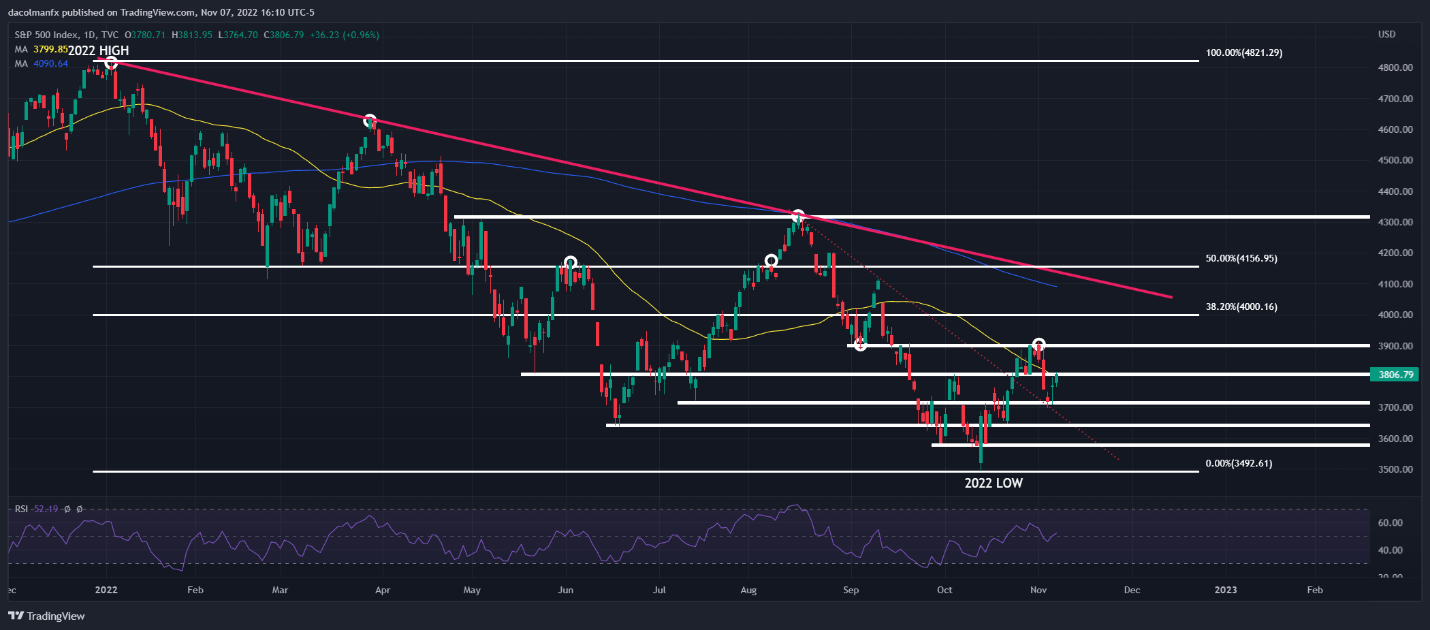
After the recent rebound, the S&P 500 has reclaimed the psychological 3,800 level and its 50-day simple moving average, a constructive development from a technical standpoint. If buyers continue to push prices higher over the coming days, the next resistance to keep an eye on appears around the 3,900 area. On further strength, the focus shift to 4,000, the 38.2% Fibonacci retracement of the 2022 sell-off. In case of a pullback, support sits at 3,720, followed by 3,640.
| Change in | Longs | Shorts | OI |
| Daily | 10% | 10% | 10% |
| Weekly | 16% | -15% | 1% |
S&P 500 TECHNICAL CHART
EDUCATION TOOLS FOR TRADERS
- Are you just getting started? Download the beginners’ guide for FX traders
- Would you like to know more about your trading personality? Take the DailyFX quiz and find out
- IG’s client positioning data provides valuable information on market sentiment. Get your free guide on how to use this powerful trading indicator here.
—Written by Diego Colman, Market Strategist for DailyFX
Be the first to comment