

Torsten Asmus
Thesis
CF Industries (NYSE:CF) just reported its Q3 results last week. And another bellwether fertilizer stock, Mosaic Company (NYSE:MOS), is scheduled to report its Q3 results on November 7. In the past few quarters, both stocks have been benefiting from the high pricing environments in the fertilizer sector. Several macro forces drove selling prices to historically high levels. These forces include the global food supply shortage created by the Russian/Ukraine situation, limited exports out of Belarus and China, and also the ongoing global supply chain disruptions.
All told, CF reported revenue Q3 growth at a spectacular 70% YOY to $2.32B. Its Q3 GAAP EPS came in at $2.18, widely missing consensus estimates by $1.32. Although I won’t be too concerned about such a miss. As to be argued in the remainder of this article, GAAP EPS is a poor measure of owners’ earnings for commodity-type businesses like MOS and CF. Dividends are a much better measure. As another example, the company also announced a new $3B share buyback program, as a show of its earning strength.
As a preview for MOS’ Q3 earnings report (“ER”) on November 7, I expect it to keep riding the surge in agricultural commodities pricing too. In its Q2 report, its Phosphate and Potash units reported $720 million and $940 million gains from pricing tailwinds, respectively. Such gains were more than enough to offset lower sales volumes caused by supply chain disruptions and geopolitical conflicts. I expect similar benefits during Q3 from the record agricultural commodity prices. Furthermore, I will expect its earnings to be bolstered by optimizations in the Brazil Fertilizante business and K3 potash mining ramp-up. All told, consensus estimates project an EPS of $2.72 for Q3, more than double the EPS of $1.35 reported in Q3 of 2021. I share the optimism given the robust pricing environments.
Although from these above numbers, you can see that the GAAP earnings of these commodity-type stocks fluctuate widely. And hence, it is my view that GAAP EPS is a poor measure of their long-term economic earning potential. The GAAP EPS is too sensitive to a wide range of parameters that only create short-term noises (and we will analyze a few of them in the risk section later). And the remainder of this article will use their dividends as a more reliable metric to evaluate their business fundamentals.
Dividends do not lie
I recently re-read Geraldine Weiss’ classic, Dividends Don’t Lie, first published in 1988 (i.e., more than 3 decades ago). If you have not read it yet, I recommend it without any reservations. The book describes the use of a dividend-yield chart as an effective tool for analyzing an owner’s earnings in the long term. The chart below shows an example of Allied Signal, a stock from that era with large price volatilities yet steady dividend growth (kind of CF and MOS). Here is a brief (probably too brief to do justice) summary of the main ideas behind the chart:
First, always be value-oriented and dividends are the most reliable value metric (hence the title of the book). As to be seen later, dividends provide a more reliable way to hack into a firm’s owners’ earnings.
Second, always allow some error of margin. As you can from the dividend-yield plot, the valuation band is quite wide even for a prominent company like Allied Signal at that time. The band spans a factor of 2x for Allied Signal with a 3.5% yield being the overvaluation line and 7% being the undervaluation line. And later you will see that band is even wider for CF and MOS. In cases like this, it is always better to be approximately right (or directionally right) than precisely wrong.
Next, we will apply these concepts to analyze MOS and CF in more detail. And my overall conclusion is that currently, their valuations are quite high and the positive catalysts have already been priced in, especially in the case of CF.
Source: “Dividends Don’t Lie”, Geraldine Weiss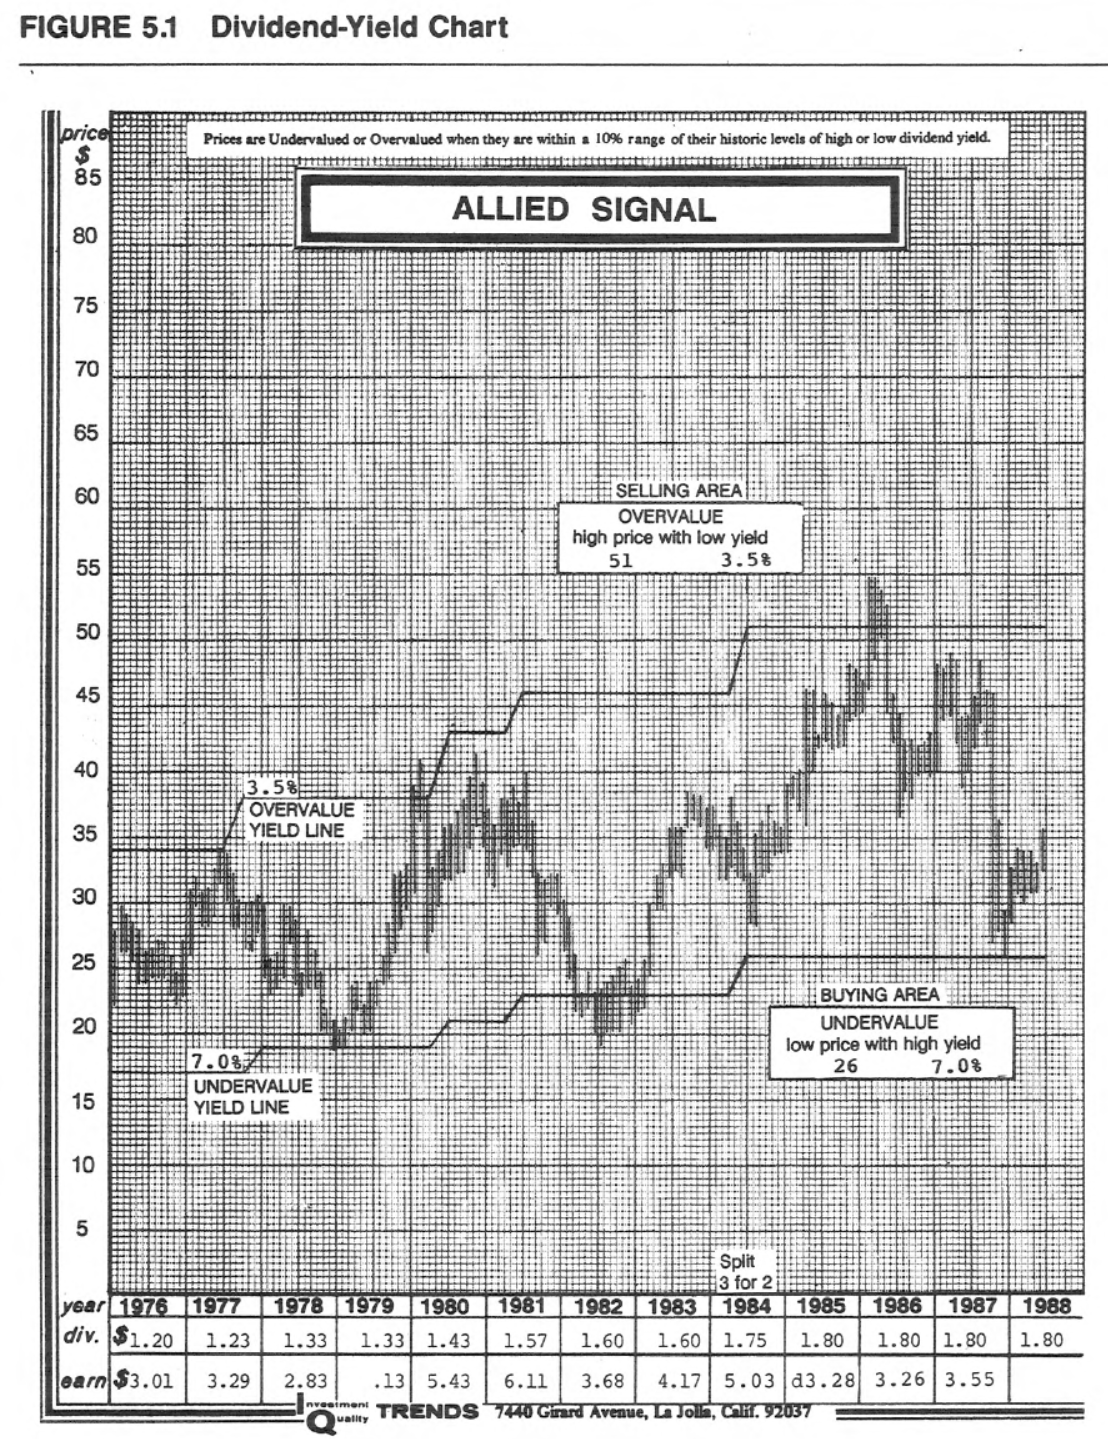
MOS and CF’s dividend yield charts
These days, we do not plot (largely because we do not need to) the dividend-yield chart in the same way chart as Weiss did back 30 years ago. Thanks to new technologies, the dividend-yield chart I routinely plot has transformed into the figures shown below. These figures contain identical information as Weiss’ original charts, but in a different format that displays the key information more visually.
We can easily see the bands of extreme undervaluation and overvaluation from these figures. To wit, for MOS, its yield peaked at 3.8% in 2018, indicating extreme undervaluation. And at the extreme of the overvaluation band, its dividend yield decreased to as low as 0.27% in 2019. And note that the band spans more than 14x here, highlighting the importance of a margin of safety here. Its current dividend yield of 0.99% is a bit higher than its long-term average of 0.92% (by about 8% in relative terms). However, given the width of its yield band, it is sufficient to just interpret this as a lack of margin of safety.
For CF, its yield peaked at 5.68% in 2020, again indicating extreme undervaluation. And currently, its dividend yield of 1.33% is close to the level of extreme overvaluation of 1.09%.
Source: Seeking Alpha data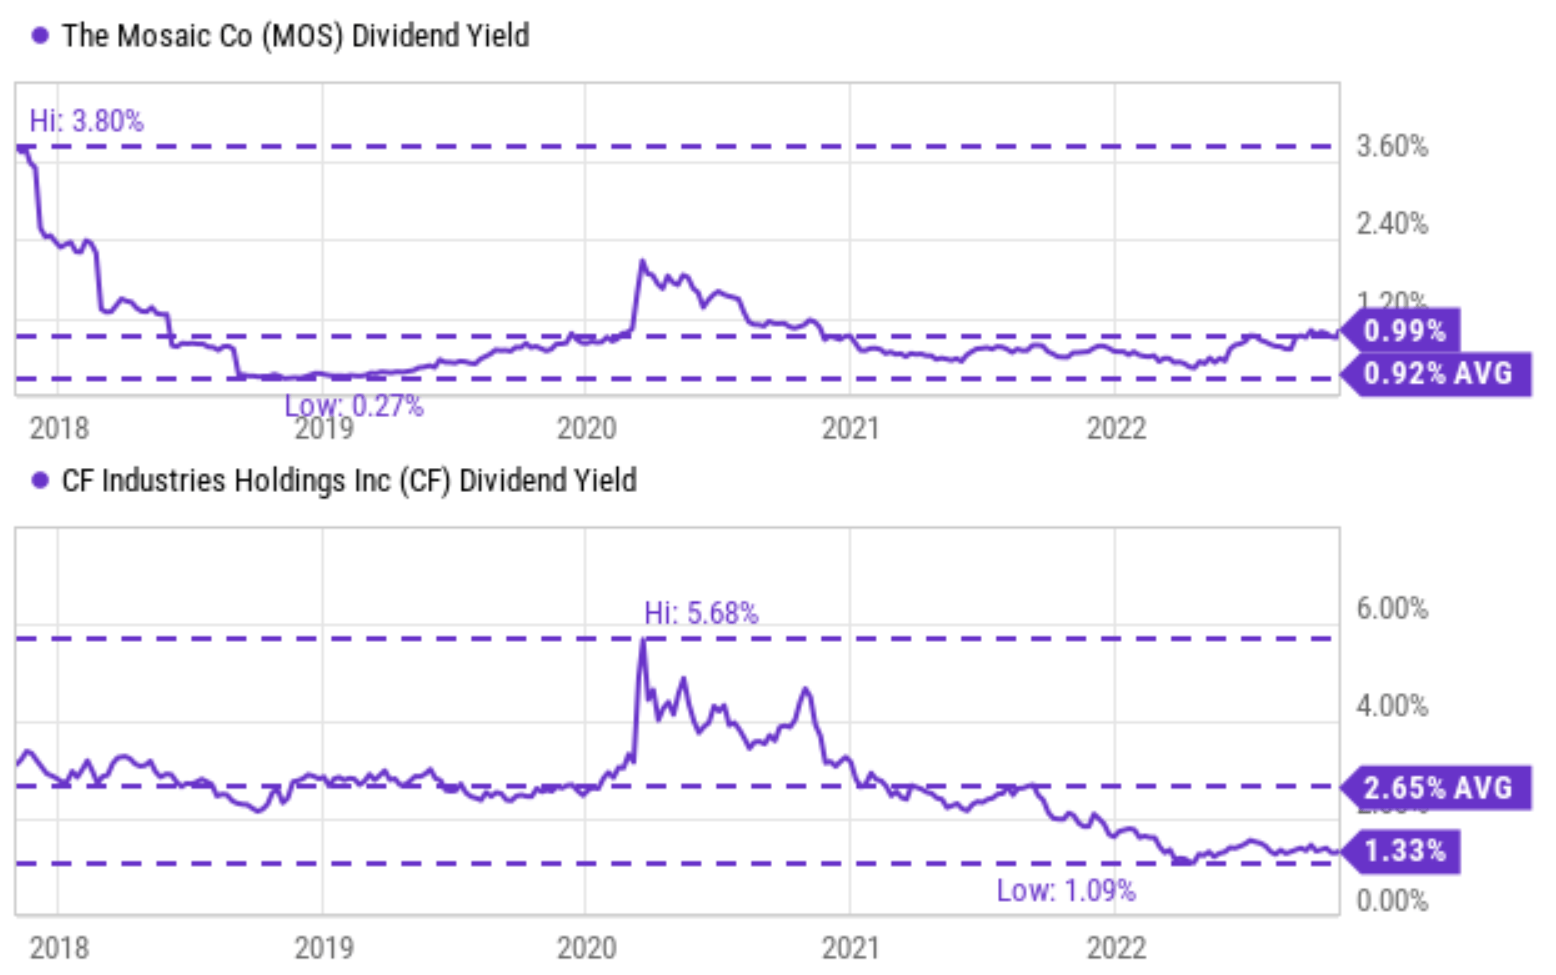
MOS and CF: Dividend safety at peak level though
On the positive side, their current financial strengths and dividend safety are near a multi-year peak too, partially offsetting their valuation premium.
As you can see from the top panel of the following chart, MOS’ interest coverage is currently at 28.3x. Historically, it has earned an average of 4.97x of its interest expenses. Its current level is not only strong in relative terms (more than 5.6x better than its historical average) but also in absolute terms (28.3x coverage ratio means it only takes less than 4% of its earnings to service its debt).
The picture for CF is very similar as shown in the bottom panel. CF’s interest coverage is currently at 12.2x, again at the peak level of its historical record since 2018. It has earned an average of 4.62x of its interest expenses in past (quite compatible with MOS’s 4.97x). And its current level is also not only far stronger relative to its own historical record (by a factor of almost 3x) but also strong in absolute terms (12.2x coverage ratio means it only takes less than 8% of its earnings to service its debt).
Source: Seeking Alpha data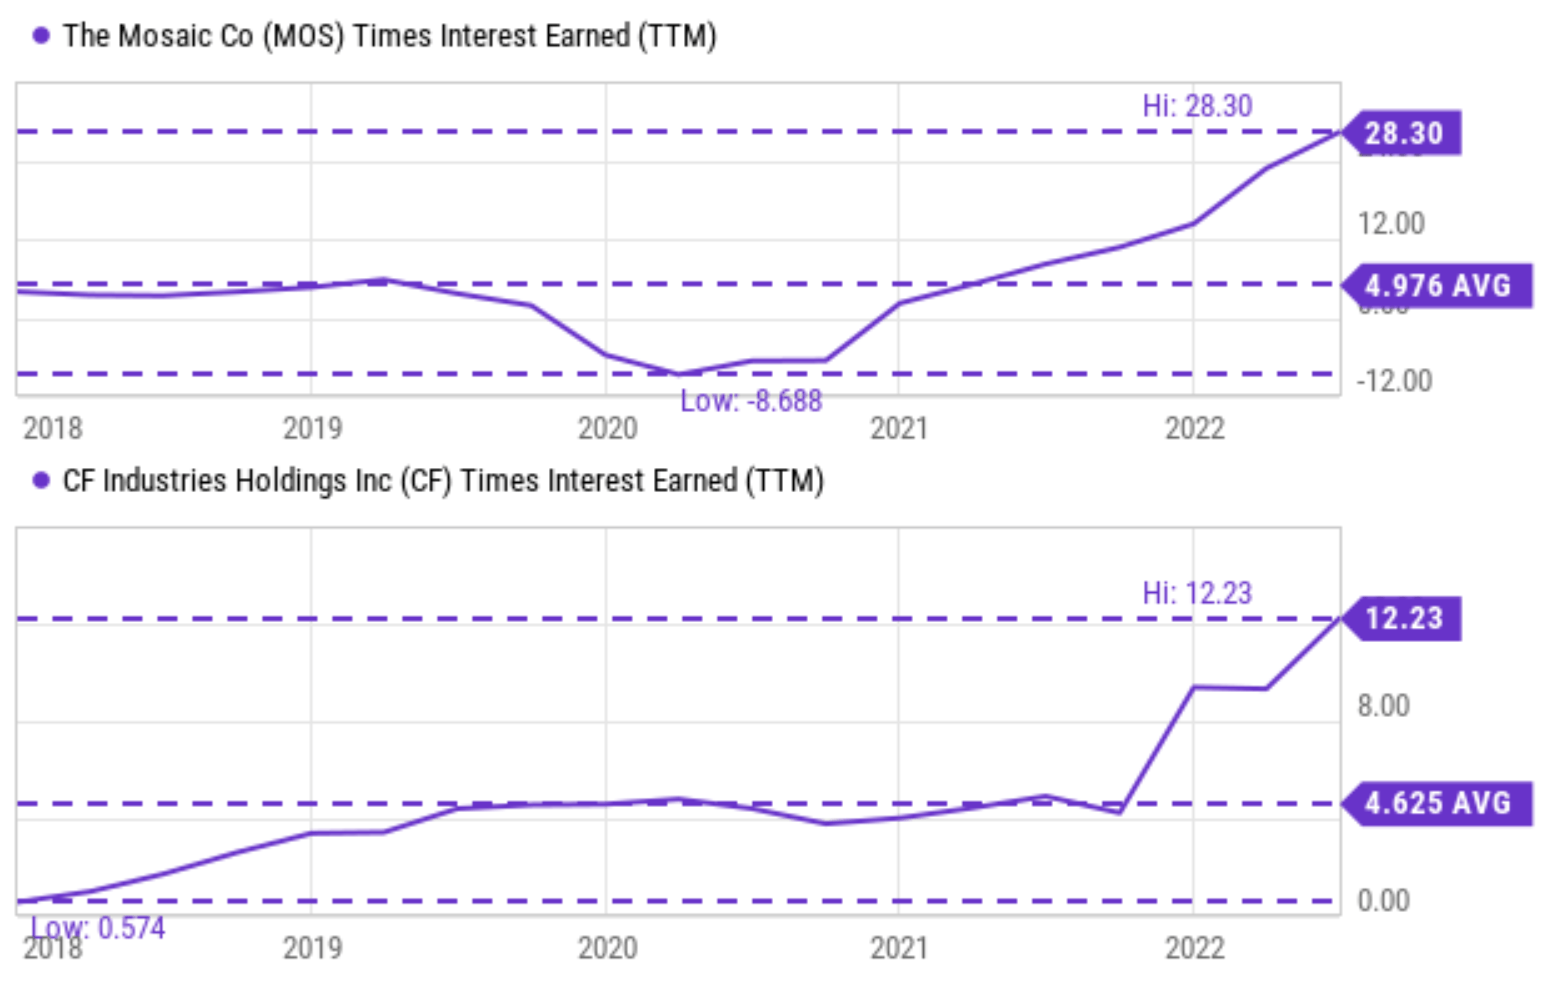
Their current dividend safety is also reflected in the extremely low payout ratios as you can see from the following chart. In the top panel, you can see that the payout ratio (“PR”) for MOS is currently about 11.5%. To put things under historical perspective, its PR has fluctuated between 182% and -38% with an average of 36.6%. Therefore, its PR is again not only much better relative to its historical average but also extremely safe in absolution terms.
The picture for CF is quite similar (and actually even stronger because of its better consistency) as seen in the bottom panel. CF’s PR fluctuated in a much narrower range of 11% and 28% with an average of 22.6% since 2008. Its current PR of 11% is at the safest level and is only about ½ of its historical average.
Source: Seeking Alpha data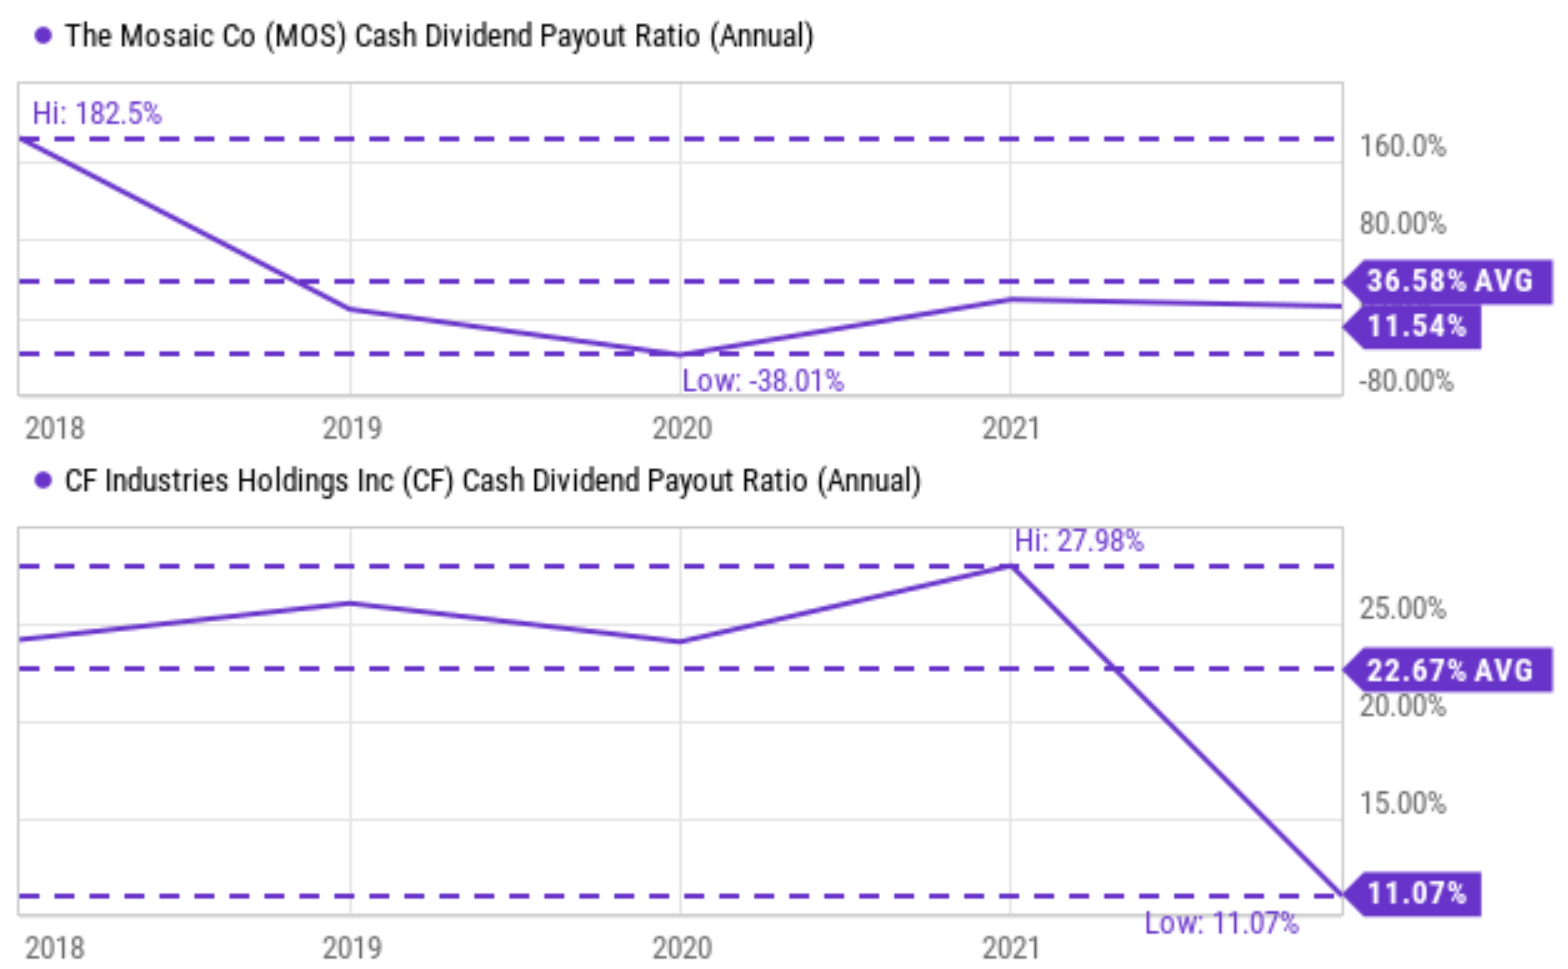
Risks and final thoughts
Despite the strong tailwinds mentioned above (mainly strong agriculture commodity pricing environments), both companies are also experiencing high commodity and energy costs themselves. In CF’s Q3 ER, its reported natural gas costs are almost 200% higher than in the same period last year ($8.35 per MMBtu vs. $4.21 per MMBtu in Q3 of 2021). As a matter of fact, earlier this year, one of its subsidiaries (CF Fertilisers UK) announced its plan to temporarily halt ammonia production at its Billingham facility. The reason is that at current natural gas and energy prices, the subsidiary’s ammonia production is uneconomical.
All told, the market currently expects robust pricing for agriculture products to continue, which I tend to agree with. I further agree that such robust pricing can support strong earnings over the near-term (for example, recall that the consensus estimates projected MOS’ Q3 EPS to more than double YoY).
However, my overall impression is that these positive catalysts have been fully priced in already. Judging by their dividends (which is a much better metric for owners’ earnings than EPS), MOS’ current valuation is on the overvalued side and offers no margin of safety at all. And for CF, its dividend yield of 1.33% is close to the level of extreme overvaluation in its recent history. Even their record financial strength and dividend safety could not make up for such a valuation premium the way I see it.
Be the first to comment