Darren415
This article was first released to Systematic Income subscribers and free trials on July 17.
Welcome to another installment of our CEF Market Weekly Review where we discuss CEF market activity from both the bottom-up – highlighting individual fund news and events – as well as top-down – providing an overview of the broader market. We also try to provide some historical context as well as the relevant themes that look to be driving markets or that investors ought to be mindful of.
This update covers the period through the second week of July. Be sure to check out our other weekly updates covering the BDC as well as the preferreds/baby bond markets for perspectives across the broader income space.
Market Action
CEFs were pretty flat this week as the rally in Treasuries was offset by a modest fall in equities. Most sectors remain in the green so far in July as the market continues to recover from its terrible June.
Systematic Income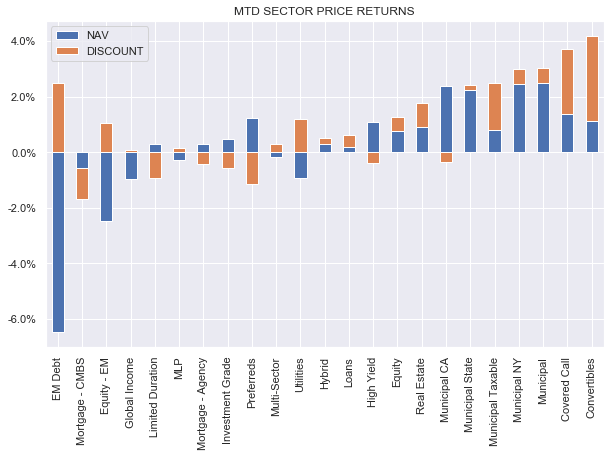
The July total CEF market return of around 1% is a small start to reversing the nearly 6% fall that we saw in June. Interestingly, discounts have been very resilient and are tighter for the third month in a row despite weak NAV performance.
Systematic Income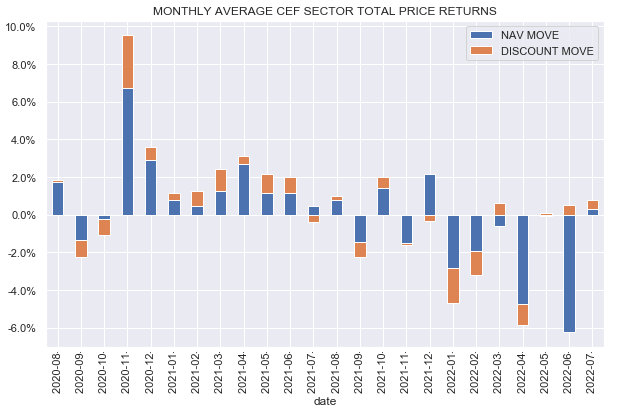
On a longer-term horizon fixed-income CEF discounts remain fairly-valued but not outright cheap while equity CEF sector discounts are expensive.
Systematic Income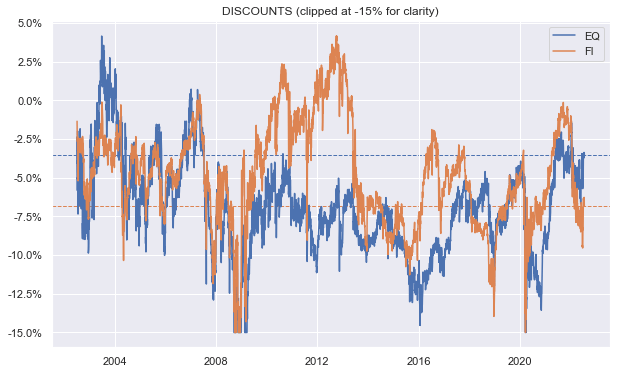
The beta of fixed-income CEFs to stocks has fallen substantially in the last couple of weeks – an outcome that is likely driven by the fact that Treasuries and equities have started to offset each other’s moves, diversifying their impact on fixed-income CEFs. Equity CEF beta remains elevated as it doesn’t benefit from the recent diversification provided by Treasuries.
Systematic Income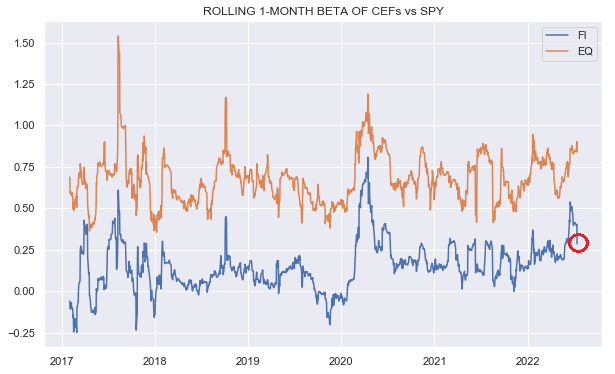
A quick look at CEF sector valuation table from our CEF Tool shows that the average sector discount is an unimpressive 3.2%. Some sectors that look appealing on a 5Y z-score or discount percentile basis such as preferreds or multi-sector funds don’t look great on an absolute discount basis – the average preferred CEF discount is just 2.4% and the average multi-sector CEF discount is just 2.7%. That said, there is wide variation within the sectors but it’s hard to say that the aggregate valuation picture in CEFs is great. If the consensus is correct and most of the macro pain is well ahead of us, CEF valuations will likely be more attractive over the next 3-6 months.
Systematic Income CEF Tool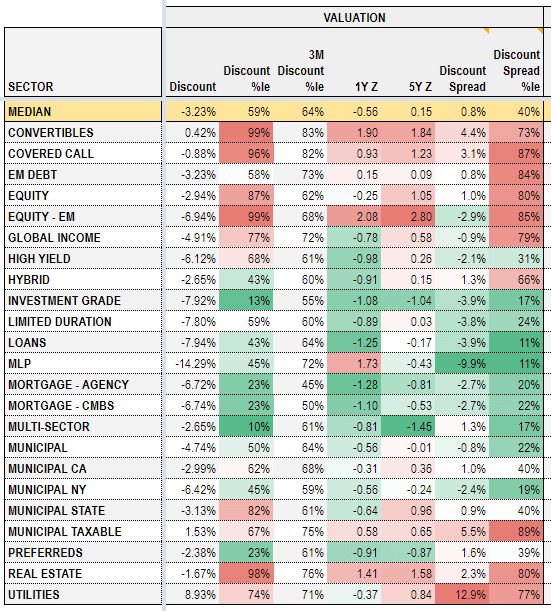
Market Themes
We have recently come across a number of investors who consider allocating to leveraged CEFs a mistake in the current environment of rising leverage costs. And while it’s true that rising leverage costs can lower the income profile of leveraged fixed-income CEFs and lead to distribution cuts. However, it’s important not to lose sight of the bigger picture. Specifically, because underlying asset yields have increased sharply this year, the increase in CEF yields from the start of the year significantly exceeds the rise in leverage costs over the same period and will do so at the likely peak in the Fed policy rate.
The following chart shows that for a typical high-yield corporate bond CEF, the increase in asset yields of 4.4% (in effect, this is the rise in the high-yield corporate bond index yield-to-worst since the start of the year) is close to double the increase in leverage costs so far this year. The picture in tax-exempt bonds is not as stark but the direction is similar.
Systematic Income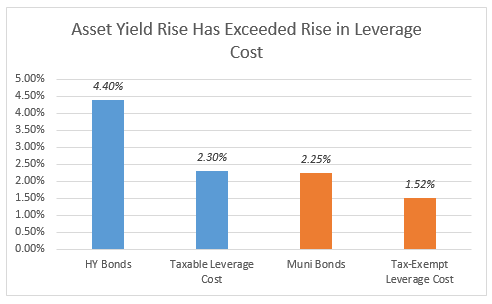
And in fact, the argument highlighted above is exactly backwards. One would think that when leverage costs were at their rock-bottom levels (roughly 1% for taxable CEFs i.e. Libor + 0.85% or so at the end of 2021) taxable CEFs were a great buy, however, that is not correct.
The basic breakdown, using high-yield corporate bonds, is as follows.
Systematic Income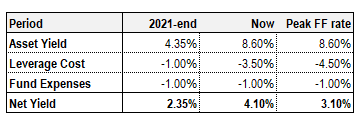
At the end of 2021 high-yield corporate bond yields were around 4.35%. This means that our hypothetical HY CEF earned 4.35% on its leveraged assets less leverage cost of 1% (Libor + 0.85% or so) less fund expenses of around 1%, leaving 2.35% going to the investor on the leveraged portion of the fund.
Now, high-yield corporate bond yields are 8.6% and Libor is around 2.5%. This results in about 4.1% going to the end investor.
At their peak, leverage costs are expected to be around 4.5% (i.e. when Libor rises to 3.5% or about 1% above current levels). With the management fee we get to a number of 3.1% going to the end investor at the likely peak Fed Funds policy rate – still well above the figure at the end of 2021.
However, things are even better for CEF investors today. First, leverage is higher as asset prices have fallen (mechanically a drop in asset prices raises the fund’s leverage unless borrowings fall as well i.e. unless the fund deleverages). This means that the leveraged portion of the fund generates even more relative to the fund’s net assets than it did at the end of 2021, all else equal.
And two, discounts are wider which allows CEFs to now generate even more yield at their price level. Taking all these factors into account what we see is that our hypothetical HY CEF (which holds the high-yield corporate bond market) generates a yield that is more than twice that of the end of 2021.
The key takeaway here is that investors need to keep the bigger picture in mind rather than use the well-worn heuristics of the income market in order to make the right allocation decisions in the current environment.
Market Commentary
The Saba Capital Income & Opportunities Fund (BRW) released its shareholder report. The fund took over from a Voya loan CEF and sold all of its loan positions in 2021 which was not a crazy thing to do for a more tactical manager like Saba. While loans offered some coupon upside given the Fed was going to raise rates, it didn’t offer a lot of capital gains upside as loans don’t trade much above par (as they can be readily refinanced by the borrower).
The fund replaced its loans with SPACs trading below $10 (i.e. at a discount to trust value) which had two benefits. First, SPAC trusts hold Treasury bills so they will tend to remain very resilient during risk-off periods. And two, if the SPAC trades back up to trust value, the fund could generate some additional alpha.
It’s not clear what the fund is holding now – the latest data is of 30-Apr. In terms of performance the fund has outperformed the loan sector, delivering a -3.3% total NAV performance vs. a -10% average total NAV performance for loan CEFs.
However, we also need to keep in mind three possible consequences of its allocation shift. First, the fund is generating next to no income – it does have sub-20% of non-SPAC credit assets but some of them appear to be zero-coupon. Two, given the fund’s delivered a negative total NAV return it’s not clear that its alpha-generation strategy is working super well. And three, credit valuations are attractive now so it would seem appropriate for it to start rotating back into credit assets but its NAV volatility suggests that hasn’t happened. It’s not clear how long the fund can go on with this low return / low-risk taking strategy.
The two Eagle Point CLO CEFs released their June NAVs. CLO Equity fund ECC June NAV came out at $10.08 (our estimate was $10.18 in the CEF Tool) – a drop of 8.4% from its $11 May level. EIC NAV fell 6.6% to $13.66 (estimate was $13.13). This puts ECC at a 18.5% premium and EIC at a 15% premium. Neither fund has ever traded at such high premiums prior to June so these are very strange numbers. Maybe there was some hope that the funds’ NAVs would be fine in June but that obviously didn’t turn out that way given what’s happened to credit spreads. We haven’t seen a similar kind of move in other floating-rate funds – loan CEF discounts are pretty depressed. Not clear why these are as expensive as they are.
Systematic Income CEF Tool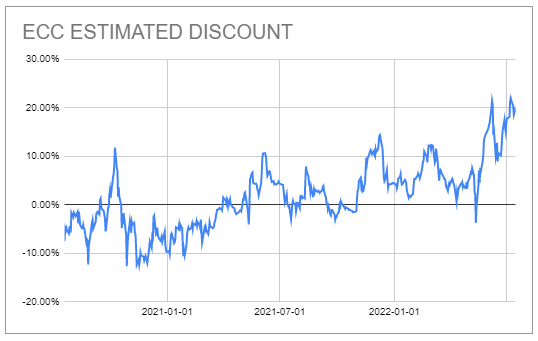
Stance and Takeaways
Although the CEF market valuation has worsened overall, we continue to see pockets of value in the space. Specifically, we continue to like non-agency MBS fund Western Asset Mortgage Opportunity Fund (DMO), trading at a 11% discount and a 10.1% current yield.
The fund holds primarily floating-rate assets and fixed-rate liabilities, making its profile very attractive in the current environment of rising short-term rates. Its discount is wide in absolute terms as well as relative to the sector and its holdings offer diversification against corporate risk-heavy income portfolios.
On the higher-quality corporate side, we also continue to like the preferred fund Nuveen Preferred and Income Term Fund (JPI), trading at a 5.5% discount and a 8.2% current yield. The fund will very likely offer investors an exit at the NAV in 2024 which would drive an additional 2.6% per annum tailwind on top of its yield.


Be the first to comment