

3DSculptor/iStock via Getty Images
As a student of macroeconomics I find the monetary roles of gold to be fascinating. Gold has been used as money for thousands of years. In today’s world awash with credit assets free of counter-party risk, including gold, offer a valuable hedge for investors. This is why the late J.P. Morgan in 1912 said, “Gold is money. Everything else is credit.”
Money is supposed to be boring. It is supposed to be as boring as possible. Money is not supposed to be risky. It’s not supposed to promise great reward. It’s supposed to be the same day-in and day-out, for millennia. Hence, gold.
As one can imagine, money has a role in every investment portfolio as the ultimate liquidity. As such, it should not be expected that gold outperforms other, higher risk assets with regularity. But there are times that rock beats scissors, paper beats rock, and boring beats risk.
As I forecasted in my previous article on gold, the Fed’s rate hike cycle has triggered the next phase in the gold bull market. Signs are now a “go.” Houston, gold backed funds like the SPDR Gold Trust ETF (NYSEARCA:GLD) are ready to launch, over.
Fundamentals, Check
As a result of BASEL III gold was added to the list of tier 1 assets, zero-risk tangible assets, by the Bank of International Settlements. This puts gold in the same class as cash and treasuries.
Gold is a superior form of money because it sports a high stock to flow ratio of approximately 67. This means that the supply of gold has been growing at a rate of about 1.5% over the last 100 years. While technology has made the production of gold better and more efficient, the supplies of gold are depleting and the grade of deposits are falling, overall.
This compares to the rate of growth in M1 and M2 money stock of 13% and 11% in February. According to the U.S. Debt Clock the ratio of YoY increase of M2 to the YoY increase in global ounces of gold is 21,160 to 1. Today, the gold to M2 ratio is well below the 50 year mean. A mean reversion, without additional M2 growth, implies a gold price of $2,600 per ounce. The chart is below.
Chart adapted by author (Source: charts by TradingView)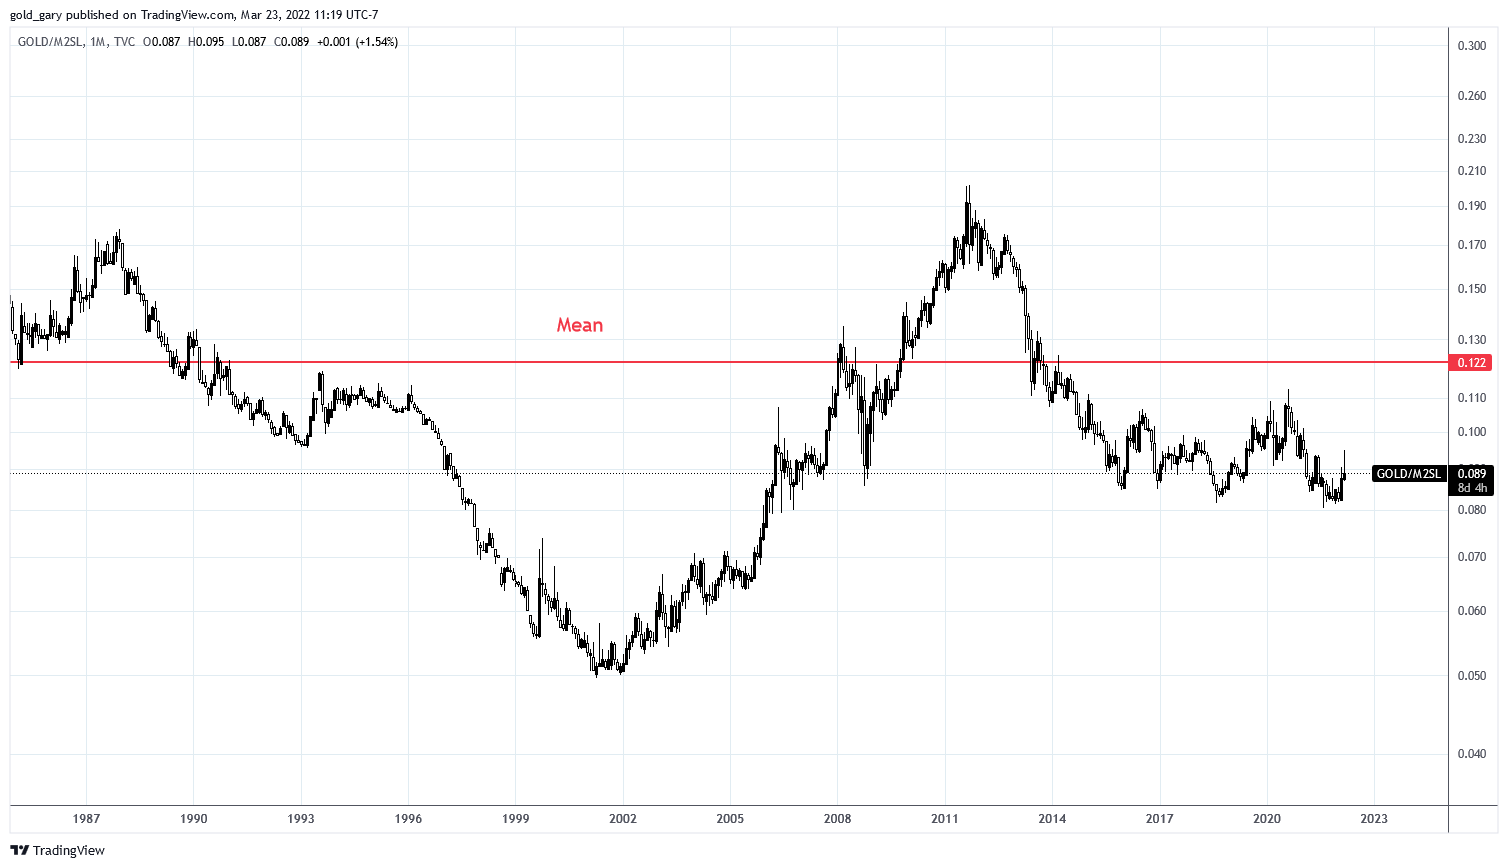
The following is a chart of the gold price (black) and the 10Y-2Y Treasuries yield curve (orange). The yield curve has declined significantly in the last 6 months. The curve is heading for negative territory, fast. Notice that when the yield curve falls below 0.50 it has coincided with a rise in gold. This has occurred twice in the last two decades, starting in 2005 and again in 2018. While the curve was below 0.50 gold rose at a CAGR of 24.7% and 18.6%, respectively.
The yield curve has fallen below 0.50 for a third time. Gold has risen 5.8% since then, at an annualized rate of 49%. This suggests that the next phase of the gold bull market has begun.
Chart Adapted by Author (Source: Charts by TradingView)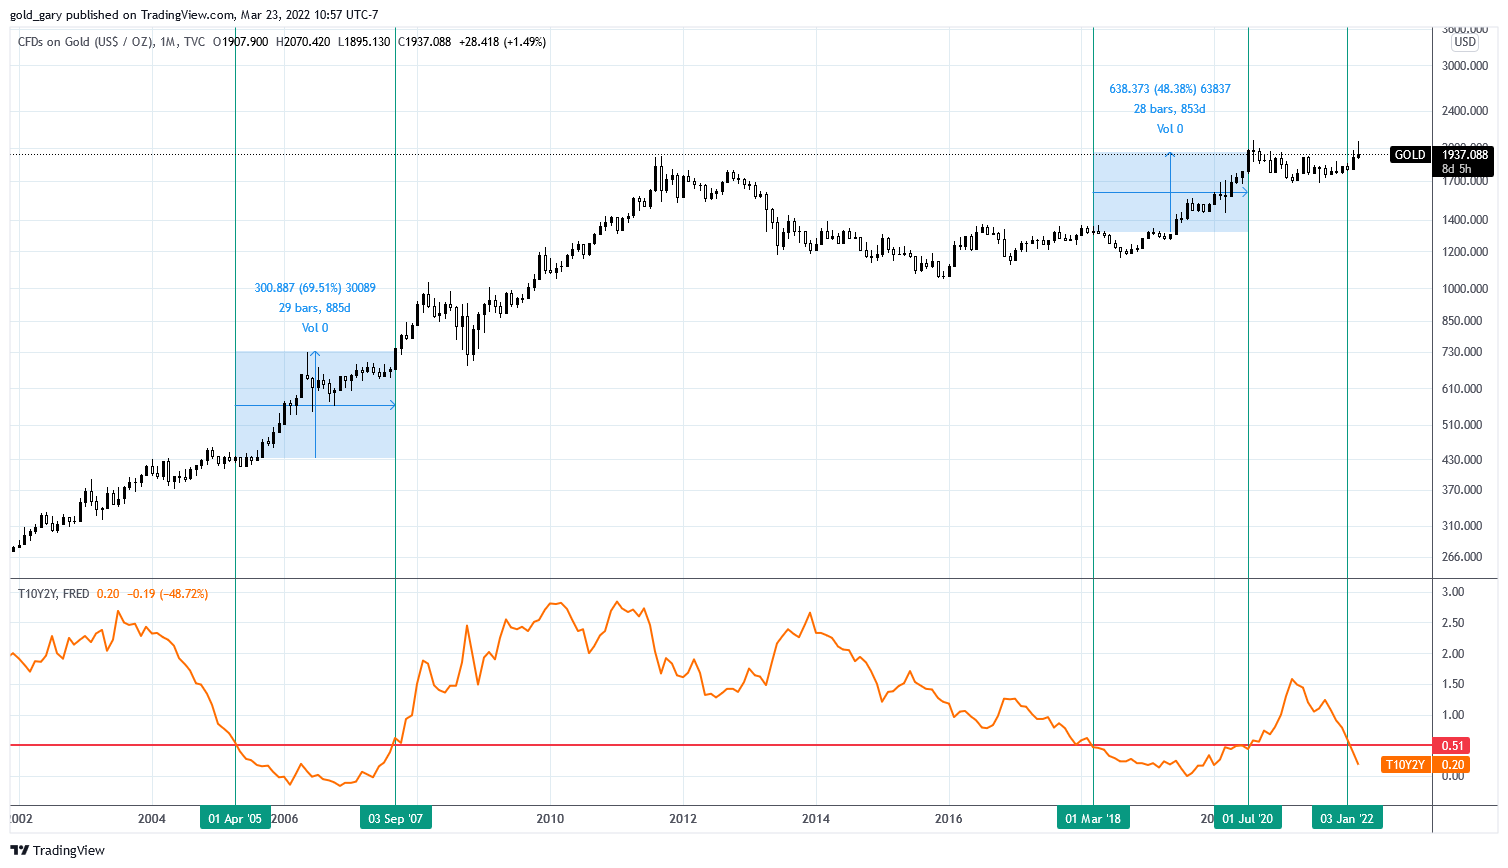
Inflation has reached long term highs of 7.9% and its likely higher than that. Real yields have plummeted including the 10-year treasury which now offers a negative 5.5% real yield. This is very appealing for gold.
Investors may be wary that these negative rates necessitate a rise in nominal yields and that this rise will be negative for gold. The problem is that the U.S. government cannot afford measurably higher rates. If the average rate on U.S. government debt rose to 7.6% by 2051, the interest payments would consume over 25% of U.S. GDP. Every 1% rise in interest rates today increases the debt service by about $300 billion which is approximately 1.4% of U.S. GDP. Due to these conditions, rates cannot increase substantially without causing serious economic issues.
Chart adapted by author (Source: TradingView)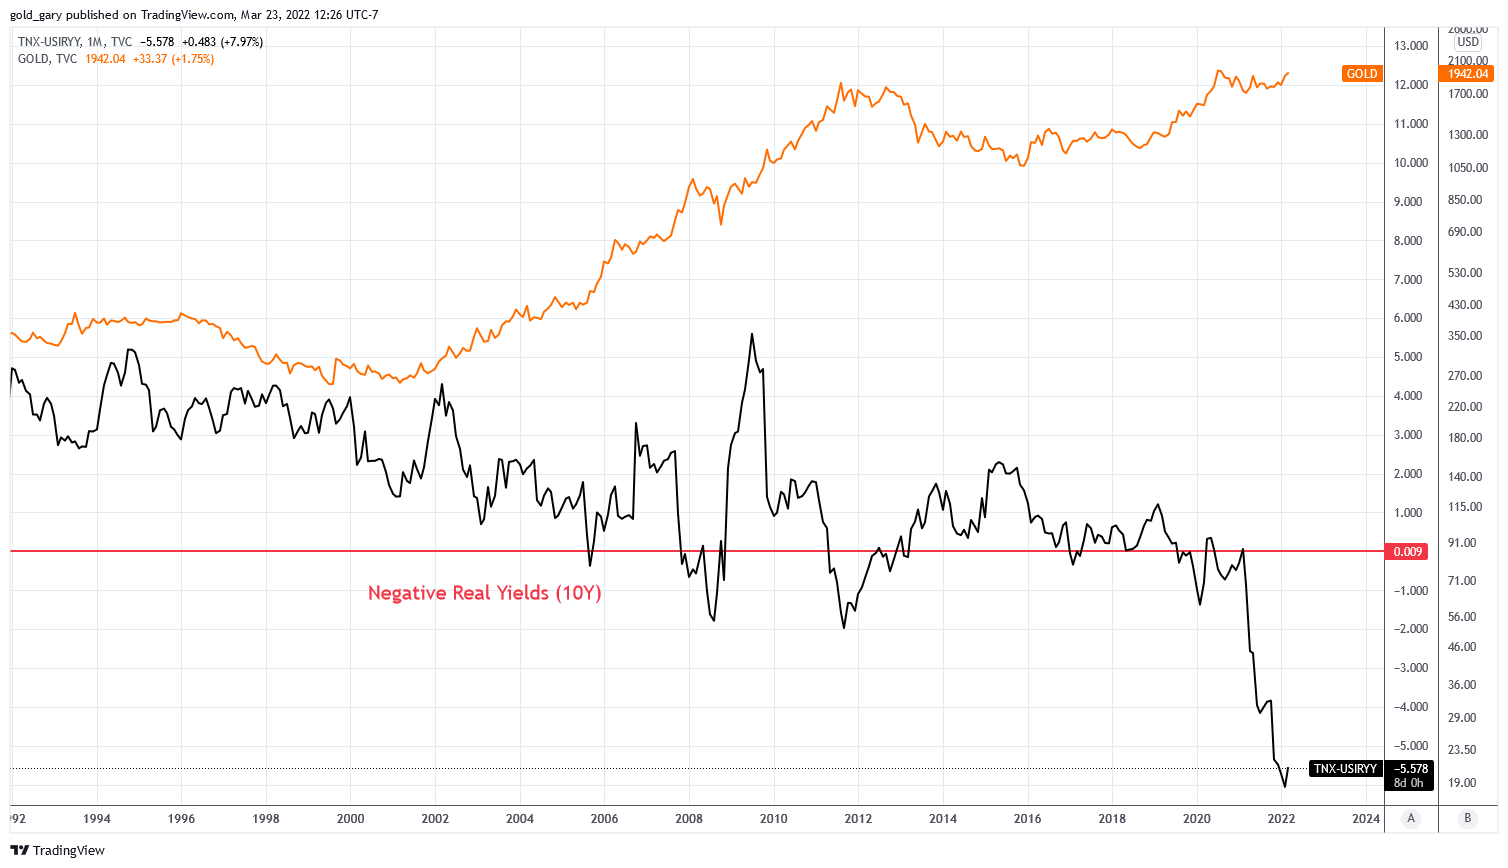
Oil is a significant input cost for gold mining production. Oil prices have been rising in 2022 and are supporting higher gold prices as costs rise. I continue to be constructively bullish on oil in the long term unless we experience a recession. The article “The Oil Crisis is Unfolding in Slow Motion” published by Goehring & Rozencwajg does an excellent job explaining the current oil market. Here is an excerpt from the article:
Today, oil represents less than 3.3% of US GDP and would have to rise to $140 per barrel before approaching the critical 5% threshold. Why do we focus only on the US? Demand is the most elastic in wealthy countries with high energy intensities and the least elastic in developing countries that need energy to fuel their ongoing development. In 2008, prices spiked as high as $145 per barrel albeit temporarily. In this cycle, we believe oil prices will at some point reach, and potentially significantly exceed the previous $145 per barrel peak before we begin to see evidence of demand destruction.
Those are many of the reasons I expect oil, and gold, to perform higher.
Chart adapted by author (Source: charts by TradingView)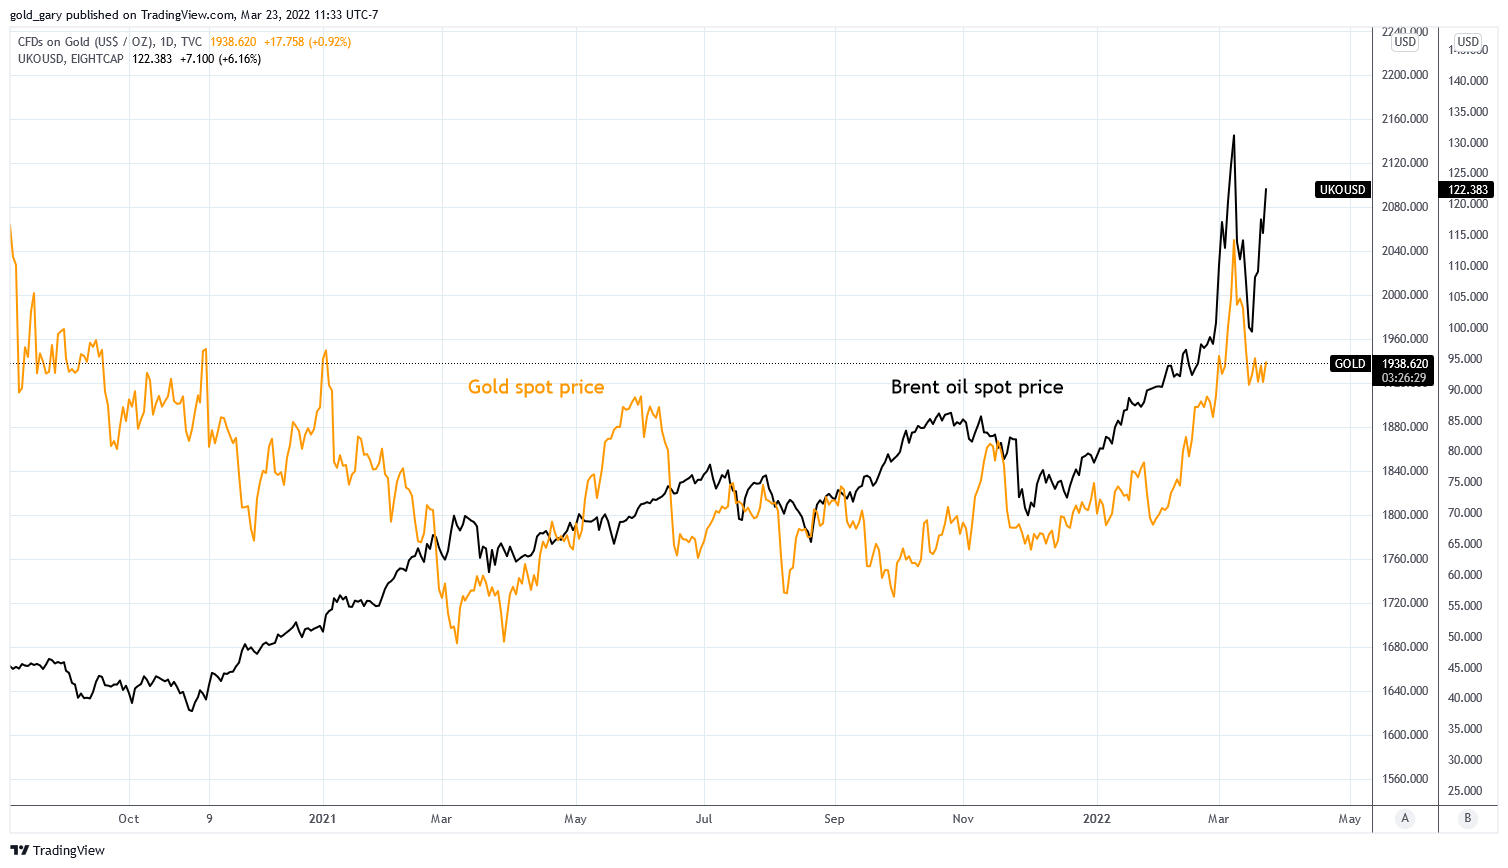
Technicals, Check
In my last article on gold I pointed out the massive cup and handle pattern on the gold chart, below:
Chart adapted by author (TradingView)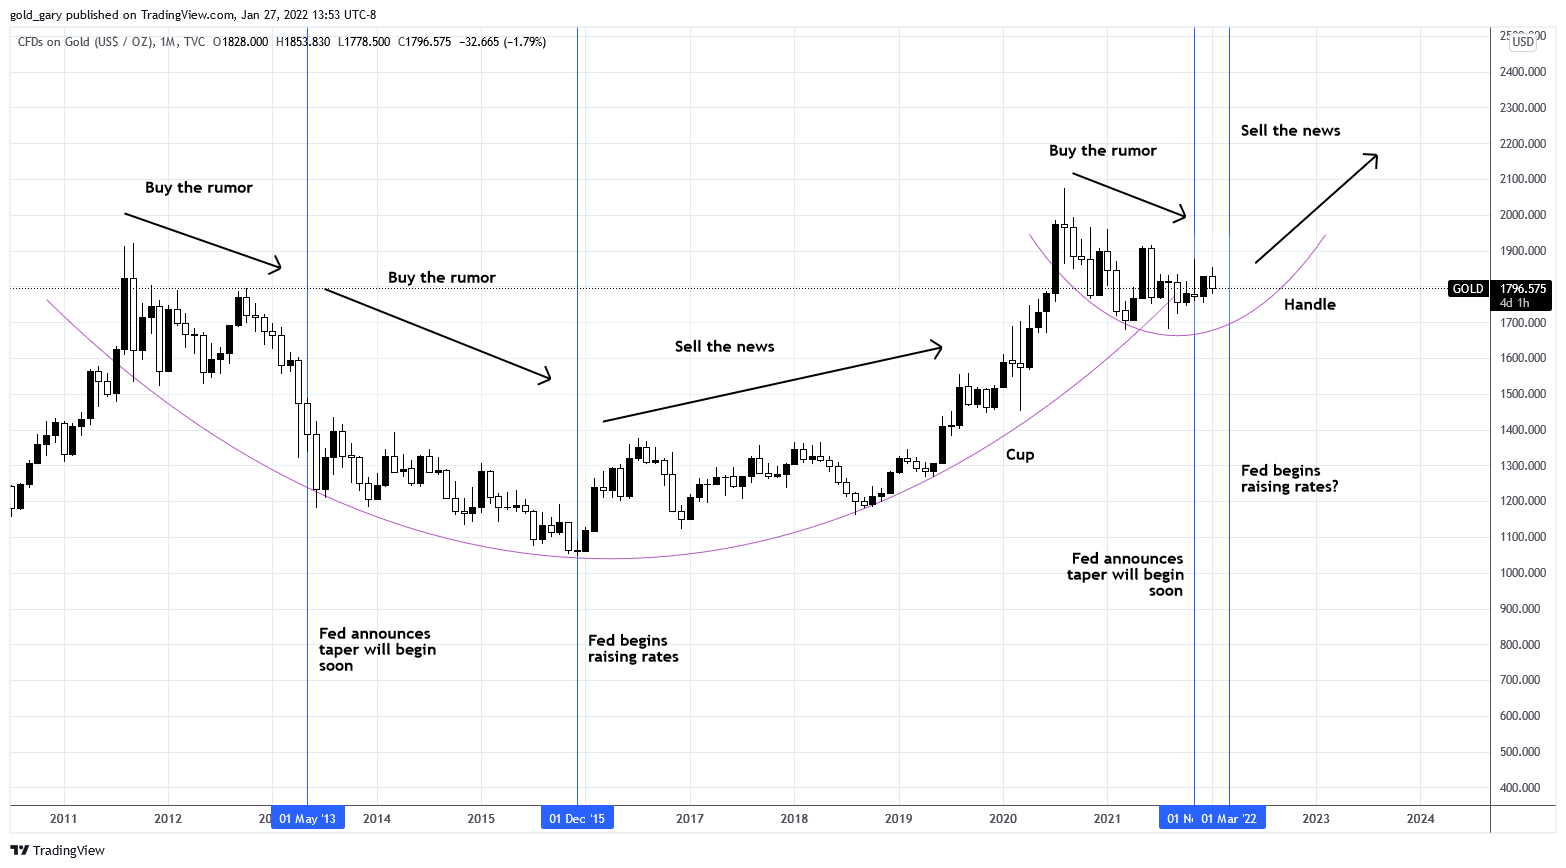
The handle has played out faster than I expected. I expected the handle to bottom near the first Fed rate hike, which occurred on March 16. Instead, gold started higher immediately. I suspect the events in Ukraine prompted the early start. The cup and handle pattern is close to completion and signals gold prices in the $2,500-3,500 range by 2024.
Chart adapted by author (Source: charts by TradingView)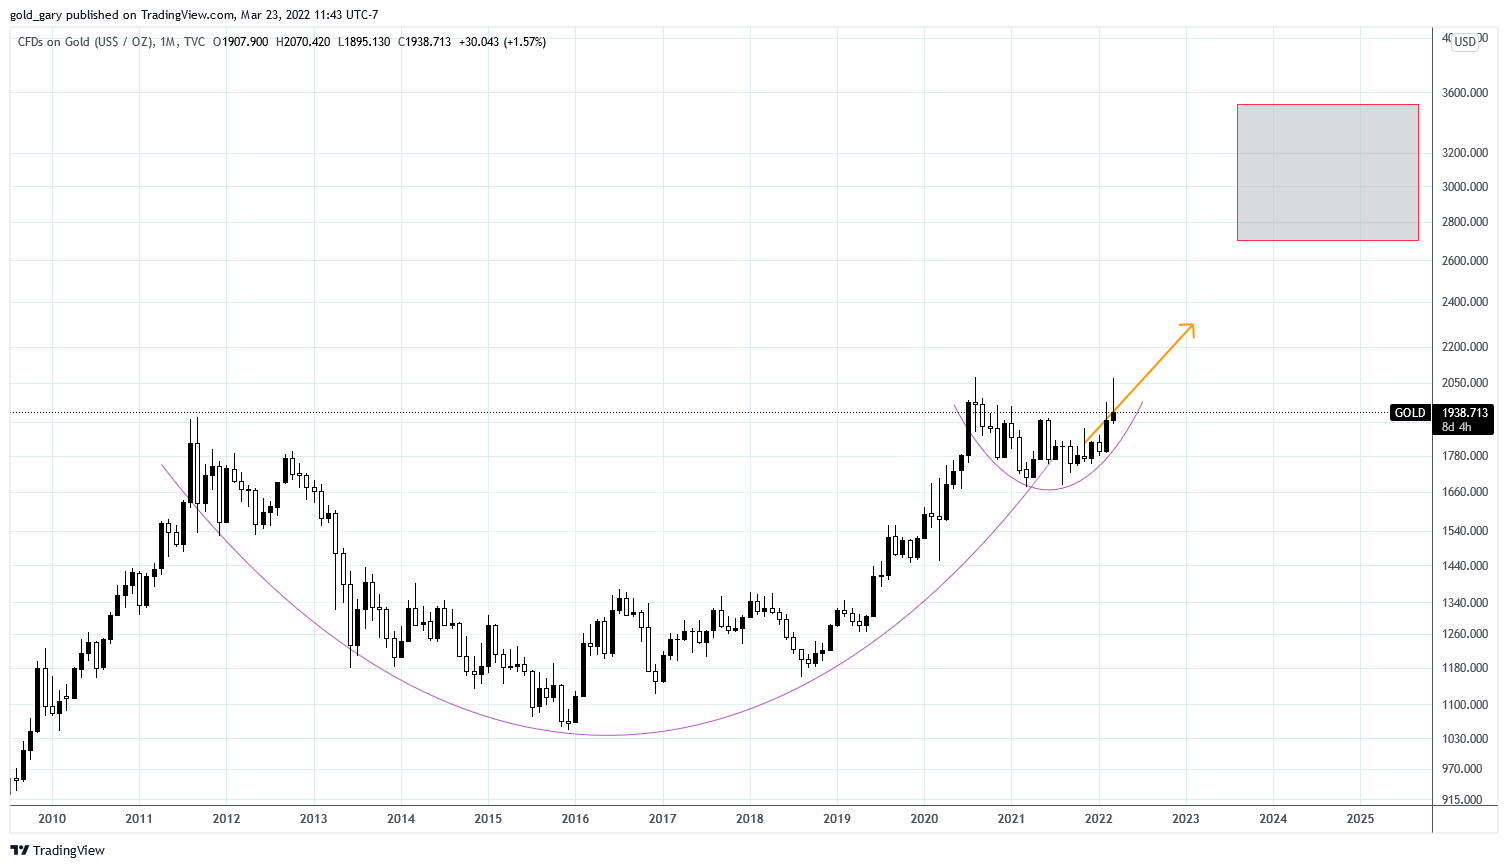
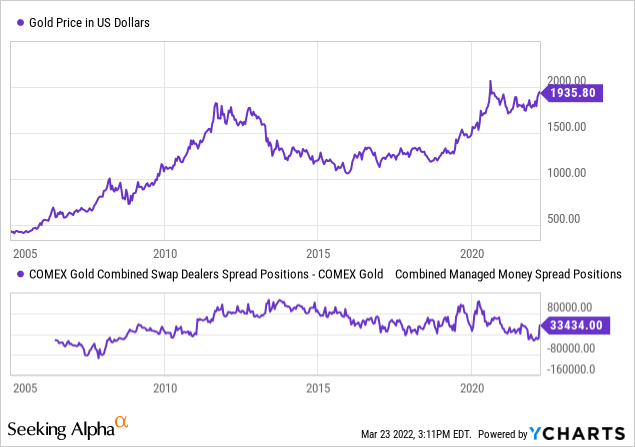
This is coinciding with a long term low in the spread between COMEX Gold Swap Dealer Spread positions and COMEX Gold Managed Money Spread positions. A rally in gold typically follows when this spread drops below zero. This was the case between 2006-2008. At the end of 2021 the spread was the lowest in a decade.
Momentum, Check
Gold bulls may be breathing a sigh of relief as gold has been able to maintain above the 40 month moving average. For a while it looked as though gold may be repeating 2011. While the chart is not out of the woods yet, I want to point out one key fact: the rate hikes have already begun. In 2011-2013 the Fed was posturing about tightening and rate hikes. Today, the market has priced it in.
Gold is now above the 40 and 12 month moving averages, a key condition during the bull market of the 2000’s decade. The 12-month RSI recovered above the 50 level, also a condition of the last bull market.
The RSI is now above its 14 moving average. This condition has signaled each major run over the last 20 years. Given the technical and fundamental conditions I liken the current gold market to that of 2005. The Fed Funds Rate was rising, oil was blasting higher, and real yields were negative.
Chart adapted by author (Source: TradingView)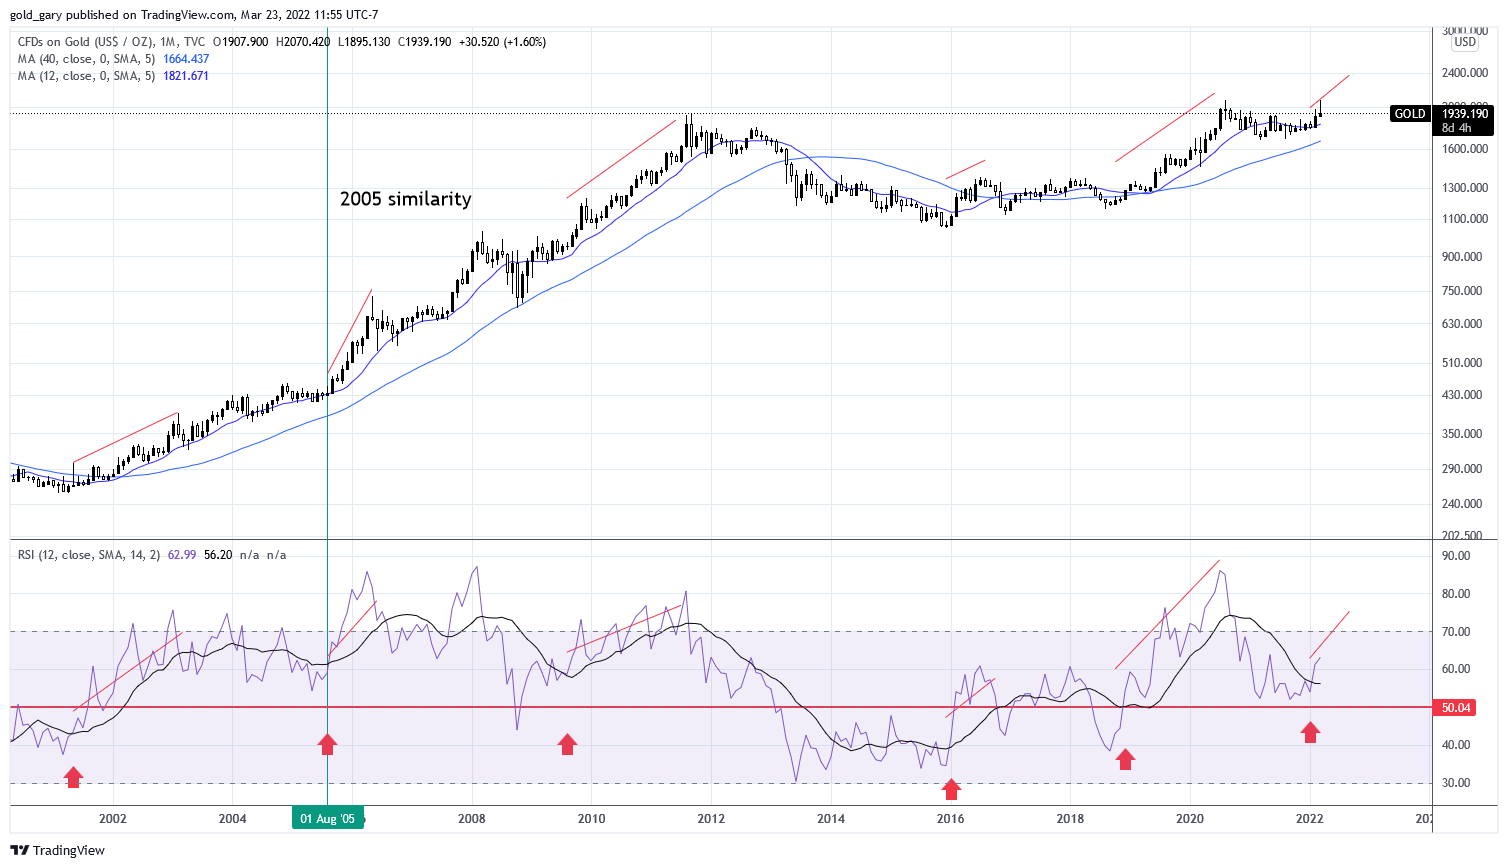
Gold has a tendency to correlate with the performance of bonds, mostly in response to changes in yields and economic uncertainty. One can easily suggest that gold’s recent strength is a result of the uncertainty that has resulted from the War in Ukraine, and I am certain it has had an impact. But curiously, a trend had emerged before the war. Gold (black) and bonds (blue and green) began to diverge in January. I believe this is the market coming to terms with persistent inflation and fully pricing in the Fed rate hikes. We should expect bonds to perform in the face of such uncertainty. This may be the beginning of something significant.
Chart adapted by author (Source: charts by TradingView)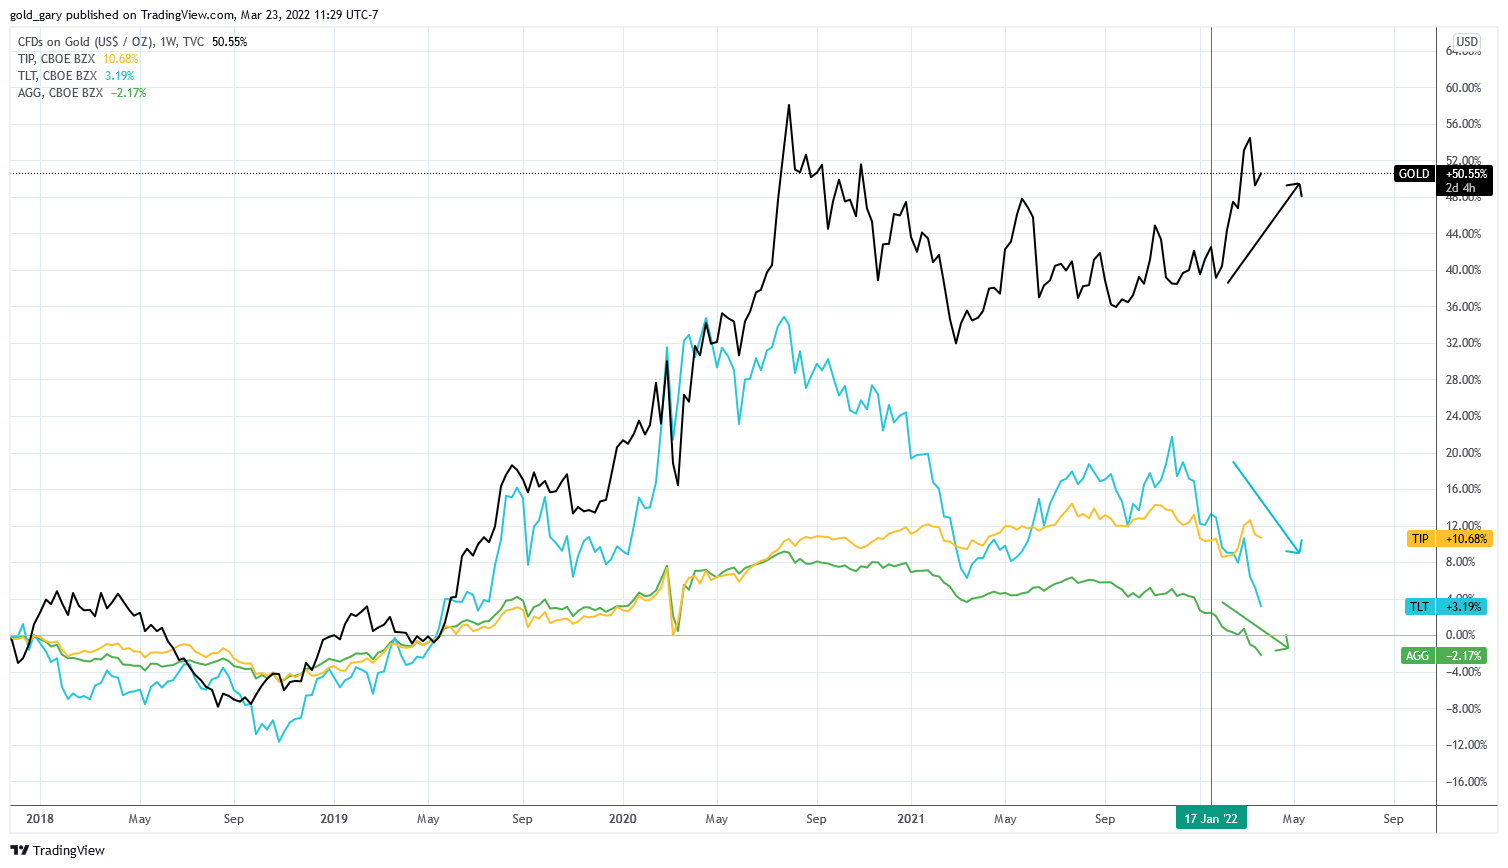
Finally, the DXY has benefited from the anticipated Quantitative Tightening, rate hikes, and economic uncertainty. Again, I see similarities between the current DXY and 2005. RSI was similarly stretched during a corrective move in a secular bear market. If the DXY rolls over from here it will provide jet fuel for gold.
Chart adapted by author (Source: TradingView)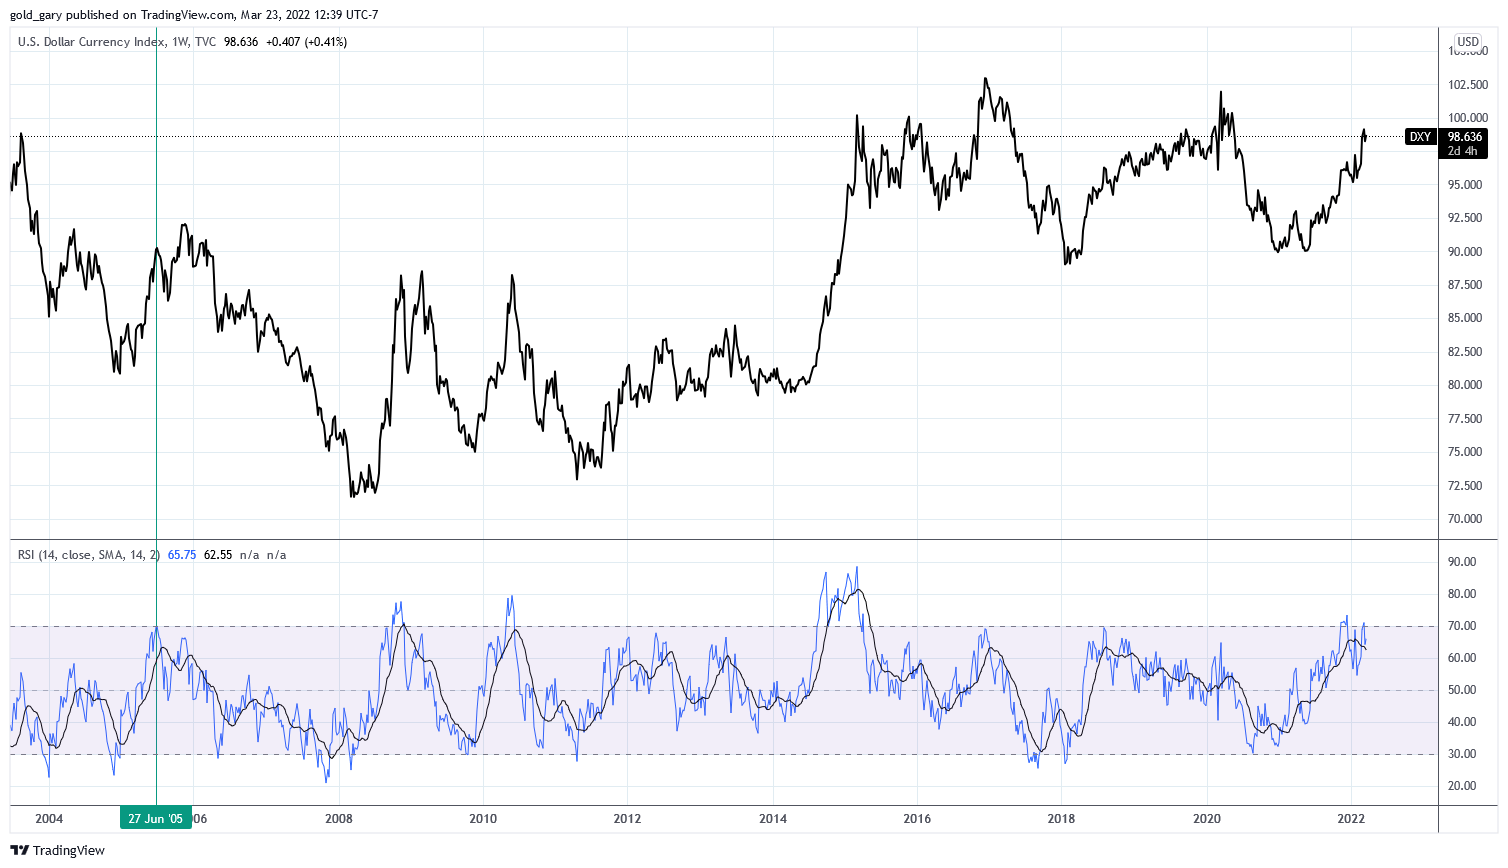
Summary
The SPDR Gold Trust ETF is a no-premium, highly liquid vehicle for gold exposure. Investors can use GLD to gain exposure to gold with the benefits of holding in a brokerage account, including the features of options and stop-loss orders.
Not every time is a good time for gold. Right now, the conditions are favorable and investors can seek protection from inflation, rising rates, and uncertainty in this risk-free tier 1 asset. Gold is sitting on the launching pad and just received orders: go for launch.
Be the first to comment