

Darren415
This article was first released to Systematic Income subscribers and free trials on Aug. 20.
Welcome to another installment of our CEF Market Weekly Review where we discuss CEF market activity from both the bottom-up – highlighting individual fund news and events – as well as top-down – providing an overview of the broader market. We also try to provide some historical context as well as the relevant themes that look to be driving markets or that investors ought to be mindful of.
This update covers the period through the third week of August. Be sure to check out our other weekly updates covering the BDC as well as the preferreds/baby bond markets for perspectives across the broader income space.
Market Action
The 4-week CEF rally paused this week as all but two sectors (CMBS and MLPs) finished in the red with only the CMBS sector seeing a tighter discount.
Month-to-date, the CEF space is up by less than 1% overall with Munis underperforming.
Systematic Income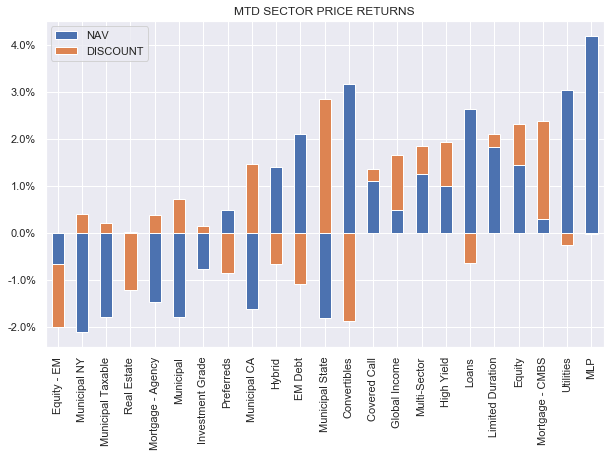
Year-to-date, the CEF sector has moved out, once again, into double-digit loss territory, though it’s still around 8% off its recent low in June.
Systematic Income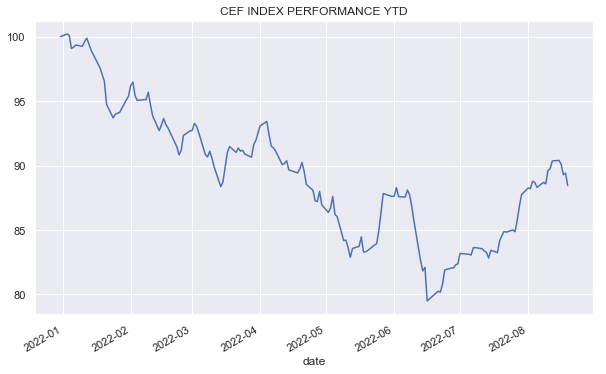
Discounts bounced off their tights, widening by around 1%. Fixed-income CEF discounts are back into fair-value territory while equity CEF discounts remain expensive, in aggregate.
Systematic Income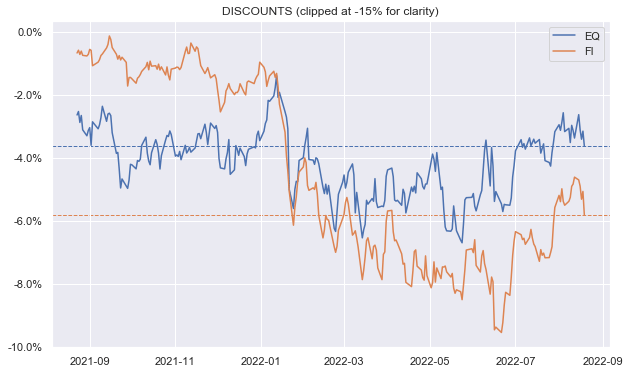
Market Themes
One of the things that many investors like about CEFs is the relative predictability of distributions. Funds with the most predictable distributions are those that have formulaic managed distribution policies which are typically set to a percentage of either the last month’s NAV or a rolling-period, usually covering the last 12 months. For example, the Allspring (formerly Wells-Fargo) set of CEFs follow this 12-month rolling NAV MDP.
The following chart shows the distributions (blue line) of the Wells Fargo Multi-Sector Income Fund (ERC) alongside its 12-month rolling average NAV. ERC had a 9% multiplier on its 12-month average NAV (which recently dropped to 8%) in calculating its annualized distributions.
Systematic Income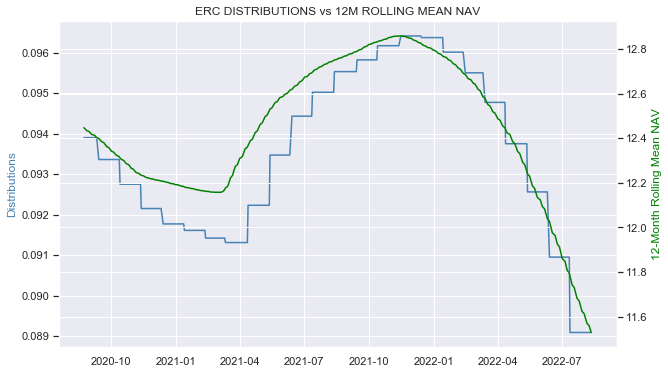
Given the trajectory of NAVs, what’s happening is that higher NAVs from 12 months ago are dropping out of the 12-month lookback and are replaced with new lower recent NAVs which pulls down the average and causes the distribution to shift lower as well.
This is why ERC joined its four Allspring counterparts to cut its distribution once again.
Allspring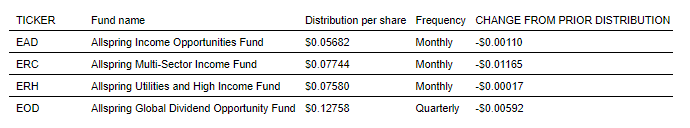
For CEFs with formulaic MDPs, this dynamic allows investors to forecast not only the next distribution but also have a sense of how the distribution will evolve going forward by comparing the NAV today versus where it was 12 months ago. And because CEF relative valuations also tend to track their distributions, investors can have a sense of the impact that the distribution will have on valuations as well. We highlight which funds have formulaic MDPs on our service.
Market Commentary
The Guggenheim Strategic Opportunities Fund (GOF) released its shareholder report. The fund combines various credit sectors with equity holdings – kind of like a lower-beta version of the PIMCO Global StocksPLUS & Income Fund (PGP). GOF attracts a lot of interest due to its 12.8% distribution rate.
The new shareholder report tells us that over the past year the fund earned around $0.066 per month and distributed $0.1821 per month which equates to a distribution coverage of 36%. Net income also fell by about 16% year-on-year.
Total GOF historic returns are a bit worse than the Hybrid sector so the fund doesn’t have any secret alpha sauce to justify its high premium. Obviously, factoring in its premium, the total return on price will be even worse since each dollar of the price holds only about $0.80 of the NAV.
Systematic Income CEF Tool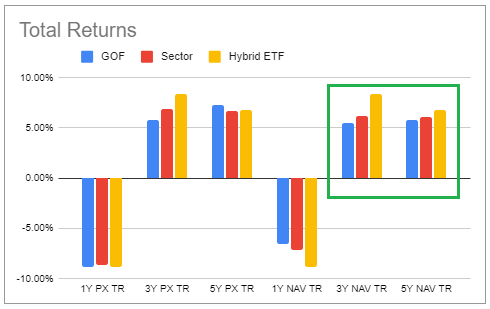
The fund’s valuation is close to the peak differential relative to the Hybrid sector, making it very expensive at present. In our view, investors have more attractive options to choose from in the sector such as the Tri-Continental Corp. (TY) or the Franklin Universal Trust (FT) with better historical returns and valuation.
Systematic Income CEF Tool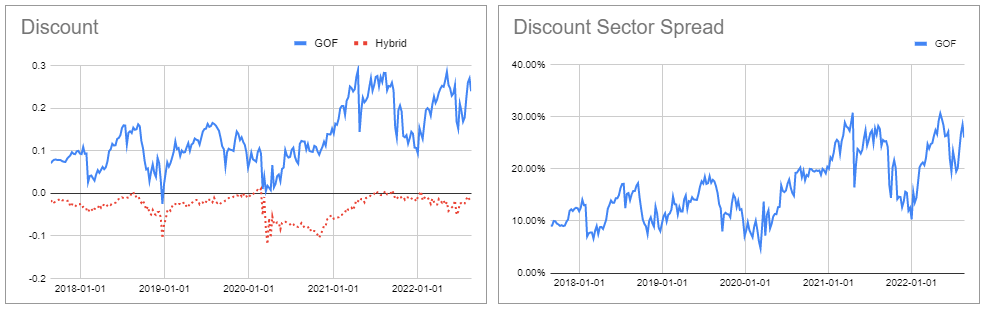
Stance and Takeaways
Before the start of the week we downgraded a number of CEFs. Specifically, we took down 5 CEF holdings from Buy to Hold and one from Strong Buy to Buy. Our view was simply a reflection of the valuations on offer for investors.
Specifically, by the end of last week credit spreads had compressed from 6% to 4.2% while the average CEF discount tightened from 7% to less than 3%. In the context of slowing leading indicators and the Fed that is happily willing to take the economy into recession in order to reign in inflation, that looked on the expensive side.
We have steadily added risk to our Income Portfolios on the back of increasingly attractive valuations this year but only made relative value rotations since the June valuation trough. We continue to carry Buy ratings on a number of funds that remain beneficiaries of the Fed’s steadfast rate hike trajectory. For example, the Apollo Tactical Income Fund (AIF), the Ares Dynamic Credit Allocation Fund (ARDC) and the Western Asset Diversified Income Fund (WDI) have all hiked their distributions this year and should continue to raise them over the next year as the rise in short-term rates filters through their net income profile. These funds continue to trade at decent valuations.
Be the first to comment