

Darren415
This article was first released to Systematic Income subscribers and free trials on Dec. 11.
Welcome to another installment of our CEF Market Weekly Review where we discuss closed-end fund (“CEF”) market activity from both the bottom-up – highlighting individual fund news and events – as well as the top-down – providing an overview of the broader market. We also try to provide some historical context as well as the relevant themes that look to be driving markets or that investors ought to be mindful of.
This update covers the period through the second week of December. Be sure to check out our other weekly updates covering the business development company (“BDC”) as well as the preferreds/baby bond markets for perspectives across the broader income space.
Market Action
It was a tough week for CEFs with all sectors finishing in the red, mostly driven by widening discounts. Month-to-date, NAVs are roughly flat while discounts are mostly wider. Higher-beta sectors like MLPs and REITs have underperformed.
Systematic Income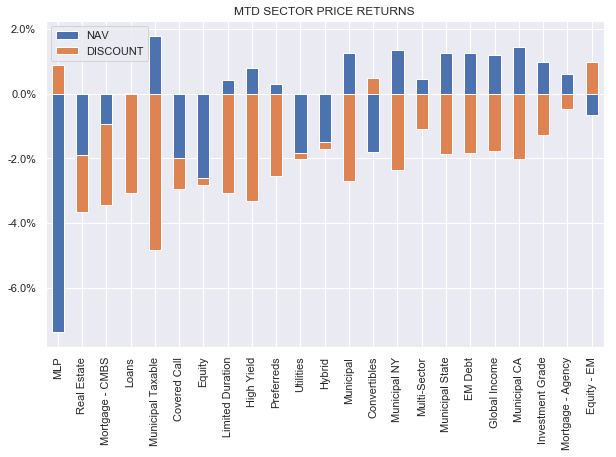
Discounts have reversed the recent tightening trend and are not far from their yearly wides, particularly for equity-linked sectors.
Systematic Income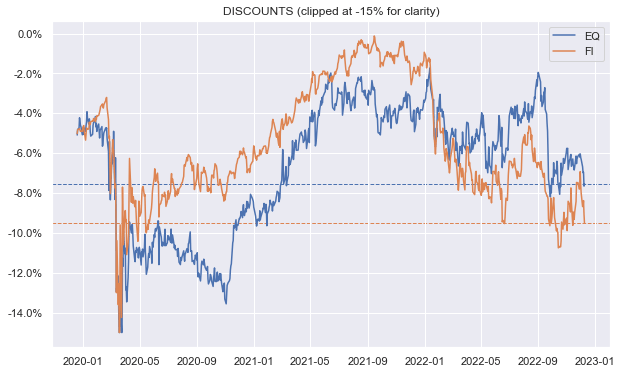
Market Themes
Different investors have different tilts in their CEF allocation – some investors allocate strictly to high-quality credit, others focus more on tax-efficient vehicles such as tax-exempt and qualified dividend sectors while others like to allocate to higher-beta growth securities such as stocks. Whatever the investment strategy however, investors prefer stronger over weaker performance, all else equal, so they seek out funds that will deliver on this goal.
Along these lines we got a subscriber question for a list of funds featuring the following combination: 1) upward long-term NAV trajectory, 2) upward long-term dividend trajectory, 3) high yields. The idea is that these funds are attractive because they preserve investor capital while delivering high and growing income streams.
Our initial view was that this combination would likely be difficult to find outside of more than a handful of funds for a couple of reasons. First, an upward long-term NAV trajectory excludes all or nearly all fixed-income funds for the simple reason that fixed-income funds don’t have a lot of upside in their NAV once they distribute all of the income.
This leaves mostly equity funds under consideration, however, it would also exclude most equity-linked because equity-linked CEFs like to distribute forward-looking capital gains as well. In other words, the reason many equity-linked CEFs have mid-to-high single-digit yields despite net income that is not far from zero (outside of some unique assets such as covered calls and MLPs) is because they monetize long-term capital gains. However, funds that distribute net income and capital gains leave little for further NAV appreciation.
Funds that manage sustained capital gains can tick all the boxes if they are lucky enough or if their distributions are below their capital gains levels. Such funds can also grow their distribution levels as their NAV grows over time.
While difficult, it’s not impossible to find CEFs that fit these criteria. They include funds like BME, DNP, GDV, HTD, PDT, STK, UTF, UTG. However, investors need to be mindful of two key things. First, this population skews to Health/Tech/Utilities equity sectors so investors who only allocate to funds fitting this criteria will have a fairly undiversified portfolio.
And two, as we discussed a number of times previously, equity CEFs tend to underperform their ETF counterparts despite many CEFs carrying additional leverage. To illustrate this point we selected reasonable ETF benchmarks for the CEFs (SPY for GDV, QQQ for STK, XLV for BME and XLU for the others). As the chart shows below, over the past 5 years, all these CEFs underperformed the benchmark ETF, most of them by sizable amounts. This is not a universal truism of CEFs. For instance, fixed-income CEFs have, instead, tended to perform better relative to their ETF benchmarks historically.
Systematic Income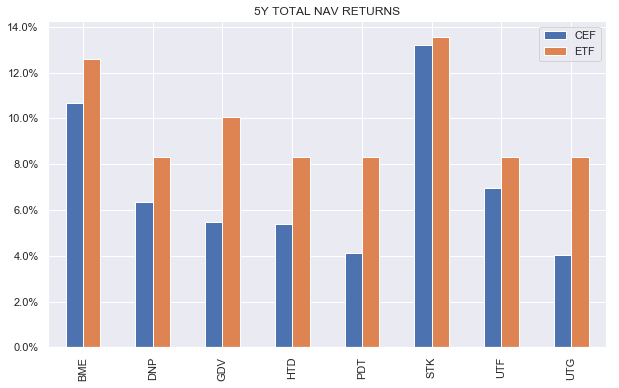
In summary, investors who allocate along the trifecta discussed in this section face two difficulties – an undiversified portfolio of past winners as well as CEFs that typically significantly underperform their simple unleveraged passive ETF benchmarks. So while the criteria highlighted above may seem like an obvious way to go about CEF allocation, it carries a number of less obvious risks for investors.
Market Commentary
Apollo credit CEFs Apollo Tactical Income Fund (AIF) and Apollo Senior Floating Rate Fund (AFT) raised dividends again. AIF raised by 6% and AFT raised by 3%. This makes it the fifth raise this year for AIF. AIF is down about 9% in total NAV terms which is not bad as far as CEFs go this year – it’s better than all the PIMCO credit CEFs for instance. Of course, as another subscriber pointed out, investors who were averaging down through the year would have had an even better result. AIF remains in the High Income Portfolio. It’s trading at a 12% yield and a 14% discount. CLO Equity CEF Oxford Lane Capital (OXLC) reported its November NAV of $4.84 which was not far off its October level. It’s trading at a 4% premium which, unusually, puts it behind ECC and EIC. IAs the chart below shows the fund’s relative valuation versus ECC (i.e. OXLC is trading at a 12% lower premium than ECC) is unusually low.
Systematic Income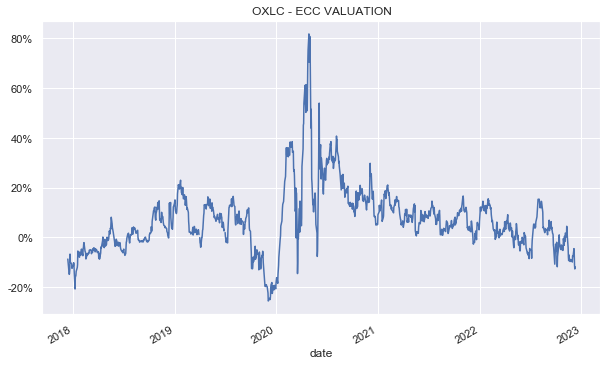
Mixed CLO Equity / loan CEF XAI Octagon Floating Rate & Alternative Income Term Trust (XFLT) issued its shareholder report earlier this month. For the period Mar-Sep, it generated income of $0.43 which was about 10% above its previous semi-annual period. This is still below its distribution however the two should already be on par given the lag with which higher short-term rates feed into reported income. The fund holds mostly floating-rate assets and about a third of its liabilities in fixed-rate assets. The fund reduced its leverage facility by $10m and increased its preferreds outstanding by the same amount so net-net its total borrowings remained flat.
At the end of September, its leverage was a chunky 44% which is very high particularly given its partial CLO Equity allocation. This figure has deflated somewhat as assets have rallied in the last 5 weeks. The fund issued new preferreds – a new series 2029 convertible preferreds with a 6% coupon. These were sold at $23.25 which equates to a yield of around 6.4%. This is not far off the 6.5% 2026 preferreds it already has and not far off the cost of its leverage facility at the moment. Details of the convertibility are not provided, but there will likely be some dilution of common shareholders on conversion. If we use this level as its interest expense and add its management fee of 1.7% and other expenses of 0.67%, we get to a total cost of 8.9% on leveraged assets.
This is the hurdle on the fund’s leveraged assets before common investors see any income. In other words, if the yield on its portfolio is something on the order of 13% (i.e. based on 10% and 17% yields which are rough yields on loans and CLO Equity), then investors get a yield of about 4% on the fund’s leveraged assets which make up 40% of the fund’s total assets. This is about where US Treasury Bills trade at the moment. PIMCO credit CEF PIMCO Dynamic Income Opportunities Fund (PDO) caught a bid after the declaration of its large special. Its 4% premium is now, unusually, above other PIMCO credit funds like PFL, PFN and PHK all of which boast a much lower management fee (and, hence, should trade at a higher premium, all else equal). The following chart shows the valuation differential between PDO and other PIMCO credit CEFs and highlights how unusually expensive PDO is at the moment, having only a 4% lower premium than the average PIMCO credit CEF.
Systematic Income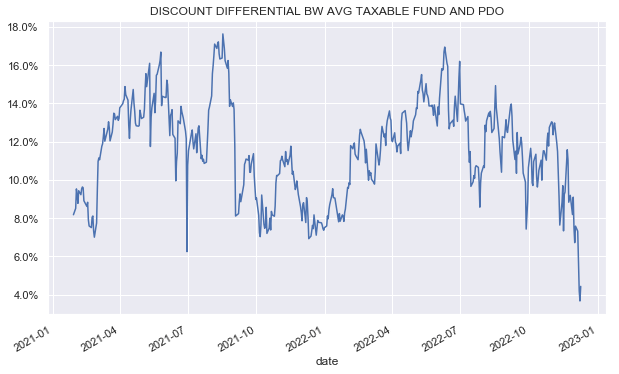
Investors who want to maintain an elevated level of leverage (the 3 funds mentioned above operate at significantly lower leverage) may just want to rotate to PIMCO Access Income Fund (PAXS) which hasn’t rallied as much and now looks cheap vs. PDO at a 1% discount. The following chart shows the valuation differential between PDO and PAXS and shows that a 5% higher valuation of PDO (4% PDO premium vs. 1% PAXS discount) is unusual.
Systematic Income CEF Tool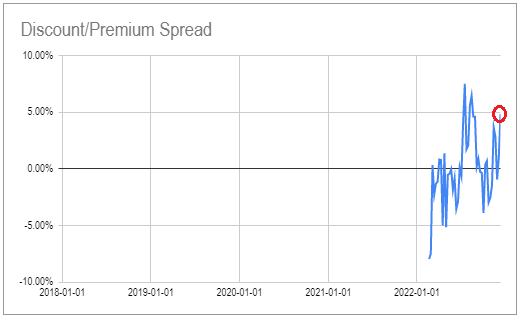
After the special distribution smoke clears people will realize that PAXS has a higher distribution yield than PDO. The other reason to fade the PDO price spike is that PDO only had a much larger special than PAXS because PAXS only IPO’d and fully leveraged up recently. In other words, on an equivalent footing (i.e. if both were fully leveraged throughout the year) the two funds would have had pretty similar specials.
BlackRock Taxable Municipal Bond Trust (BBN) cut its distribution by around 16%. What’s more surprising is why the fund waited so long to make the cut. This fund has been under the same pressure as the tax-exempt sector but even more so due to its longer duration and the tax-exempt sector has been a liberal cutter this year.
The fund’s very long duration (the taxable muni space which, unlike the tax-exempt sector, tends to be non-callable which, in turn, lengthens its duration profile) has also caused its NAV to underperform, putting its leverage even more under pressure.
The fund has been cutting its borrowings at a regular clip this year – for a total of around 30% since the end of last year. This, along with overdistribution (coverage started the year at 88% and is now 72%), have caused the inevitable cut. The new distribution of $0.1029 is still well above its net income of $0.089 (i.e. new coverage is 86%) so it’s still overdistributing but at least it’s back to roughly the same coverage level as at the start of the year.
Systematic Income CEF Tool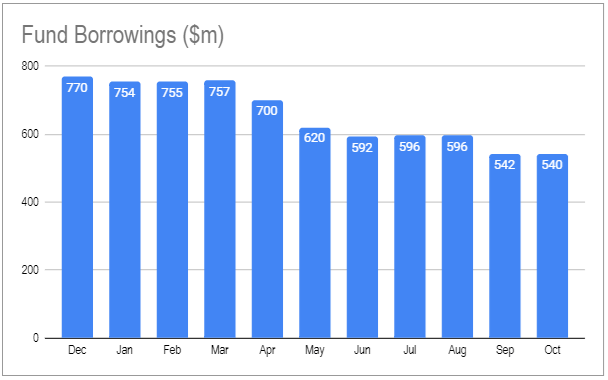
CEF Tool Update
A metric that tracks the price differential of a CEF relative to its trough in the past year was added to the “Sort Tables” tab of the CEF Tool. The “Sort Tables” tab lets you sort the CEF population by a given metric such as discount, various return metrics, etc.
“PX Off 1Y Low” is the differential between the fund’s current price and its low over the past year, i.e. 2% means the fund is 2% above its low over the past year. Funds with a low figure could be funds that have lagged the market and offer a margin of safety. By this metric CEFs that look interesting are DMO, FINS, BSL and AFT. We continue to see value in the first two of these funds which we continue to hold in our Income Portfolios.
Systematic Income CEF Tool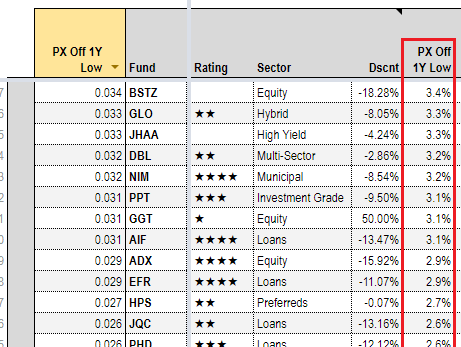
Be the first to comment