

Anastasia Chetvertukhina/iStock Editorial via Getty Images
Introduction
In investing, I have heard and read many times that it is better to have no such thing as “a favorite stock” or a “favorite industry”. In fact, it is often said, an investor should be as objective as possible and keep some sort of distance from the stocks picked. Of course, while this sounds very reasonable, we also have to consider another aspect: it is inevitable to prefer something over everything else. I have come to realize that North-American Class 1 railroads are part of an industry I like. Part of this is due to Warren Buffett’s investing journey, during which he came to realize why a capital intensive business such as this can offer very interesting returns when correctly understood. I tried to summarize his thought in the article “Learning From Buffett and Berkshire About Investing In Railroads: The BNSF Case Study”. This article is the cornerstone of my research and I highly recommend reading it to get a grasp of how I am trying to assess railroads. Here readers can find a better explanation of why I am focusing on earning power, efficiency and the use of capital for each one of these companies.
In addition, I believe this industry is worth looking at to feel the pulse of the overall economy.
Now, it is once again time to look at Canadian Pacific (NYSE:CP) and the results it recently released.
Summary of previous coverage
For those who are unfamiliar with the company, it is important to point out the main asset it owns: a well-positioned network that, if the KCS acquisition will be approved this year, should make the company the only one with direct access to five different coasts (western and eastern Canada, Gulf of Mexico, western and eastern Mexico). I also pointed out how the company is more exposed to grain, which accounted for around 27% of its Q4 freight revenues ($655 million out of $2.41 billion). In the map below, we can see the whole network the company owns so far (without KCS) and why it is sensible to both Canadian and U.S. grain-producing regions.
CP Q4 Results Presentation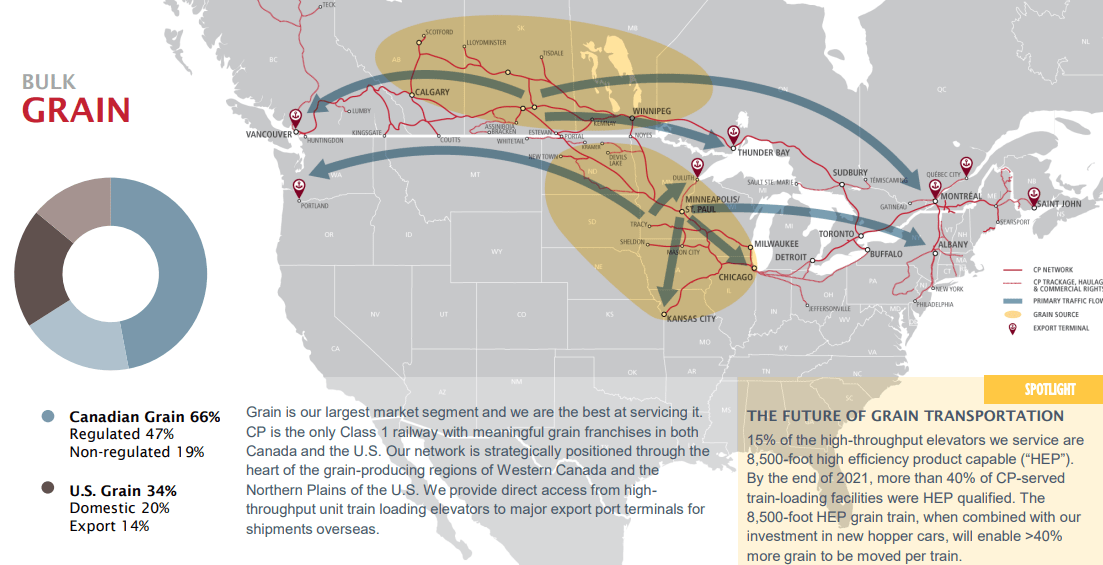
Earning power
We saw how it is vital for railroads to score a high earning power ratio which is calculated as pre-tax earnings/interest. In 2021, the ratio was 6.20, lower than Canadian National and Buffett’s BNSF. Of course, this ratio is affected by the Kansas City Southern acquisition, a stock and cash transaction representing an enterprise value of approximately US$31 billion, which included the assumption of US$3.8 billion of outstanding KCS debt.
To fund the deal, Canadian Pacific issued some long term debt, which spiked up to $20.13 billion (vs $9.77 in 2020) and increased the long term debt/net income ratio at 7.1 vs. 4 in 2020. A clear consequence of the long term debt issued is the increase in interest expense, lowering the earning power ratio.
Still, a 6.2 was a ratio I considered safe. After Q3, the ratio went down to 5.6 due to increasing interest expenses. However, the company is committed to quickly paying down a big portion of its debt and I think the good results railroads have achieved in these years provides good tailwinds to Canadian Pacific as well to achieve its goal.
Regarding efficiency, we can look at two parameters: operating ratio and fuel consumption. At the end of last quarter, Canadian Pacific’s operating ratio was 59.5% with a 70 bps improvement YoY, proving that the company was able to completely offset inflation. Fuel efficiency came in at 0.93 US gallons/1,000 GTMs.
ROIC
Before the KCS acquisition, Canadian Pacific had a best-in-class ROIC of16.7% higher than Canadian National’s 15.7%. In 2021, because of the cash deployed for the acquisition, this number came down to 8.2%.
Use of capital
Currently, the company is committed to paying down its debt. This is why Canadian Pacific paused share repurchases to get as quickly as possible back to its usual balance sheet metrics. While share repurchases are always welcomed by investors, I think it is a smart move to strengthen the balance sheet before returning capital to the shareholders. A healthy balance sheet poises the company for long-term stability and future rewards.
In terms of capex, the company keeps it below 17% of its revenue. About half of it is spent on maintenance, while another 20% goes to network enhancements.
Q4 and FY22 Results
Reported operating ratio increased by 60 bps to 59.8 % from 59.2 % while adj. operating ratio increased 160 bps to 59.1 %
Reported diluted EPS increased to $1.36, from $0.74 in Q4 2021 while core adj. diluted EPS increased to $1.14, from $0.96 in Q4 2021.
If we zoom out and look at the whole year, we find out that revenues increased 10 % to $8.81 billion. Free cash flow increased 52% YoY to $2.7 billion, an impressive result. However, Canadian Pacific saw its operating ratio for the full year increase by 230 bps to 62.2%. As a consequence, reported diluted EPS decreased to $3.77 from $4.18 and core adj. diluted EPS was flat YoY at $3.77.
Revenue Breakdown
In this article, I would like to look a bit deeper at the different sources of revenue for the company. Below, we can see Q4 YoY variance of these sources. Thanks to the big Canadian harvest, grain revenues were up 42%, but automotive and intermodal performed quite well, too. Coal was hindered by an outage at Teck’s Elkview mine. While automotive was to be expected, as inventories are being replenished, intermodal was somewhat of a surprise, since the other industry peers reported a slow-down. John Brooks, Canadian Pacific’s CMO, spoke about this during the last earnings call:
On the intermodal side of the business, quarterly volumes were up 17%, where revenues were up 29%. Despite demand coming off record levels that we have seen in the past few years, our unique market wins have differentiated us in international intermodal, with volumes up more than 3% in the quarter. With favorable compares with the first half of 2023, driven by new business that started out the back half of 2022 and the continued port expansion at the Port of St. John, we are well positioned to continue to outpace the industry in this space. Port of St. John continue to see tremendous growth, eclipsing 150,000 TEUs in 2022, more than a 70% increase year-over-year.
CP Q4 Results presentation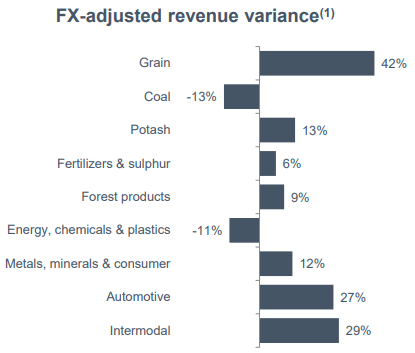
I think it is worth taking a look at the overall bulk segment, which, as we have seen, is a major source of revenue for Canadian Pacific. In 2022, grain accounted for more than half of the whole segment, with coal, potash and fertilizers lagging significantly behind.
CPQ4 Results Presentation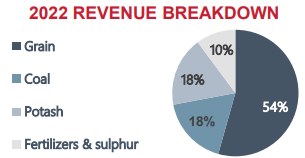
John Brooks, Canadian Pacific’s CMO, outlined how the company was set to benefit from the harvest and how it was prepared to the output increase thanks to its investments:
Working in concert with our grain supply chain partners, CP set new all-time monthly tonnage record for shipping grain and grain products in October and we delivered our second largest quarter ever for grain volumes.
Our newest 8,500-foot high-efficient elevator, a Richardson greenfield facility in Saskatchewan, started receiving in December. And in 2023, we expect to be over 50 Origin elevators that will be 8,500 foot capable, enabling us to continue to move records amount of grain more efficiently.
While this year will be highly profitable for the company, due to the big harvest, I find myself thinking that this exposes the company to some risks linked to many factors that can’t be controlled. In fact, harvest output is something that can’t be totally predicted, though fertilizers and high-tech agriculture are used. On the other hand, I think the KCS acquisition is set to defend the company from this risk. By creating a network going from Canada to Mexico, the company is going to play a major role in the new industrial supply chain that is being built in North America, as many companies want to move away or diversify their manufacturing activity from China to Mexico. This should even out the weight of grain with automotive and intermodal in general.
Earning power
At the end of 2022, Canadian Pacific was able to bring back above 6 its earning power, scoring a 6.36 (Canadian National scores a 12.34). There is still room to improve and bring it back around 10, but, as I have already written in other articles, it is a ratio I consider safe because it means that the current pre-tax income is 6 time greater than the interest expense. This leaves enough room for severe economic downturns to take place without leading the company to the point it is not able anymore to face its interest expense.
Efficiency
Regarding efficiency, we see a double-sided picture. The operating ratio for the year was above 60%, which is not a Canadian Pacific standard, but we have also seen how in Q4 the company was back below 60% with an operating ratio of 59.1%. This shows Canadian Pacific is moving in the right direction as the full year results sees the impact of inflation and operating costs in the first half of the year.
Regarding the operating performance, we can look at the slide below, taken from the results presentation.
CP Q4 Results Presentation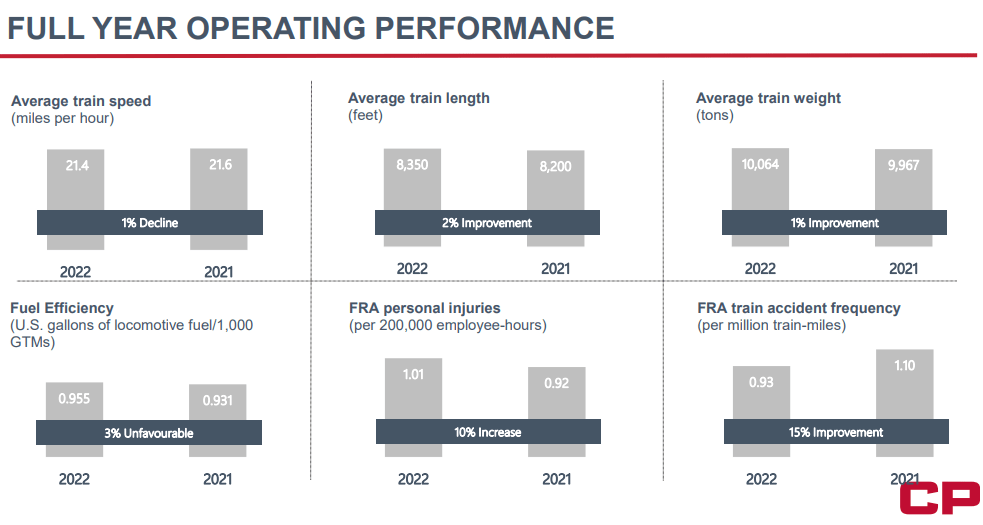
We see that while the average train speed declined a bit, the average train length and weight slightly increased. I think this explains why fuel efficiency was 3% unfavorable, moving up from 0.931 to 0.955. Regarding fuel efficiency, Canadian National keeps on being the best one with 0.886 US gal/1,000 GTMs.
Use of capital
Let’s start from the calculation of the return on invested capital (‘ROIC’). Canadian Pacific published these data in its last report, showing the adjusted average invested capital and the adjusted return.
CP Q4 Earnings Release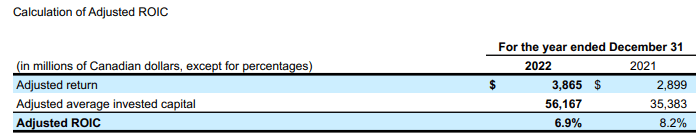
As we can see, adj. ROIC went down once again from the already low 8.2% of 2021. This is not a good return, however, it is due to the big investment the company has undertaken to buy KCS. As the deal goes through, we should see the return on invested capital go quickly up.
As a side note, the KCS deal is already bearing fruit. In fact, over the course of 2022, Canadian Pacific received a total of $1 billion in dividends from cash flow in excess of the capital KCS has invested in its railroad. This is why free cash flow increased dramatically to $2.7 billion. Most of the dividends received were used to pay down debt and the company has already repaid more than $1.6 billion in debt. As a consequence, the pro forma leverage ended the year at 3.8x which is close to that 3, I consider safe.
Conclusion
I confirm my hold rating, meaning that I believe Canadian Pacific becomes a buy if the stock prices goes below $70. It currently is the most expensive among railroads, as a lot of expectations about the KCS deal are baked in. However, I think the price will see a bit of downward pressure as share buybacks are paused and the company faces some quarters of lower profitability ahead as the deal goes through. In addition, the company seems to be struggling a bit more than Canadian National with managing costs and achieving increasing efficiency. I personally like the KCS deal and the company, but, at the moment, I believe Canadian National is running better and more efficiently. Moreover, Canadian National seems to be protecting its three-coastal network from the CP-KCS deal by signing its exclusive partnership with Union Pacific and Norfolk Southern (NSC) in Equipment Management Pool (‘EMP’) program, an interline service that enables shippers to use more networks, providing seamless access to most of the major cities across the whole North-American continent, from Canada to Mexico.
Be the first to comment