

Mongkol Onnuan
Self
Early this year, I wrote what I thought might be my final article about the Dividend Growth 50, a popular fixture on Seeking Alpha. I was starting to think that the project — a real-money, buy-and-hold, DGI portfolio composed of stocks selected about 8 years ago by a panel of SA contributors and purchased on Dec. 16, 2014 — had run its course. As I said in my conclusion:
The portfolio held its own in total return except for when the bull really got running, and it experienced outstanding income growth through a variety of market conditions. I’m not sure what else it has to “prove.” In the coming months, I’ll be deciding if I want to keep it going or focus my energy elsewhere.
Well, I decided to keep the DG50 intact and to continue tracking it, and I’m glad I did … because here’s what else it had to prove:
A portfolio of dozens of high-quality, dividend-growing names can — and almost surely will — outperform the market SIGNIFICANTLY in down years such as 2022.
| VALUE 12/16/21 | VALUE 12/16/22 | DIFFERENCE | PCT | |
| DG50 | $56,188.86 | $55,833.62 | -$355.24 | -0.6% |
| VOO | $1,471.48 | $1,232.85 | -$238.63 | -16.2% |
That’s right: While the overall market — as represented by the Vanguard S&P 500 ETF (VOO) — crashed by some 16% over the past 12 months, the DG50 basically “held serve.” (I had bought a VOO position on 12/16/14, the same date I funded the DG50, specifically to make these kinds of total return comparisons.)
And because of what took place over this past year, the DG50 essentially caught the overall market in total return over the 8-year history of the portfolio.
| COST 12/16/14 | VALUE 12/16/22 | DIFFERENCE | GAIN | |
| DG50 | $25,029.94 | $55,833.62 | $30,803.68 | 123.1% |
| VOO | $552.47 | $1,232.85 | $680.38 | 123.2% |
OK, so if the DG50 basically replicated VOO’s total return through all these years, wouldn’t investors have been smarter to have just bought VOO — or something similar, such as the SPDR S&P 500 Trust ETF (SPY) — and saved themselves the time and energy of dealing with individual stocks?
That’s reasonable, for sure. I would have never tried to talk anybody out of doing just that 8 years ago, and I wouldn’t try to talk anybody out of doing so now. It’s very important to remember that when I came up with the DG50, it was never intended to be a portfolio others should replicate. The project was always about discussing DGI concepts and presenting candidates for further research.
But if an investor did have the goal of building a growing income stream, a portfolio similar to the Dividend Growth 50 could accomplish that better than an S&P 500 fund — all while turning in a solid showing on a total return basis.
I wait until the end of each calendar year to do my DG50 income analysis, so look for that in my next article sometime in early January. Meanwhile, here’s some more on total return …
When I funded the Dividend Growth 50, the market was in the fairly early stages of an aggressive bull run. So VOO beat the DG50 in most year-over-year periods (each measured from one Dec. 16 — the portfolio’s anniversary — to the same date the following year).
| YEAR 1 | YEAR 2 | YEAR 3 | YEAR 4 | YEAR 5 | YEAR 6 | YEAR 7 | YEAR 8 | |
| DG50 | 5.0% | 12.2% | 15.3% | 1.1% | 22.8% | 11.4% | 19.5% | -0.6% |
| VOO | 5.7% | 11.3% | 20.9% | -0.9% | 25.2% | 18.1% | 27.8% | -16.2% |
However, as one can see, the DG50 also performed quite well most of those years — I’m not one to apologize for, say, “only” having a 22.8% gain in Year 5 — while outperforming in down years.
If a down year gets down enough, as was the case for the just completed 12-month stretch, an income-centric, value-oriented portfolio can (and did) vastly outperform major indexes. And such a stretch of superiority can (and did) greatly help the DG50 have competitive total return over the longer haul.
Here is the total return for each Dividend Growth 50 component since the portfolio’s inception:
| COMPANY | TICKER | POSITION COST DEC. 16, 2014 | POSITION VALUE DEC. 16, 2022 | TOTAL RETURN |
| Microsoft | (MSFT) | $506.61 | $3,082.85 | 508.5% |
| Deere | (DE) | $537.68 | $3,014.18 | 460.6% |
| Apple | (AAPL) | $546.32 | $2,988.41 | 447.0% |
| NextEra Energy | (NEE) | $511.79 | $2,053.52 | 301.2% |
| McDonald’s | (MCD) | $450.73 | $1,639.30 | 263.7% |
| Automatic Data Processing | (ADP) | $499.49 | $1,752.82 | 250.9% |
| Lockheed Martin | (LMT) | $559.74 | $1,915.60 | 242.2% |
| Visa | (V) | $515.69 | $1,747.60 | 238.9% |
| Caterpillar | (CAT) | $453.00 | $1,460.55 | 222.4% |
| Aflac | (AFL) | $466.81 | $1,338.57 | 186.8% |
| Hershey | (HSY) | $494.29 | $1,406.95 | 184.6% |
| Starbucks | (SBUX) | $486.25 | $1,372.25 | 182.2% |
| WEC Energy | (WEC) | $505.92 | $1,334.29 | 163.7% |
| McCormick | (MKC) | $512.22 | $1,339.73 | 161.6% |
| Carrier Global* | (CARR) | $100.76 | $257.93 | 156.0% |
| Target | (TGT) | $511.49 | $1,276.75 | 149.6% |
| PepsiCo | (PEP) | $473.97 | $1,128.39 | 138.1% |
| Chevron | (CVX) | $516.13 | $1,189.31 | 130.4% |
| ConocoPhillips | (COP) | $515.81 | $1,134.55 | 120.0% |
| General Mills | (GIS) | $520.06 | $1,139.04 | 119.0% |
| Genuine Parts | (GPC) | $517.47 | $1,107.54 | 114.0% |
| Becton Dickinson | (BDX) | $541.69 | $1,140.76 | 110.6% |
| Procter & Gamble | (PG) | $542.47 | $1,135.67 | 109.4% |
| Johnson & Johnson | (JNJ) | $522.42 | $1,088.28 | 108.3% |
| Qualcomm | (QCOM) | $497.77 | $1,025.73 | 106.1% |
| Southern Company | (SO) | $482.15 | $993.34 | 106.0% |
| Walmart | (WMT) | $507.15 | $1,014.10 | 100.0% |
| Realty Income | (O) | $511.45 | $1,018.41 | 99.1% |
| Emerson Electric | (EMR) | $483.00 | $958.53 | 98.5% |
| Coca-Cola | (KO) | $491.76 | $973.13 | 97.9% |
| J.M. Smucker | (SJM) | $497.97 | $968.33 | 94.5% |
| Raytheon Technologies* | (RTX) | $251.60 | $476.55 | 89.4% |
| Philip Morris International | (PM) | $496.05 | $900.01 | 81.4% |
| Clorox | (CLX) | $499.63 | $891.60 | 78.5% |
| Exxon Mobil | (XOM) | $533.26 | $906.07 | 69.9% |
| Otis Worldwide* | (OTIS) | $105.88 | $163.02 | 54.0% |
| Kimberly-Clark | (KMB) | $455.10 | $695.00 | 52.7% |
| Altria | (MO) | $502.85 | $735.09 | 46.2% |
| Baxter | (BAX) | $502.07 | $707.03 | 40.8% |
| Omega Healthcare | (OHI) | $497.82 | $693.80 | 39.4% |
| Colgate-Palmolive | (CL) | $478.12 | $655.36 | 37.1% |
| International Business Machines | (IBM) | $460.72 | $617.40 | 34.0% |
| AT&T | (T) | $489.14 | $569.53 | 16.4% |
| Verizon | (VZ) | $510.27 | $590.80 | 15.8% |
| Dominion Energy | (D) | $506.70 | $558.53 | 10.2% |
| Kraft Heinz | (KHC) | $479.55 | $493.01 | 2.8% |
| 3M | (MMM) | $483.82 | $466.68 | (-3.5%) |
| Wells Fargo | (WFC) | $483.00 | $465.16 | (-3.7%) |
| Healthpeak | (PEAK) | $494.25 | $410.93 | (-16.9%) |
| Walgreens Boots | (WBA) | $513.82 | $346.06 | (-32.7%) |
| Kinder Morgan | (KMI) | $505.31 | $339.75 | (-32.8%) |
| General Electric | (GE) | $500.99 | $156.08 | (-68.9%) |
| TOTALS | $25,029.94 | $55,833.62 | 123.1% |
Notes & Observations
*In April 2020, United Technologies spun off Carrier and Otis and then merged with Raytheon, so the DG50 ended up with RTX, CARR and OTIS. When the costs of Raytheon, Carrier and Otis in the table above are added together, it equals the $458.24 that I spent on the original United Tech position. Combined, the 3 were worth $897.50 at market close of 12/16/22 — a 95.9% total return on the original UTX buy.
With the additions of Carrier and Otis, the DG50 actually has 52 positions. That probably sounds weird … but no weirder than the Big Ten Conference having 14 (and soon 16) universities.
Other companies have temporarily joined the DG50 due to mergers, acquisitions and spin-offs. But over time, I liquidated those positions and used the cash to increase the stakes in the original companies. Most recently, I sold the Warner Bros. Discovery (WBD) shares received in the AT&T merger to buy more T, and sold the Orion Office REIT (ONL) shares received in the Realty Income spin-off to buy more O.
DG50 rules allow dealing with such corporate activities on a case-by-case basis. Otherwise, as the portfolio’s rules stated:
There will be absolutely no buying or selling … and all income will be reinvested into the companies that paid the dividends. This will be a passive portfolio – classic buy-and-hold.
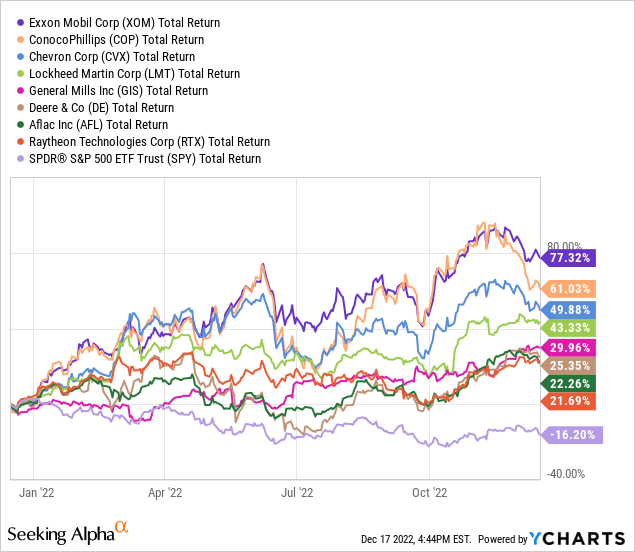
The last 12 months were huge for energy companies, which had been some of the DG50’s biggest laggards. Exxon Mobil led the way, with ConocoPhillips and Chevron also showing strongly. Defense contractors Lockheed Martin and Raytheon had a robust year, as did General Mills’ turnaround story. Deere and Aflac were 20%+ total-return winners, too.
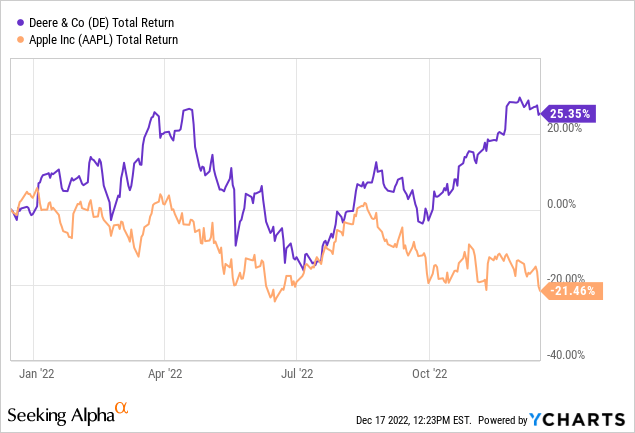
After 7 years, Microsoft and Apple appeared to be running away from the rest of the DG50, but 2022 has not been kind to growth stocks and both have pulled back. MSFT is still No. 1 on the DG50 charts, but Deere outperformed Apple by a mile this past year to leapfrog the iPhone maker into second place in total return.
In all, 18 DG50 positions outperformed VOO in total return over the past 8 years. Those big gainers have come from a variety of sectors: technology, industrials, consumer discretionary, consumer staples, financials, energy, even utilities.
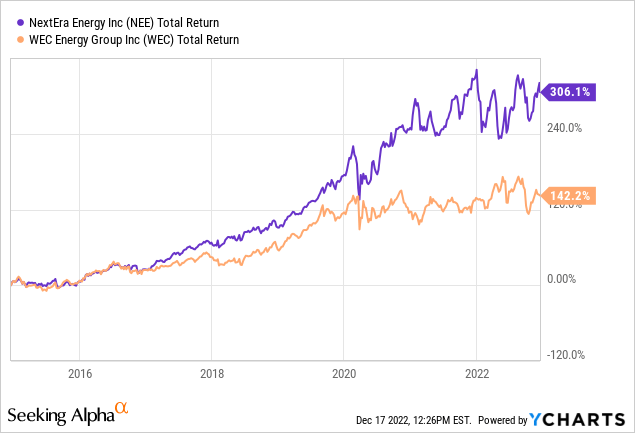
Utilities often are looked at as boring, underperforming companies … but the DG50 has two “growthy” market-beating utilities in NextEra and WEC.
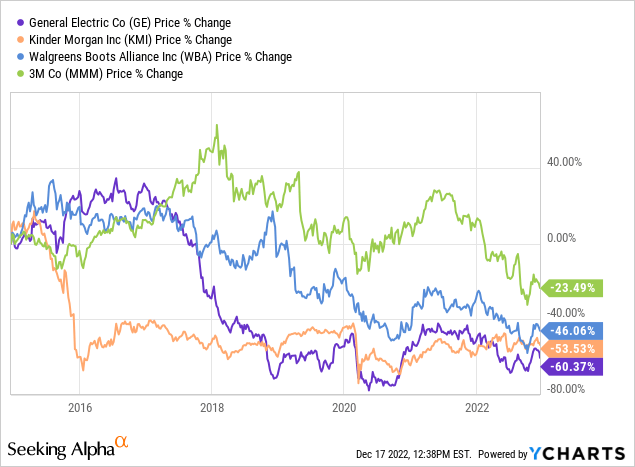
Six positions had negative total return over the 8-year span, even after dividends were reinvested. GE and KMI have been disasters for most of the portfolio’s existence, while Walgreens and 3M have only become lousy investments in recent years.
The way I’ve managed the Dividend Growth 50 (as mandated by portfolio guidelines) differs substantially from how most DGI practitioners I know — including me — handle their own portfolios. While some are very active, many (perhaps most) take a “buy-and-monitor” approach. They have rules about when they’ll sell, such as when a company cuts or freezes its dividend, and that helps prevent them from sticking with clunkers the way the DG50 had to keep the likes of General Electric and Kinder Morgan.
For example, in my personal portfolio, I sold all of my GE and most of my KMI long before their dividend cuts. I also sold Kraft Heinz before its cut, dumped most of my AT&T before it reduced its dividend, divested my Dominion position shortly after its cut, sold Walgreens and Omega when their business models started showing troublesome signs, etc. I used proceeds from those sells to increase my stakes in companies I considered more promising, such as Microsoft, Apple, NextEra Energy, Pepsi and Starbucks.
Some stocks I stayed with through thick and thin. With Chevron I was rewarded for my patience through its cycles, but 3M (which I only recently dumped) did me no favors.
Gaining Confidence From DGI
No two DGI practitioners handle their portfolios the exact same way. One of the things I appreciate about the strategy is there are so many approaches one can use. I like to say that there are a lot of ways to “win” using Dividend Growth Investing.
And then there’s the confidence factor: When one focuses on high-quality companies that have been growing dividends for years, one is less concerned about daily price action, macro conditions, political shenanigans and other “noise” — the stuff that can cause undisciplined or emotional investors to churn their portfolios.
Many folks who were hurting in 2009 in the aftermath of the Great Recession became financially comfortable — or even wealthy — over the next decade-plus by using DGI as their primary strategy. In addition to competitive total return, DGI gave them the confidence to stay invested while also building reliable income streams for their retirement years.
That doesn’t mean DGI proponents always avoid owning clunkers. Every investor, including Benjamin Graham, Warren Buffett and Peter Lynch, has had some of those. Show me an investor who claims to have never had ’em, and I’ll show you a liar. But a few clunkers need not ruin a portfolio — as the DG50 definitely has demonstrated.
Conclusion
Those who have read my work during my decade-plus writing for Seeking Alpha know that it’s not my style to “pound the table” on stock recommendations. I simply discuss what I’m doing and why, and I trust that my readers are intelligent enough to conduct their own due diligence and to make their own informed decisions.
So obviously, the Dividend Growth 50 was an experiment right from the start, not a suggestion that folks plunk down their money on those 50 stocks back in December 2014. Still, it has turned out that doing so would have been a pretty good way to score total return along with reliable, increasing income.
I’ll be back early in the new year with a look at the DG50’s income growth. Despite some of the economic doom and gloom out there, 2022 has been a good year for dividend increases, and I’m looking forward to sharing that information in my next article.
Be the first to comment