

phototechno
Written by Nick Ackerman, co-produced by Stanford Chemist. This article was originally published to members of the CEF/ETF Income Laboratory on November 28th, 2022.
Nuveen S&P 500 Buy-Write Income Fund (NYSE:BXMX) has provided some shelter for investors on a YTD basis relative to the broader market. Essentially, BXMX invests similarly to the S&P 500 Index and then writes calls against the index.
At the same time, it pays out a substantially higher distribution yield relative to the S&P 500’s dividend yield. It’s important to consider that BXMX can generate additional capital gains through collecting premiums, which can also limit the upside in strong bull markets.
On a YTD basis, the call writing worked out incredibly well, with BXMX declining less than the S&P 500. However, different portfolio positioning and the fund going to a premium also contribute to this result. BXMX has roughly half of the number of holdings than the index. In particular, the fund going from a discount to a premium has really helped out the share price performance, too.
That’s what really makes it a pass for now, as the fund is trading near historic highs in terms of its discount/premium. I’d wait for a pullback in the valuation before wanting to make any consideration of adding.
The Basics
- 1-Year Z-score: 1.48
- Premium: 3.44%
- Distribution Yield: 6.98%
- Expense Ratio: 0.90%
- Leverage: N/A
- Managed Assets: $1.316 billion
- Structure: Perpetual
BXMX’s investment objective is to “seek attractive total return with less volatility than the S&P 500 Index…” They intend to achieve this through “…investing in a global equity portfolio that seeks to substantially replicate the price movements of the S&P 500 Index and by selling index call options covering approximately 100% of the Fund’s equity portfolio value with a goal of enhancing the portfolio’s risk-adjusted returns.”
The fund’s expense ratio is relatively low for a closed-end fund, which is often the case with call writing funds. That’s another potential reason why they can be quite popular with income-seeking investors in the CEF space. On top of this, they aren’t leveraged, which can be another benefit during volatile times when other CEFs get hit particularly hard.
The fund is a sizeable fund, too, with over $1 billion in assets managed – that’s a particularly large fund in the CEF space.
Writing against indexes rather than covered call funds which write calls on underlying positions, has a few different considerations. However, the primary and most noteworthy difference is the cash-settled factor for index writing. Essentially, the losses can be theoretically unlimited because an index can rise to infinity. They can’t be “covered” directly because an index can’t be owned directly.
In practice, though, it isn’t as bad as it first sounds. That’s because BXMX and many other index-writing funds either hold directly or substantially cover what mirrors the index. Therefore, as the index rises, the underlying holdings rise. It is essentially a hedge against the infinite loss scenario.
Performance – Good Results, Poor Value
The results YTD can be seen as quite attractive. This is particularly true on a total share price return basis. Even the total NAV return results are better than the index.
Ycharts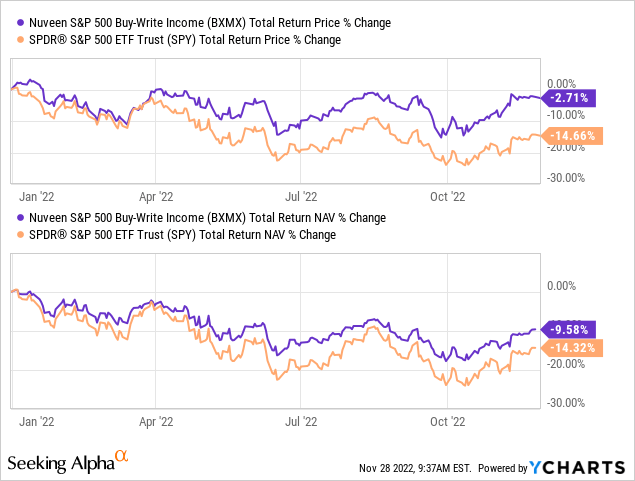
Writing calls can be slightly defensive as it provides a hedge. The fund collects a premium. Thus, the amount of premium collected can offset a bit of the decline. In a rapidly falling market, the premiums can’t really be expected to cover all the declines. On the other hand, a flat market can be a source of gains that wouldn’t otherwise be there in a non-option writing fund.
This outperformance has played out for longer than just a YTD basis. Since my last update over a year ago, BXMX has shown to provide a higher total return.
BXMX Performance Since Previous Update (Seeking Alpha)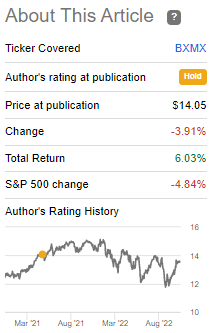
It isn’t only the fund’s options writing strategy that seems to be paying off, though. Below we will discuss how the portfolio is positioned differently while still largely mirroring the broader S&P 500.
The other major factor in providing such a significant outperformance on a total share price basis has been the fund going from a discount to a premium. I believe that is the primary driver of the results we are seeing.
In the last article going back to May 2021, the fund was trading at an 11.31% discount. That would have resulted in the total positive returns we see above. Below is the YTD change in the fund’s discount to a premium now.
Ycharts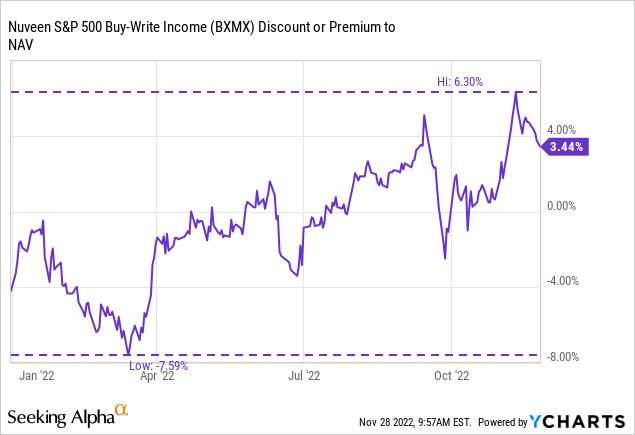
YTD, the move has been substantial. However, over the longer term, it is unprecedented for this fund. Besides, when the fund first launched back in 2004, this was near an all-time high premium. That’s what makes me find it particularly unattractive at this time and not worth considering.
Ycharts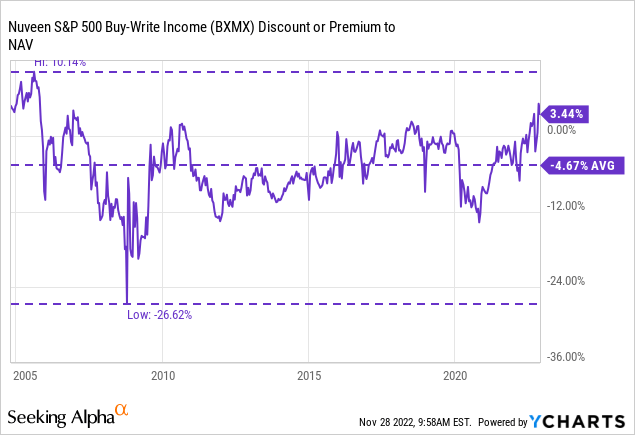
As an alternative, Eaton Vance Tax-Managed Buy-Write Income (ETB) could be a consideration. They recently cut their distribution, and that saw shares come down. It is still trading at a premium, but since 2015, this has been relatively normal.
There are plenty of choices in CEFs and ETFs that utilize option writing to their benefit. However, ETB and BXMX come to mind as they focus on the S&P 500 Index more specifically and write index calls.
That brings me to another potential fund to consider, the First Trust Enhanced Equity Income Fund (FFA). This fund is slightly different in that it writes covered and index calls. However, they mostly stick with an S&P 500-esque portfolio. So it isn’t completely different; it also trades much closer to its average discount of the last decade.
Ycharts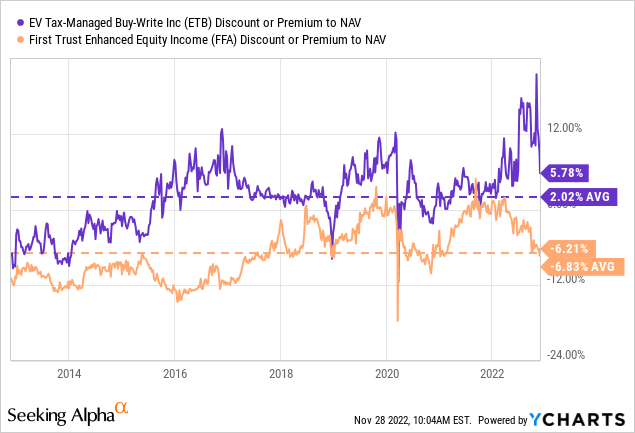
Distribution – Attractive Yield
Unlike ETB, FFA was already paying a lower relative distribution yield at a more reasonable level. That’s primarily because they’ve cut many times over the last decade to arrive where they are now. However, they did raise it earlier this year.
BXMX Distribution History (CEFConnect)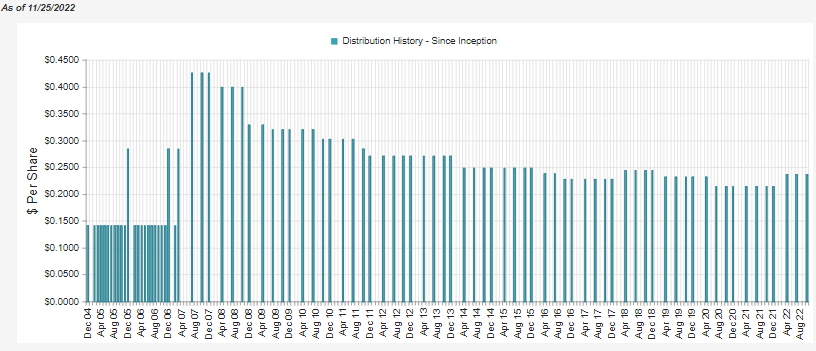
The latest distribution yield works out to 6.98%, with a NAV yield of 7.22%. The NAV rate is quite reasonable, and the share price distribution rate is also quite attractive, relatively speaking.
At the same time, the fund will require significant capital gains to fund its distribution. Meaning that the longer and deeper this bear market goes, the harder it will be to fund the current rate.
The latest semi-annual report showed a decline in net investment income, so they aren’t getting any help on that front.
BXMX Semi-Annual Report (Nuveen)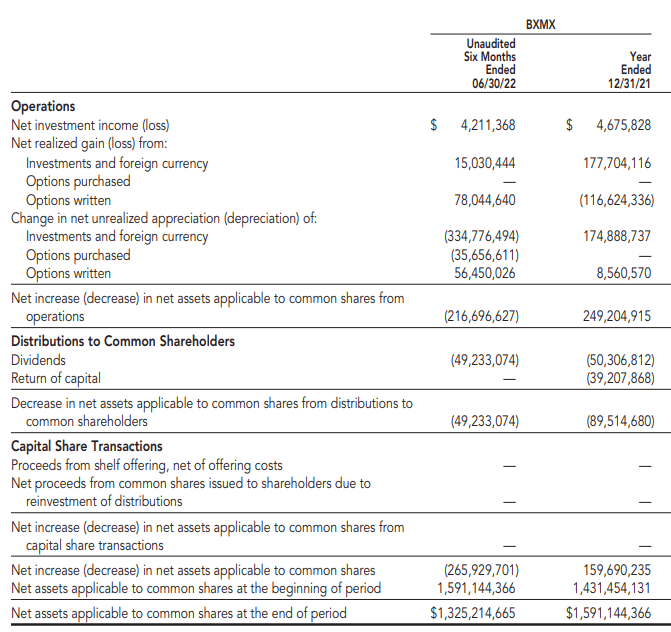
What we can see, though, is that the options written have generated more than enough capital gains to fund the distribution easily. They’ve generated over $78 million and paid out $49.233 million. That means that they should be able to fund the current distribution for the foreseeable future if they can generate those sorts of premiums in a bear market.
Unfortunately, what we see is that the unrealized depreciation has more than offset those results, which is ultimately why the fund has declined this year overall.
Additionally, we can see that in a strong year such as 2021, the fund generated losses of $116.624 million from the options written. The realized and unrealized gains more than offset that figure. However, it does highlight why writing calls, and more specifically, writing index calls, can be a hindrance to performance.
This is easy to see because, in most of the last decade, the market has been in a mostly strong bull market. The performance between the BXMX and the SPRD S&P 500 ETF (SPY) isn’t even close. This is much more than just a higher expense ratio to cause this type of difference in performance.
Ycharts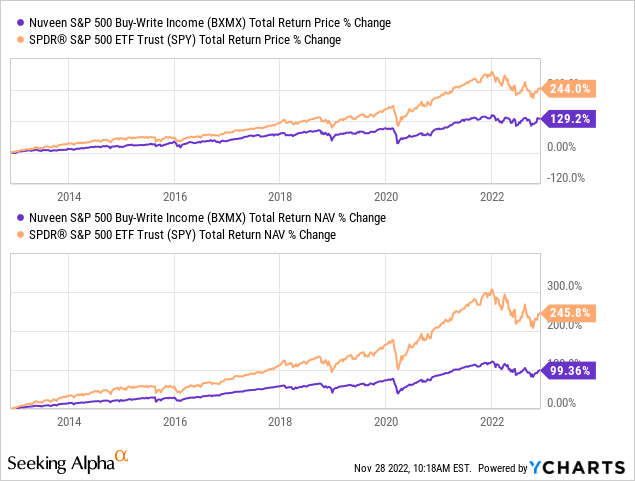
There can be another benefit from losses being realized, though. That would be when it comes to taxes. In each of the prior two years, BXMX had classified a meaningful portion of their distribution as return of capital. ROC isn’t taxed in the year it is received, but it reduces an investor’s cost basis. In this way, the taxes are deferred until the position is sold.
BXMX Distribution Classifications (Nuveen)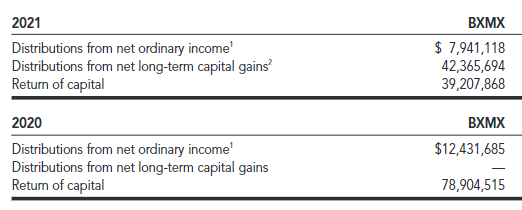
For 2021 and 2020, the ROC would technically not be considered destructive ROC as the NAV of the fund rose in those years.
BXMX’s Portfolio
One of the important considerations is that while the fund mirrors the S&P 500 Index quite heavily, it does so with significantly fewer holdings. 99% of the portfolio is invested in large-cap holdings. However, the number of holdings comes to 264. The S&P 500 Index carries just over 500 (extra for different classes of stock.)
Even though there are fewer holdings than the index, the largest sector weightings are still fairly close.
BXMX Top Sector Exposure (Nuveen)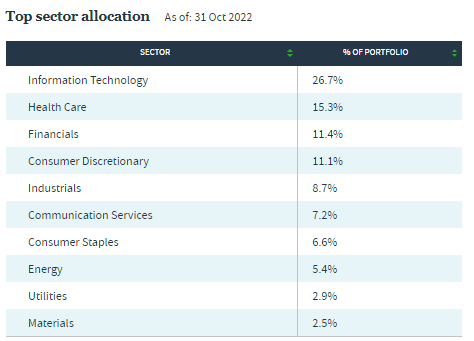
SPY last listed their tech weighting at 26.29%, healthcare at 15.21% and financials at 11.71%. Overall, I believe this is important for the hedging factor and the infinite loss potential for writing index calls. If they were holding a wildly different portfolio, there would be a greater chance that the index could rise while the underlying portfolio may not.
When looking at top positions, we see a similarity too. However, the top ten of BXMX is 31.1% compared to SPY’s 25.11%. So, in that case, we can see the implications of having fewer positions. Every position will have a slightly higher weighting overall when compared to SPY.
BXMX Top Ten (Nuveen)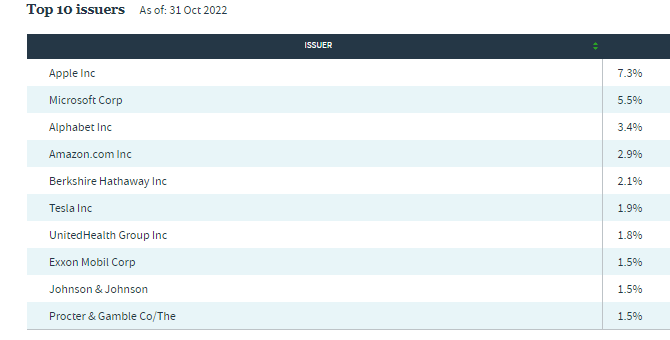
Of course, we have a direct mirror in the top positions of Apple (AAPL) and Microsoft (MSFT). The first difference we see, which is fairly immaterial, is that Alphabet (GOOG) is in a higher allocation than Amazon (AMZN); for SPY, these two positions are reversed. However, SPY also holds Alphabet in a top position, whereas BXMX does not. It is still a position in BXMX, but at a smaller weight to keep it out of the top ten.
All the other top position differences are quite similar. Just small differences in the weightings of each position, but all are quite similar. To replace GOOGL in the top ten for BXMX, we see Proctor & Gamble (PG) show up.
Conclusion
BXMX is largely a mirror of the S&P 500 – with a reduced number of holdings. On top of this, the fund employs an options overlay on 100% of the portfolio through index call writing. Rapid losses such as we’ve seen in 2022 aren’t going to offset all the losses, as we’ve seen. However, it can help limit declines to some degree. It can also be beneficial in a flat market as a means to generate gains. This strategy can also lead to weaker results in times of a strong bull market, which is what we’ve seen for most of the last decade.
All this said, BXMX is trading at a rich valuation relative to its history. There are many other considerations in CEFs and ETFs that similarly utilize an options writing strategy. Other funds that come to mind are ETB and FFA, which could be considered at better current valuations.
Be the first to comment