

Pgiam/iStock via Getty Images
The buying levels in the ProShares inverse S&P 500 fund (NYSEARCA:SH) is one of the nine sentiment indicators that goes into our Master Sentiment Index, which is explained (here). The nine indicators are listed here (% buying levels of SH is listed as the fourth indicator below):
- 5% CBOE Total Puts and Calls Ratio
- 5% CBOE Equity Puts to Calls Ratio
- The CME Commitment of Traders data on the S&P futures
- % Buying in the ProShares S&P 500 Inverse Fund
- NAAIM Exposure Index (National Association of Active Managers)
- Hulbert Rating Service (Stocks)
- Hulbert Rating Service (Nasdaq)
- The AAII Sentiment Survey
- Investors Intelligence Survey
Buying in this inverse fund acts as a contrary opinion indicator. This article covers SH, the current buying levels in this ETF, total assets and shares outstanding in the ETF as well as a graphical history of its NAV. The expected performance of this fund is 90% determined by the expected performance of the S&P 500, but in an inverse way.
Current Buying Levels in SH
The first graph plots the average daily buying in SH as a percent of assets. History clearly shows that peak buying normally occurs, not before a decline, but after the decline near the bottom. As the chart shows normally buying levels peak and then rapidly fall away. These are the red spikes you see. This bear market has been different, however, in that buying has stayed at a high level for a considerable period of time. The current level of buying is still high, which is easier to see on the second chart.
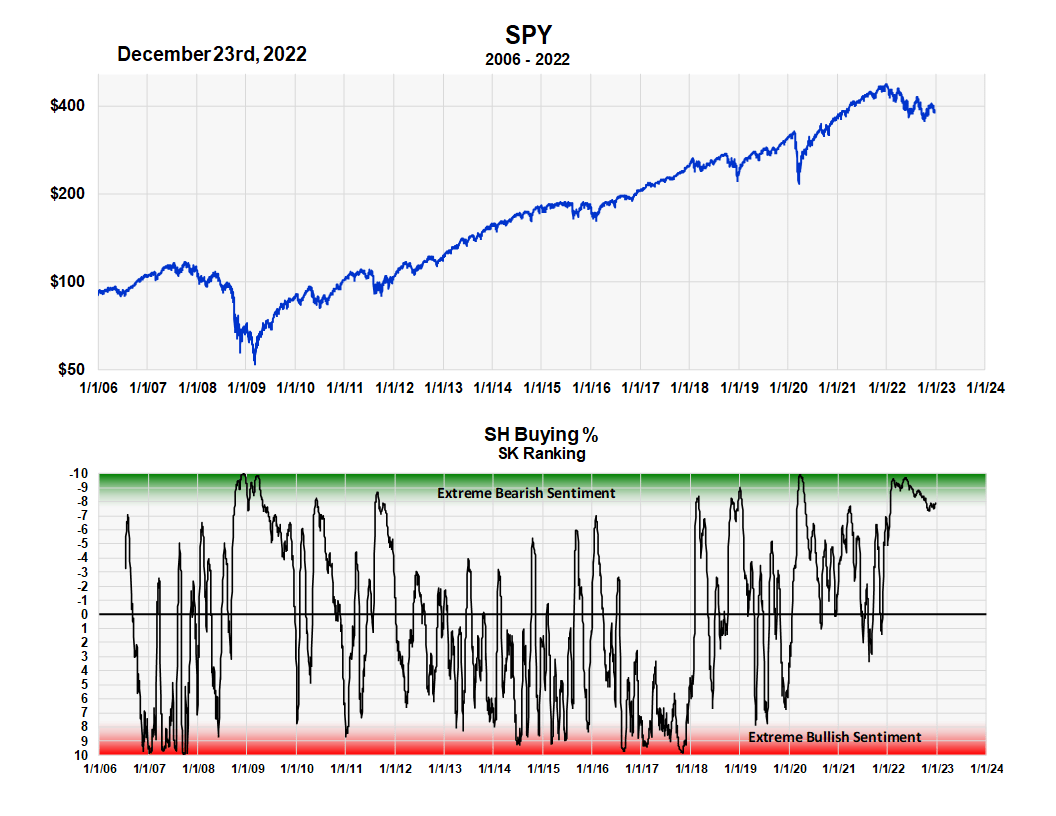
The second chart plots % buying in SH on our Sentiment King ranking scale. The SK ranking scale is a mathematical procedure that allows us to put all the various indicators on the same scale so that they can be compared. The graph shows that the current level of buying is still near the green area, which represents the varying degrees of extreme bearish sentiment.
Buying levels in SH (Michael McDonald) Buying levels in SH graphed on the Sentiment King Ranking Scale (Michael McDonald)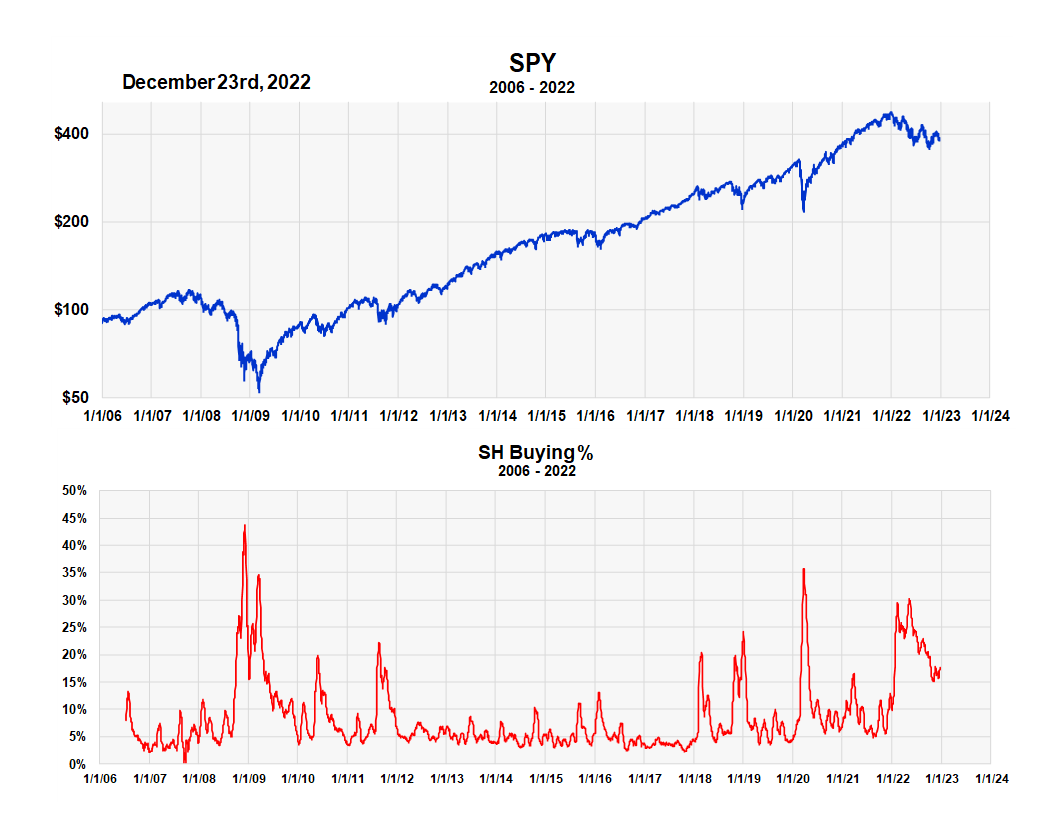
SH – Net Asset Value
The next chart graphs the 18-year history of the net asset value of SH. the long-term decline and this fund is due primarily to the secular bull market we’ve had since it was established as well as a slight negative bias to short positions that try to duplicate the inverse of the S&P 500. The fund is up 17.4% since December 31st of last year.
Net Asset Value of SH (Michael McDonald)
SH – Shares Outstanding
The next chart plots the number of shares outstanding since inception. It’s currently about 200,000,000 shares. History shows that shares tend to rapidly grow into a bear market reaching peak levels usually near the bottom. And then shares contract as investors leave it when the next bull market develops. It’s unclear to us at this time whether October’s reading of 245,000,000 shares was that peak for this bear market.
Shares Outstanding of SH (Michael McDonald)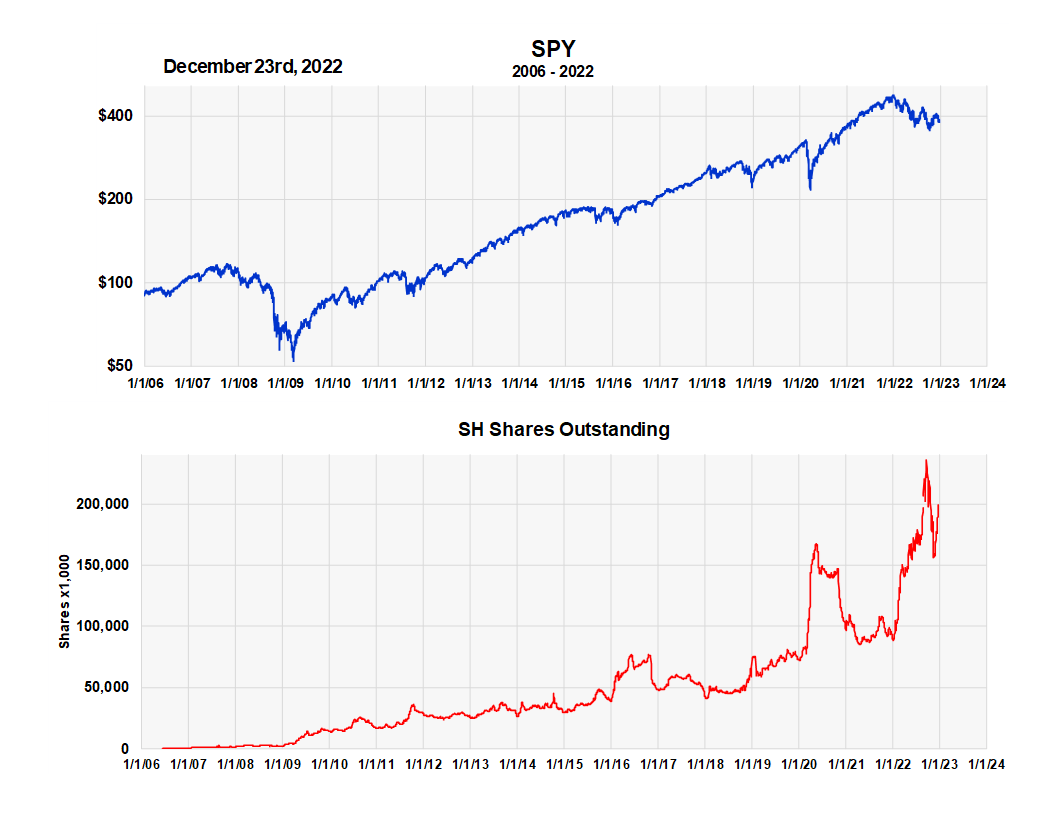
SH – Total Assets
Total assets reached a peak in October at $4 billion dollars, then rapidly fell to $2.5 billion before rising again to about $3.2 billion. The chart clearly shows that assets peak at price lows in the market, but we are not yet convinced that October was the final peak.
Total Assets of SH (ProShares)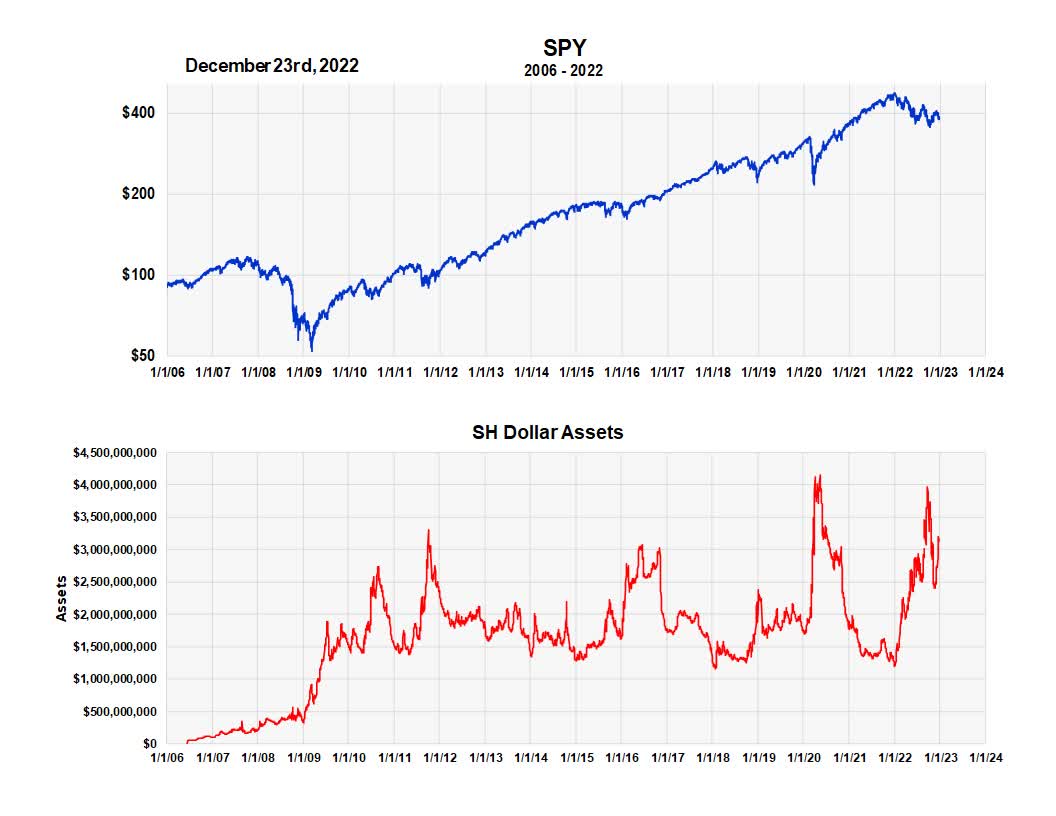
Summary
The expected performance of this fund is 90% determined by the expected performance of the S&P 500, but in an inverse way. In general, high levels of bearish market sentiment, including high buying levels in SH, point to higher prices for the S&P 500 and therefore lower prices for SH. However, we would prefer to see shares outstanding and total assets reach higher levels to confirm this.
Be the first to comment