

ayala_studio
The best time of the year to own gold historically over the last 20 years (January 2002 to December 2021) is between the middle of December and end of February. The average gain is +6.7% over this 11-week span, more than half of the gain witnessed over the entire calendar year.
In addition, the greatest odds of gold “outperformance” vs. the S&P 500 are evident over the same seasonal period, using the last two decades of data. Believe it or not, gold has beaten equity returns by +5% over this calendar time frame since the start of 2002. Following this almost 3-month span, stocks have historically flipped the script, outperforming gold over the remaining 9+ months.
The Equity Clock website draws basic charts of seasonal patterns in a variety of assets. The 20-year gold cycle “average” is pictured below. I have marked with circles the beginning and end of this seasonal-strength idea.
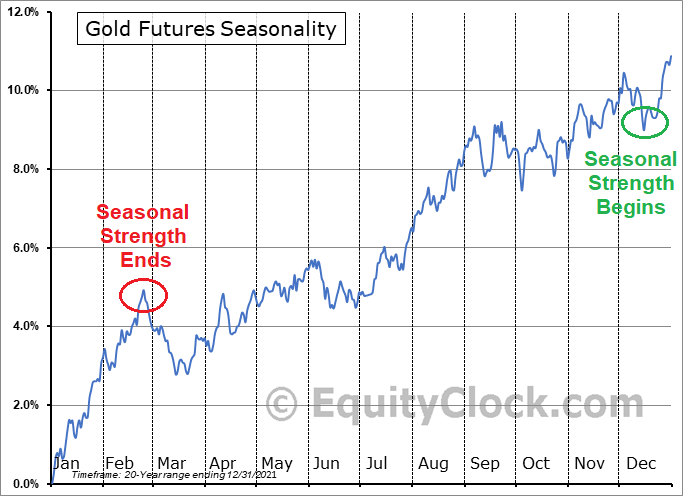
EquityClock.com – Seasonal Gold Trends with Author Reference Points
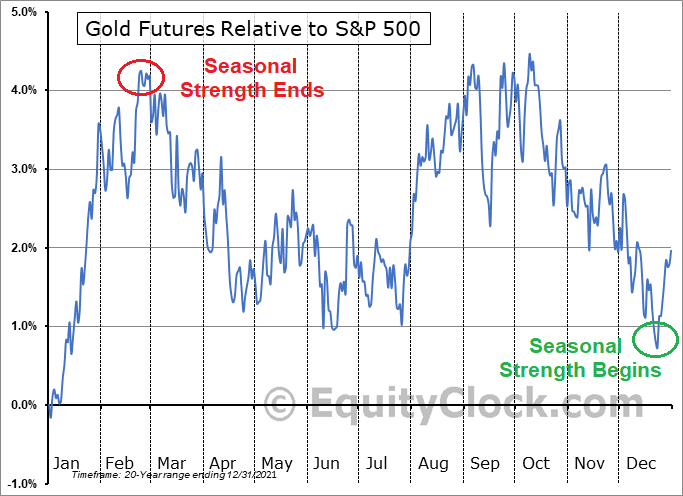
EquityClock.com – Seasonal Gold Trends vs. S&P 500, with Author Reference Points
Notice that overall stock gains, including dividends, were only been able to rise slightly faster than gold between the ends of 2001 and 2021, at +2.0% for an annual rate. When we include the 20% bear market in stocks during 2022, this advantage number from December 31st, 2001 would almost be cut in half.
You heard me right. Gold buried in your back yard has risen in price at essentially the same rate as U.S. equity market total returns over the last two decades! Believe it or not, measured from June 2002, the two asset classes are effectively TIED for total return performance. [Warren Buffett, CNBC, and the WSJ do not and will not advertise this fact. If equities are only keeping up with general monetary inflation, what’s the point pushing stock investments?]
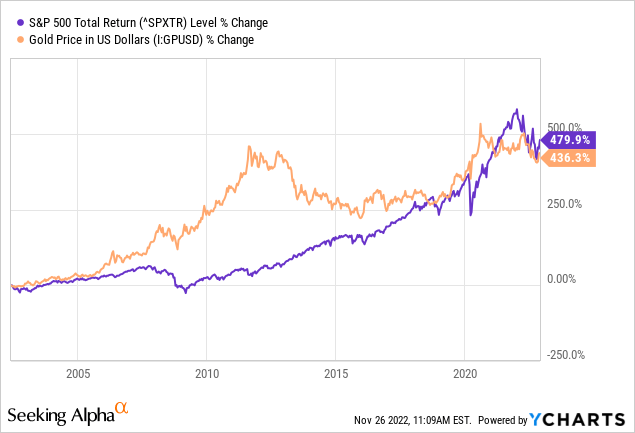
YCharts – Gold vs. S&P 500 Total Return, Since June 2002
Lease Rate Picture = Tight Physical Market
A second reason to get really bullish on gold today is seen in the implied lease rate market for bullion loans. Brokers and banks trade and borrow gold from each other daily, often outside of futures market reporting or away from the world’s main physical London exchange. Like any other asset, interest rates are charged. Borrowing costs and expectations for price changes in the immediate future are largely reflected in various market pricing. When major holders are wanting to sell gold, the overhead supply is well understood by the marketplace. When a surplus exists, little futures market premium (or even negative loan rates during the pandemic) are the net result for contracts priced months or years into the future for delivery or swap expiration.
Below are 2-year and 10-year charts of lease rates to review. The spike in October to decade high lease rates, especially on the shorter end for duration smacks of a lack of physical supply. Effectively, more gold buyers than sellers in large volume now exists. Stories of a modern-record central bank accumulation spree in the second half of 2022 have emerged (55-year high), corroborating tight physical supplies indicated by high lease rates.
I have circled in red below the last two spikes in lease rates to multi-year highs, led by short-duration tightness. Late 2015 and early 2019 each proved terrific times to jump into gold investments. Will history repeat?
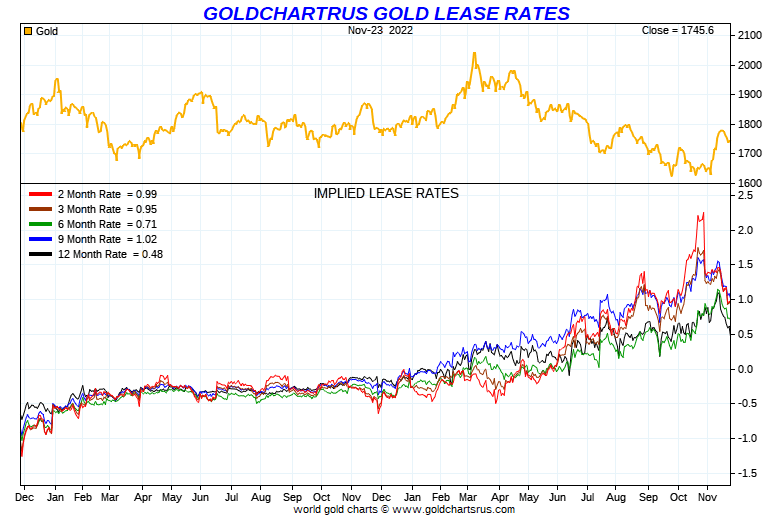
Goldchartsrus.com – Gold Price vs. Lease Rates, 2 Years
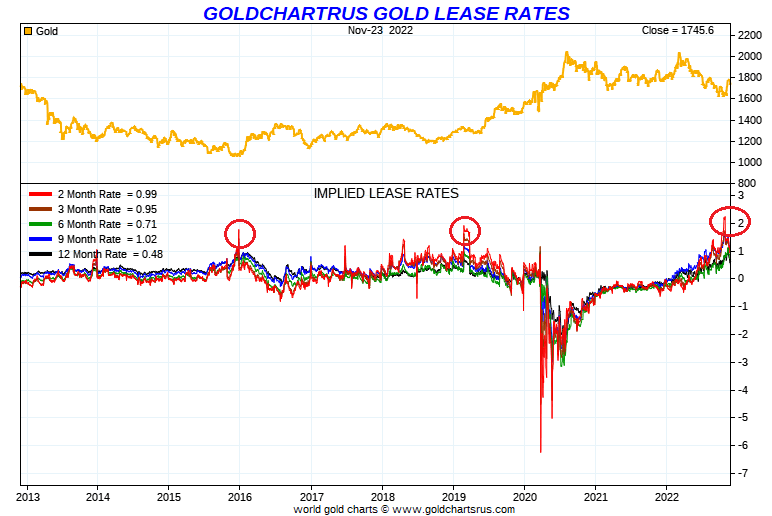
Goldchartsrus.com – Gold Price vs. Lease Rates, with Author Reference Points, 10 Years
U.S. Dollar Strength Hiding Gold Gains
A third bullish argument for gold has to do with the incredible advance in underlying U.S. dollar value since the middle of 2021. While gold has been shunned by Wall Street and main street American investors alike as a smart asset choice in 2022, that has not been the case overseas. Sure, gold in U.S. dollars is down slightly on the year. However, a super-positive gold climb priced in foreign currencies has taken place. U.S. weakness has been entirely a function of outlier relative strength in the paper currency markets for our dollar vs. other global creations. Below are 5-year graphs of this situation. The U.S. Dollar Index (economic trade-weighted vs. foreign fiats) has experienced its strongest upmove (up +30% since May 2021) since 1985, holding the gold tiger back for a spell. Once the shackle of dollar currency gains is loosened, a massive run higher in U.S. gold could arrive in 2023.
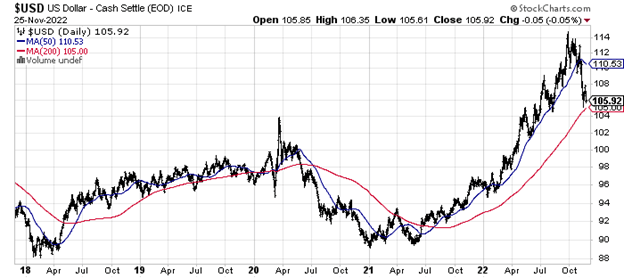
StockCharts.com – U.S. Dollar index, Federal Reserve, 5 Years of Daily Price and Volume Changes
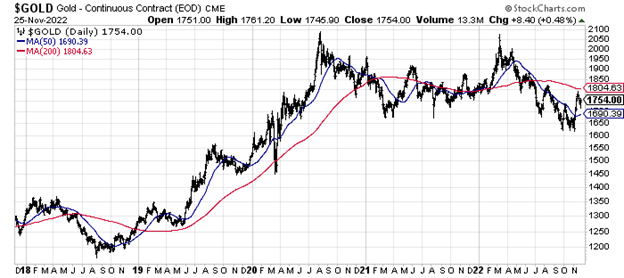
StockCharts.com – Nearby Gold Futures, 5 Years of Daily Price and Volume Changes
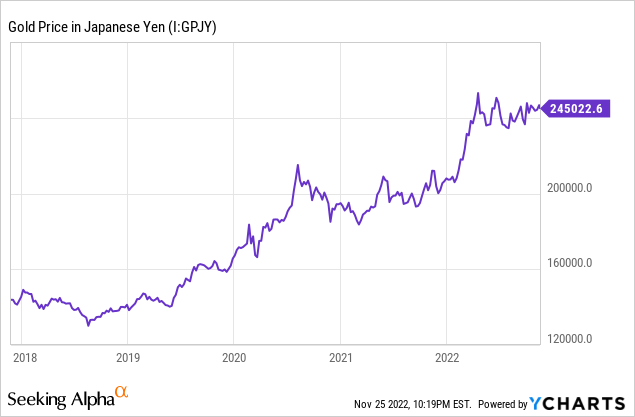
YCharts – Gold Priced in Japanese Yen, 5 Years
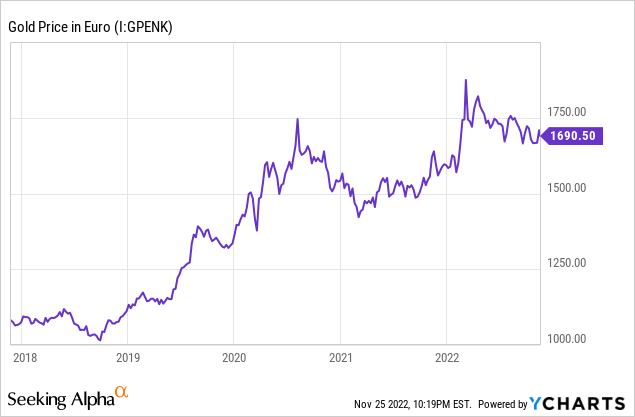
YCharts – Gold Priced in EU Euro, 5 Years
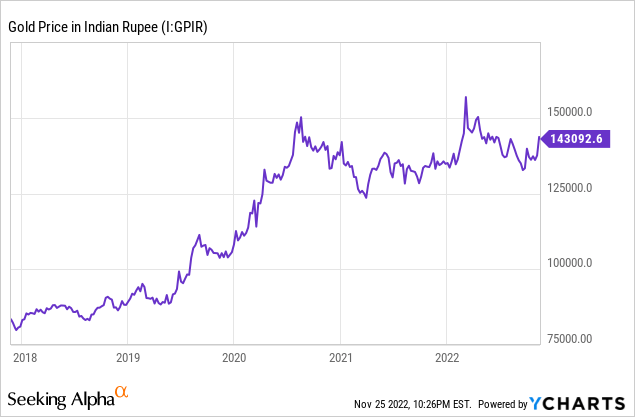
YCharts – Gold Priced in Indian Rupee, 5 Years
Gold As Money Printing Hedge
A fourth bullish argument is gold prices in the U.S. and world have not been keeping pace with paper money creation for years. In numerous articles I have written on Seeking Alpha, I have explained how monetary metals fluctuate in a grand puzzle of changing economic variables. Gold specifically holds an unparalleled history of tracking growth rates in outstanding M2 money stock and U.S. Treasury debt/IOUs over the decades. Gold is, therefore, the truest of monetary metals. Its main job and purpose in the world are to maintain value (vs. inflation and money printing) over time for banks, governments, the wealthy, and hedge-conscious investors.
Using data back to the late 1960s (a few years before we officially left direct gold convertibility for paper dollars), I continually monitor and adjust gold prices as a function of relative valuations to financial considerations like money in circulation, the pricing of other commodities, and measures of wealth like the stock market. If gold is the base currency our fractional reserve banking system is built upon, it should retain value vs. such over many years.
My research suggests gold’s real-world valuation in U.S. dollars should be above $2800 an ounce today. I am using a math technique of annual median averages since 1969 to reach this conclusion, where half of the time gold should trade higher than $2800 and the other half under this price point.
Let me illustrate. Below are charts using similar scales for U.S. M2 increases and Treasury debt issuance, matched against the U.S. gold price. Both charts are doing what you would expect, with gold rising at long-term clips in near lockstep. M2 represents current money printing levels (dollar devaluations vs. tangible assets), while Treasury debt is the future requirement for paper money levels to prevent an economic collapse (hard default by Uncle Sam), all other economic variables being equal.
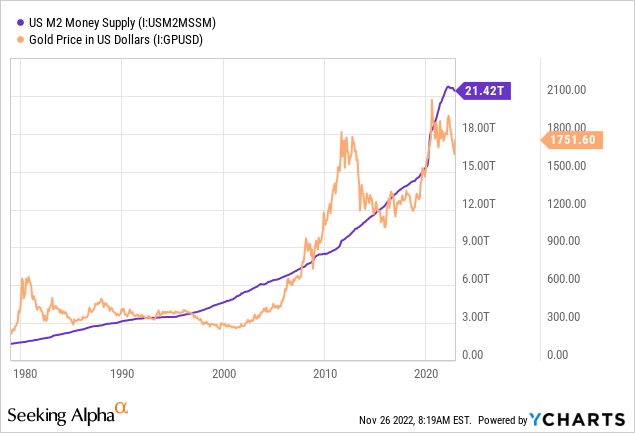
YCharts – U.S. Base M2 Money Supply vs. Gold Price, Since 1979
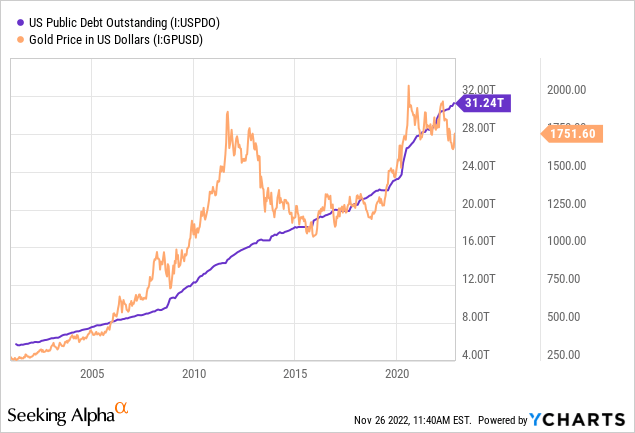
Charts – Total U.S. Treasury Debt vs. Gold Price, Since 2001
Final Thoughts
I own a number of gold bullion ETFs in my portfolio and have increased their weighting size in recent trading sessions. The seasonal “average” chart says a better buy point may exist in a few weeks. However, I am in no mood to wait on this gold bull position, as indications of physical market tightness should not be ignored. My favorite bullion-related choice for long-term investment, with decent liquidity (the second biggest U.S. gold ETF by AUM) and low annual management expense (0.25%) is the iShares Gold Trust (NYSEARCA:IAU) product.
For IAU in particular, extremely light trading volume since the end of summer (boxed in blue below) highlights retail and institutional investors have given up on gold. There are a number of sentiment and chart-pattern similarities for IAU to the important second-half 2018 bottom in price. I have circled in green the last time trading volume in iShares Gold was minimal just as buying interest turned positive, measured by the 14-day Money Flow Index. The 2018 U.S. gold price also outlined a 52-week low later in the calendar year, which has not happened since. 2018’s bottom proved to be the foundation for a powerful 2-year rally.
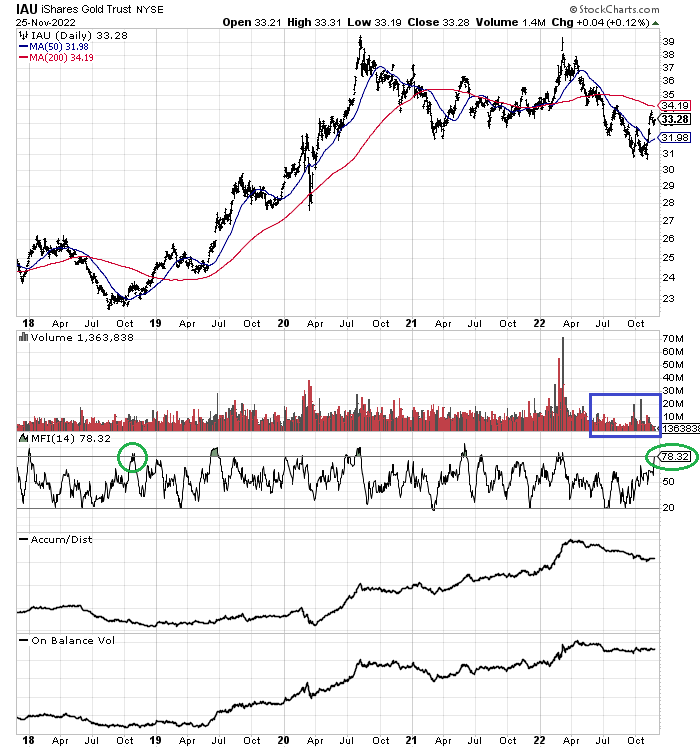
StockCharts.com – IAU with Author Reference Points, 5 Years of Daily Price and Volume Changes
My macro forecast (with odds as high as 50% in my research) is a recession will become evident into late January, as corporate Q4 numbers are released. Another round of stock market selling in the 15% to 20% loss range could easily be next. The rapid and extreme inversion of the Treasury yield curve is hard to ignore during November. Ramifications are not always immediate for the economy and stock market, but more limited inversions have existed since the spring. Add to this bond market tell of trouble ahead, a solid bump higher in equity investor optimism during November, and predictions of some sort of Wall Street selloff do not appear farfetched.
March bottoms after sharp bear markets and/or multi-year selloffs are somewhat common as psychology looks to spring and the rebirth of life generally. As examples, the pandemic panic bottom of 2020 and Great Recession equity low were both reached in March. So, the seasonal forecast of gold outperformance into March fits in nicely.
A move above all-time highs for gold in U.S. dollars closer to $2100 an ounce is entirely possible by March (19% gain from $1754 currently). So, when you contemplate the potential for a sizable decline in the stock market vs. a spike in gold over the next three months, it is exceedingly clear to me investors should seriously consider going overweight precious metals into year’s end (including silver and platinum, as the glittery monetary metals tend to move together). I personally hold better than 20% of my actively-managed financial portfolio in a well-diversified list of precious metals bullion and miner positions. IAU is one my biggest gold-related holdings, and I rate it a Strong Buy today.
Thanks for reading. Please consider this article a first step in your due diligence process. Consulting with a registered and experienced investment advisor is recommended before making any trade.
Be the first to comment