

pichitstocker
New Fortress Energy (NASDAQ:NFE), which owns and operates natural gas and LNG infrastructure and delivers energy to global markets through its vessels and logistics assets, is in a position to benefit from the increasing domestic and foreign demand for U.S. natural gas and LNG. Since the beginning of the year, the stock’s price increased by more than 120%, and due to the company’s recent developments, NFE stock price will increase further. Recently, the company announced it has finalized its agreements with Mexico to expand and extend NFE’s supply of natural gas to multiple power generation facilities in Baja California Sur, to sell its 135 MW La Paz power plant, and to create a new FLNG hub. These agreements will improve the company’s financial results in the following years. The stock is a buy.
Quarterly results
In its 2Q 2022 financial results, NFE reported revenues of $585 million, compared with 1Q 2022 revenues of $505 million, driven by increased operating revenue, partially offset by lower vessel charter revenue. Total operating expenses of New Fortress increased from $339 million in 1Q 2022 to $451 million in 2Q 2022, driven by higher cost of sales and asset impairment expense of $48 million. NFE’s income from equity method investment of $50 million in 1Q 2022, turned into a loss from equity investment of $373 million in 2Q 2022. The company reported a net loss of $178 million in the second quarter of 2022, compared with 1Q 2022 net income of $242 million. Its adjusted net income decreased from $242 million in 1Q 2022 to $146 million in 2Q 2022, excluding an impairment charge of $315 million during the second quarter, as a result of an asset sale announced in 2Q 2022 (NFE and Ebrasil Energia Ltda sold 100% of the equity interests of the Porto de Sergipe Power Plant).
NFE’s total segment operating margin increased from $300 million in 1Q 2022 to $327 million in 2Q 2022. NFE reported a 2Q 2022 adjusted EBITDA of $284 million, up 10% QoQ. “Achieved key balance sheet and liquidity objectives, securing over $2.0 billion of internally generated liquidity based on announcements and other activities to date and upsized our LoC facility to $250 million,” the company announced in its 2Q 2022 presentation.
The market outlook
Due to natural gas pipeline constraints, reduced fuel inventories for power generation, and uncertainty regarding LNG shipments (given the tight global supply conditions), EIA expects that wholesale electricity prices will be significantly higher than the average during this winter (October 2022 to March 2023). As liquefaction terminals operated near full capacity, U.S. LNG export increased to 10.1 Bcf/d in September. Figure 1 shows that U.S. LNG gross import increased from 0.01 Bcf/d in 2Q 2022 to 0.05 Mcf/d in 3Q 2022. EIA expects U.S. LNG gross import to increase to 0.06 Bcf/d in 4Q 2022 and to 0.1 Bcf/d in 1Q 2023. Moreover, U.S. LNG gross export decreased from 10.80 Bcf/d in 2Q 2022 to 10.02 Bcf/d in 3Q 2023. EIA expects U.S. LNG gross export to increase to 11.75 Bcf/d in 4Q 2022 and 12.47 Bcf/d in 1Q 2023.
Figure 1 – U.S. LNG exports and imports
eia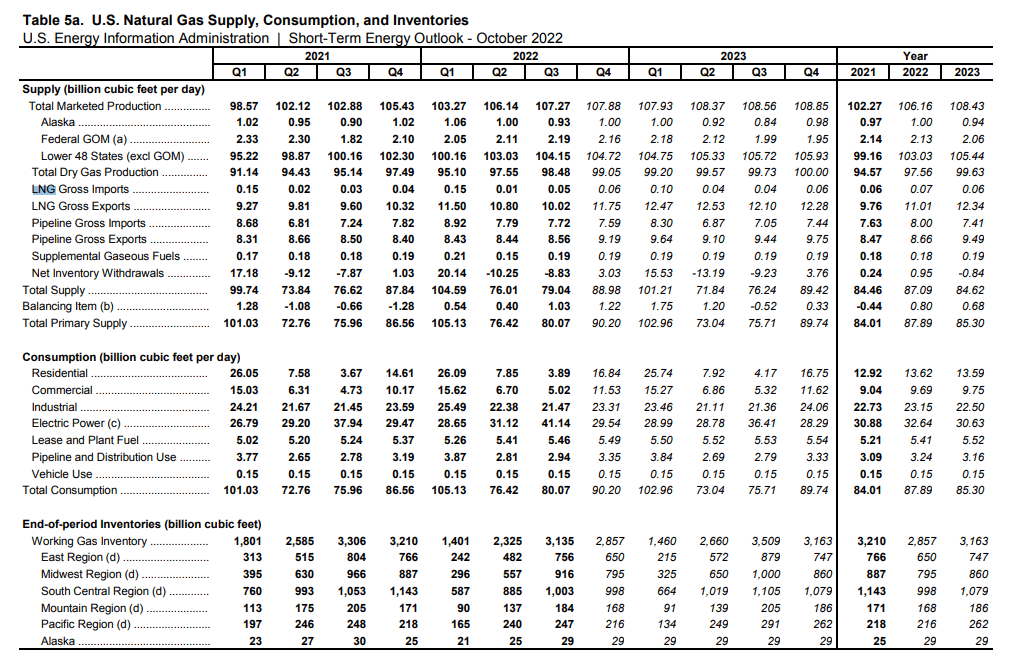
According to Figure 2, LNG demand is expected to be higher than LNG supply in the following years. Also, LNG energy prices will remain high due to the energy crisis as a result of the continuing war in Ukraine. Russian gas pipeline flows to Europe decreased significantly in 2022. On the other hand, U.S. LNG export to Europe has been increasing in the past months due to the colder temperatures and will increase further. For the week ending 26 October, overall natural gas deliveries to U.S. LNG export terminals increased by 0.1 Bcf/d WoW to 11.5 Bcf/d. Thus, the market condition is in favor of NFE.
Figure 2 – LNG market outlook
2Q 2022 presentation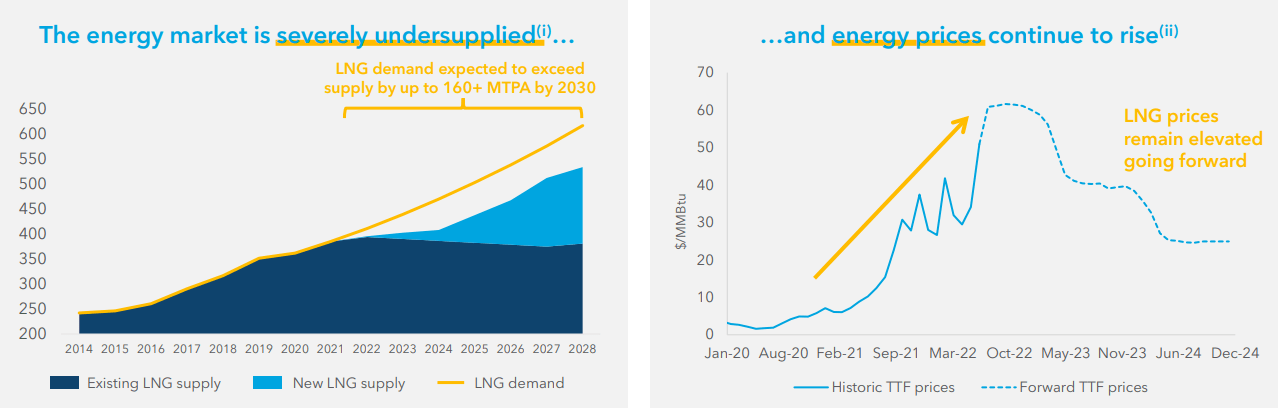
NFE has an adjusted EBITDA Goal of more than $1.0 billion for 2022 and more than $1.5 billion for 2023(without considering the contribution of Fast LNG). Due to increased FLNG deployment opportunities because of increasing Fast LNG sites, NFE’s LNG capacity will increase by approximately 8 million tonnes per annum (see Figure 3). After completing the Barcarena and Santa Catarina terminals in Brazil, NFE’s financial results in its terminal segment will improve. These terminals are expected to start working in 2023.
Also, as NFE’s 605 MW Barcarena power plant will be completed, the company’s power plants segment revenues will increase. In Mexico, NFE signed a letter of intent to expand the existing gas supply contract and extend the term to 10 years. In Europe, the company made significant progress on permits in Ireland, and leased one of its FSRUs to a new terminal in the Netherlands (which was expected to start operating in Q3 2022). Thus, I expect the company’s financial results in its LNG vessels segment to improve in the following quarters.
Figure 3 – NFE’s Fast LNG sites
2Q 2022 presentation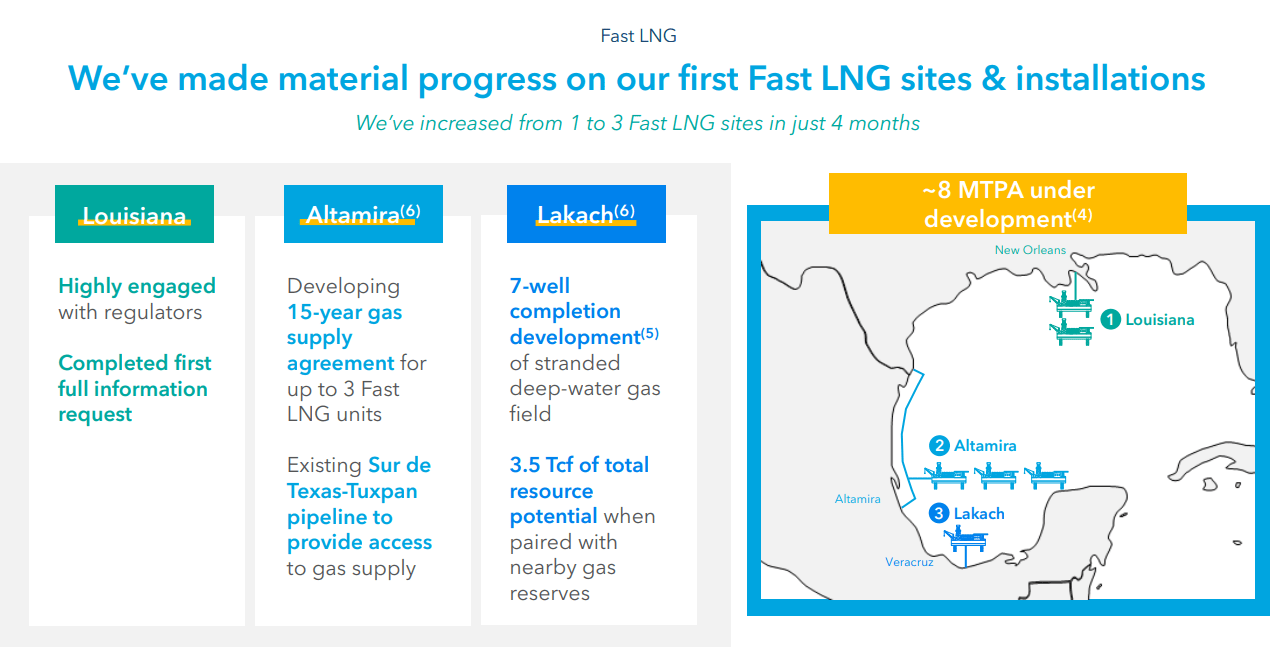
NFE performance outlook
In this detailed analysis, I used some common leverage ratios that have significant comparability to its debt. The proportions are calculated in comparison with previous years to be more helpful.
The debt-to-assets ratio is one of the significant calculations that measure the company’s debt capacity. This ratio indicates the proportion of assets that are being financed with debt. The higher the ratio, the greater the degree of leverage and financial risks. It is observable that after the downturn of 2020, the debt-to-asset ratio of New Fortress Energy decreased to 0.60 and 0.63 in 2021 and TTM, respectively. Moreover, NFE’s debt-to-EBITDA ratio, which determines the probability of defaulting on debt, decreased by half to 5.92 in TTM versus its level of 10.85 in 2021. Finally, New Fortress Energy’s asset-to-equity ratio has been downward since 2020 and sat at 3.5 in TTM. The decreasing assets-to-equity ratio indicates that the company uses lower debt to finance its assets. As a result, the leverage ratios of New Fortress Energy depict the company’s solvency and its ability to meet its current and future obligations (see Figure 4).
Figure 4 – NFE’s leverage ratios
Author (based on SA data)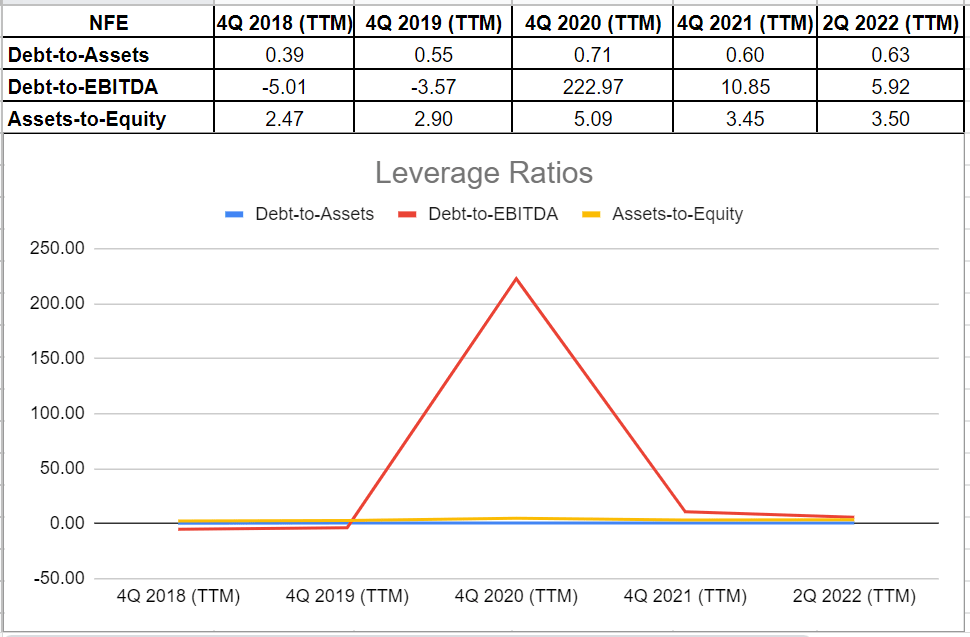
Besides the mentioned ratios, I investigated the coverage ratios of New Fortress Energy to measure the company’s ability to face its financial obligations. It is observable that the company has been able to develop its interest coverage ratio since 2021. In other words, New Fortress Energy’s ICR increased to 1.91 and 3.3 in 2021 and TTM, respectively (compared with its negative amounts for several years in a row). This ratio indicates the number of times a company is able to pay its interest expenses on its debt with its operating income. Meanwhile, its cash coverage ratio has waned to 1.26 at the end of 2021 and 0.72 at the end of June 2022, from 9.16 at the end of 2020. The cash coverage ratio compares the company’s cash generation with its interest expenses. The current cash coverage ratio of New Fortress Energy is not attractive. However, as a result of strong financial results in the upcoming quarters, the company’s cash coverage ratio will improve significantly (see Figure 5).
Figure 5 – NFE’s coverage ratios
Author (based on SA data)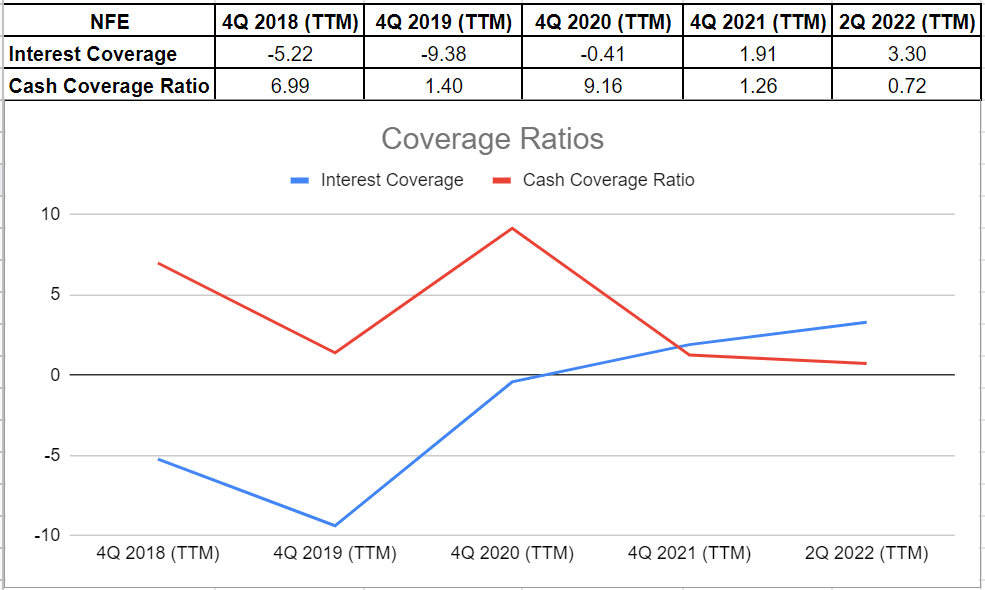
Summary
In terms of the market outlook, natural gas and LNG demand and prices will remain high, and NFE will benefit from the increasing demand for its products and services as it has been developing its infrastructures. In terms of financial performance, the company is in a good position and can cover its obligations. I am bullish on NFE.
Be the first to comment