

pixhook/E+ via Getty Images
About LABD
The Direxion Daily S&P Biotech Bear 3x Shares ETF (NYSEARCA:LABD) is an inverse leveraged ETF in biotechnology, with a leverage factor of -3. It was launched on May 28, 2015. The fund’s objective is defined on daily returns. As described in the prospectus by Direxion, it is designed “to magnify the daily inverse performance of the S&P Biotechnology Select Industry Index.” This is followed by a clear warning: “The return for investors that invest for periods longer or shorter than a trading day should not be expected to be -300% of the performance of the Index for the period.” Indeed its daily leverage factor is a source of drift, which may be positive or negative. The underlying index is the same as for the SPDR S&P Biotech ETF (XBI), which we will use hereafter to calculate drifts. This article explains what “drift” means, quantifies it in 22 leveraged ETFs and shows historical data on LABD.
Why do leveraged ETFs drift?
Leveraged ETFs often underperform their underlying index leveraged by the same factor. The decay has essentially four reasons: beta-slippage, roll yield, tracking errors, and management costs. Beta-slippage is the main reason in equity leveraged ETFs. However, when an asset is in a steady trend, leveraged ETFs can bring an excess return instead of a decay. You can follow this link to learn more about beta-slippage.
Monthly and yearly drift watchlist
There is no standard or universally recognized definition for the drift of a leveraged ETF. Some are quite complicated. Mine is simple and based on the difference between the leveraged ETF performance and Ñ times the performance of the underlying index on a given time interval, if Ñ is the leveraging factor. Most of the time, this factor defines a daily objective relative to an underlying index. However, some dividend-oriented leveraged products have been defined with a monthly objective (mostly defunct ETNs sponsored by Credit Suisse and UBS: CEFL, BDCL, SDYL, MLPQ, MORL…).
First, let’s start by defining “Return”: it is the return of a leveraged ETF in a given time interval, including dividends. “IndexReturn” is the return of a non-leveraged ETF on the same underlying asset in the same time interval, including dividends. “Abs” is the absolute value operator. My “Drift” is the drift of a leveraged ETF normalized to the underlying index exposure in a time interval. It is calculated as follows:
Drift = (Return – (IndexReturn x Ñ))/ Abs(Ñ)
“Decay” means negative drift. “Month” stands for 21 trading days, “year” for 252 trading days.
|
Index |
Ñ |
Ticker |
1-month Return |
1-month Drift |
1-year Return |
1-year Drift |
|
S&P 500 |
1 |
8.13% |
0.00% |
-14.63% |
0.00% |
|
|
2 |
15.74% |
-0.26% |
-32.77% |
-1.76% |
||
|
-2 |
-15.65% |
0.31% |
19.56% |
-4.85% |
||
|
3 |
23.06% |
-0.44% |
-49.51% |
-1.87% |
||
|
-3 |
-23.42% |
0.32% |
20.92% |
-7.66% |
||
|
ICE US20+ Tbond |
1 |
-5.96% |
0.00% |
-33.63% |
0.00% |
|
|
3 |
-18.79% |
-0.30% |
-75.10% |
8.60% |
||
|
-3 |
19.69% |
0.60% |
179.16% |
26.09% |
||
|
NASDAQ 100 |
1 |
4.00% |
0.00% |
-27.56% |
0.00% |
|
|
3 |
8.44% |
-1.19% |
-73.00% |
3.23% |
||
|
-3 |
-15.36% |
-1.12% |
52.87% |
-9.94% |
||
|
DJ 30 |
1 |
14.03% |
0.00% |
-6.92% |
0.00% |
|
|
3 |
45.17% |
1.03% |
-30.62% |
-3.29% |
||
|
-3 |
-34.10% |
2.66% |
2.14% |
-6.21% |
||
|
Russell 2000 |
1 |
11.16% |
0.00% |
-18.58% |
0.00% |
|
|
3 |
33.18% |
-0.10% |
-58.82% |
-1.03% |
||
|
-3 |
-29.90% |
1.19% |
20.15% |
-11.86% |
||
|
MSCI Emerging |
1 |
-1.98% |
0.00% |
-31.28% |
0.00% |
|
|
3 |
-7.67% |
-0.58% |
-73.25% |
6.86% |
||
|
-3 |
2.95% |
-1.00% |
130.76% |
12.31% |
||
|
Gold spot |
1 |
-1.78% |
0.00% |
-8.84% |
0.00% |
|
|
2 |
-4.16% |
-0.30% |
-21.43% |
-1.88% |
||
|
-2 |
3.65% |
0.04% |
15.02% |
-1.33% |
||
|
Silver spot |
1 |
0.69% |
0.00% |
-20.24% |
0.00% |
|
|
2 |
-0.39% |
-0.89% |
-44.42% |
-1.97% |
||
|
-2 |
-5.42% |
-2.02% |
23.33% |
-8.58% |
||
|
S&P Biotech Select |
1 |
3.57% |
0.00% |
-34.18% |
0.00% |
|
|
3 |
6.13% |
-1.53% |
-86.07% |
5.49% |
||
|
-3 |
-15.79% |
-1.69% |
-5.44% |
-35.99% |
||
|
PHLX Semicond. |
1 |
2.43% |
0.00% |
-30.47% |
0.00% |
|
|
3 |
0.68% |
-2.20% |
-81.19% |
3.41% |
||
|
-3 |
-16.03% |
-2.91% |
3.29% |
-29.37% |
LABD has the worst 1-year decay of this list with a drift of -35.99%, whereas the highest positive drift in the same period belongs to the Direxion Daily 20+ Year Treasury Bear 3x Shares (TMV), with +26.09%.
In a monthly time frame, the inverse leveraged semiconductor ETF (SOXS) has the worst decay (-2.91%), and the inverse leveraged Dow Jones ETF (SDOW) has the highest drift (+2.66%).
Positive drift follows a steady trend in the underlying asset, whatever the trend direction and the ETF direction. It means positive drift may come with a gain or a loss for the ETF. Negative drift comes with daily return volatility (“whipsaw”). For example, you can see in the table above that all leveraged ETFs based on the S&P 500 and the Dow Jones have negative drifts in one year (both bull and bear ones).
LABD drift history
LABD aims at a daily return of -3 times the daily performance of the underlying index of XBI. Since inception, LABD has lost 99.7% of its value while XBI has gained 43.3%.
In 2022 to date, both LABD and XBI are in loss (-24% and -26%, respectively), which is absolutely counter-intuitive.
XBI and LABD, year-to-date (Portfolio123)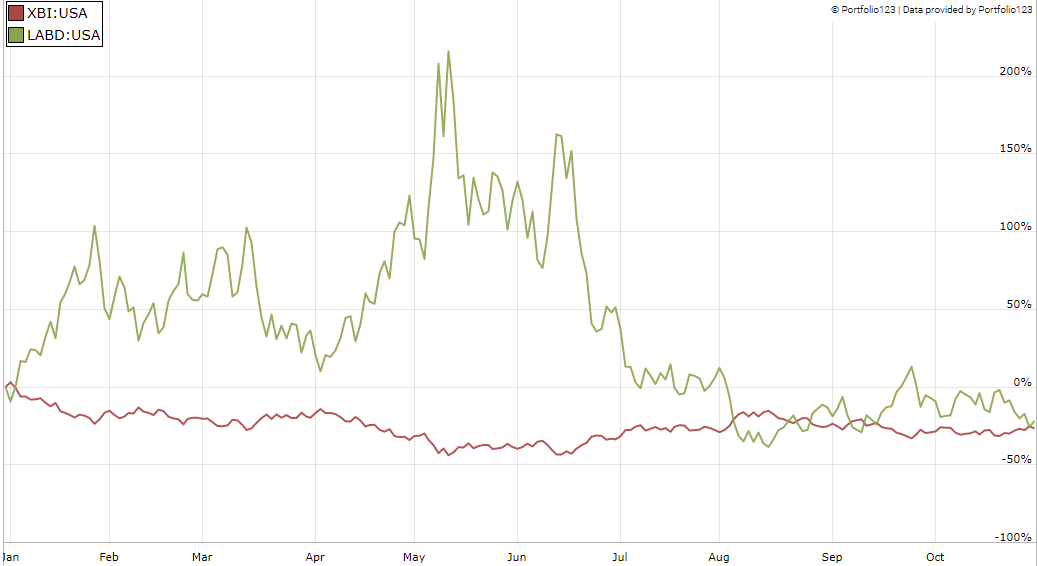
The next chart plots the 12-month drift of LABD starting in June 2016, one year after inception. A 12-month delay is necessary for the drift calculation.
12-month drift of LABD since 6/1/2016 (Chart: author, data: Portfolio123)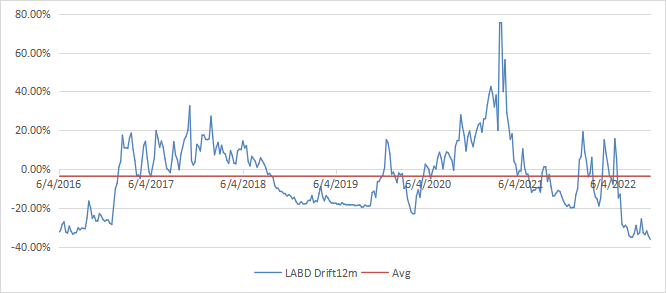
The 12-month drift has been negative 57% of the time since June 2016. The time-weighted average is also negative: -3.6%. This is the average annual decay normalized to the underlying index exposure. As the leverage factor is 3, the average annual decay of LABD itself is close to -11%.
The drift was far in negative territory from the beginning because the whole healthcare sector has been very volatile between August 2015 and January 2016. It jumped back in positive territory in Q1 2017, when this bad period went out of the look-back interval. Then, the 12-month drift had alternate positive and negative periods. Biotechnology is quite a volatile industry with powerful rallies and rollercoaster corrections. The drift is now at its worst level since the ETF was launched.
As a conclusion, LABD is a short-term trading instrument for seasoned traders who have a strategy with clear entry and exit signals, and who understand well the fund’s behavior behind the advertised leverage factor. For 99% of investors, the strategy to follow with LABD is in two words: stay away.
Be the first to comment