

wsfurlan/iStock Unreleased via Getty Images
Investment Thesis
- This Thursday, Nike (NYSE:NKE) is scheduled to release its 1Q23 results. Consensus EPS Estimates for Nike for 1Q23 are 0.92 while Consensus Revenue Estimates are $12.29B. Ahead of the release of its 1Q23 results, I will analyze Nike stock and let you know why I continue with my buy rating.
- Nike has an excellent competitive position. Proof of this is the company’s strong brand image, its endorsements with the world’s top athletes and sports teams as well as its higher EBIT-Margin and Return on Equity as compared to its competitors Adidas and Under Armour. Nike’s Average Dividend Growth Rate of 11.12% over the last five years is an indicator of its excellent growth prospects.
- Taking into account the company’s current stock price of $98.55, I expect a compound annual rate of return of about 15% over the next decade. This number is based on the calculations of my discounted cash flow (“DCF”) Model (for which I have assumed a Revenue Growth Rate of 6%, an EBIT Growth Rate of 8% and a Perpetual Growth Rate of 4% for Nike).
- According the HQC Scorecard, Nike is rated as very attractive in terms of risk and reward: particularly in the categories of Economic Moat (94/100), Profitability (80/100), Valuation (80/100), Innovation (80/100) and Expected Return (100/100), where the company is rated as very attractive. For Financial Strength (75/100) and Growth (68/100), the company achieves an attractive rating.
Nike’s 4Q22 Results
In 4Q22, Nike generated a revenue of $12.2B, down 1% compared to the previous year and up 3% on a currency-neutral basis. Nike Direct generated revenues of $4.8B in the same quarter, which implies an increase of 7% compared to the prior year and is a raise of 11% on a currency-neutral basis. Furthermore, Nike released a Diluted EPS of $0.90 for 4Q22.
These results provide proof of the company’s stable business model. Furthermore, the numbers show that Nike is on track when it comes to its digital strategy. This is underlined by the statement of John Donahoe, President and CEO of Nike, who said the following regarding the company’s results:
“Nike’s results this fiscal year are a testament to the unmatched strength of our brands and our deep connection with consumers. Our competitive advantages, including our pipeline of innovative product and expanding digital leadership, prove that our strategy is working as we create value through our relentless drive to serve the future of sport.”
The Valuation of Nike
Discounted Cash Flow [DCF]-Model
I have used the DCF Model to determine the intrinsic value of Nike. The method calculates a fair value of $126.50 for the company. At the current stock price of $98.55, this gives Nike an upside of 28.40%.
My calculations are based on the following assumptions as presented below (in $ millions except per share items):
|
Nike |
|
|
Company Ticker |
NKE |
|
Revenue Growth Rate for the next 5 years |
6% |
|
EBIT Growth Rate for the next 5 years |
8% |
|
Tax Rate |
9.1% |
|
Discount Rate [WACC] |
8.00% |
|
Perpetual Growth Rate |
4% |
|
EV/EBITDA Multiple |
21.2x |
|
Current Price/Share |
$98.55 |
|
Shares Outstanding |
1,568.60 |
|
Debt |
$12,627 |
|
Cash |
$12,997 |
Market Value vs. Intrinsic Value
|
Nike |
|
|
Market Value |
$98.55 |
|
Upside |
28.40% |
|
Intrinsic Value |
$126.50 |
Source: The Author
Internal Rate of Return for Nike
The Internal Rate of Return [IRR] is defined as the expected compound annual rate of return earned on an investment. Below you can find the Internal Rate of Return as according to my DCF Model (when assuming different purchase prices for the Nike stock).
At Nike’s current stock price of $98.55, my DCF Model indicates an Internal Rate of Return of approximately 15% for the company (while assuming a Revenue Growth Rate of 6% and an EBIT Growth Rate of 8% for the next 5 years and a Perpetual Growth Rate of 4% afterwards).
In bold you can see the Internal Rate of Return for Nike’s current stock price of $98.55. Please note that the Internal Rates of Return below are a result of the calculations of my DCF Model. Changing the assumptions of my DCF Model would result in different rates of return.
|
Purchase Price of the Nike Stock |
Internal Rate of Return as according to my DCF Model |
|
$75.00 |
23% |
|
$80.00 |
21% |
|
$85.00 |
19% |
|
$90.00 |
18% |
|
$95.00 |
16% |
|
$98.55 |
15% |
|
$100.00 |
15% |
|
$105.00 |
13% |
|
$110.00 |
12% |
|
$115.00 |
11% |
|
$120.00 |
9% |
|
$125.00 |
8% |
Source: The Author
Relative Valuation Models
The P/E [FWD] Ratio for Nike
Nike’s P/E [FWD] Ratio is currently 25.98, which is 27.98% below its 5 Year Average (36.07), indicating that the company is currently undervalued.
Both my DCF Model and Relative Valuation Models such as the P/E [FWD] Ratio indicate that Nike is currently undervalued, which strengthens my opinion to rate Nike as a buy.
Fundamentals: Nike in comparison to Adidas and Under Armour
|
Nike |
Adidas (OTCQX:ADDYY) (OTCQX:ADDDF) |
|||
|
General Information |
Ticker |
NKE |
ADDYY |
UAA |
|
Sector |
Consumer Discretionary |
Consumer Discretionary |
Consumer Discretionary |
|
|
Industry |
Footwear |
Apparel, Accessories and Luxury Goods |
Apparel, Accessories and Luxury Goods |
|
|
Market Cap |
160.65B |
24.40B |
3.53B |
|
|
Profitability |
EBIT Margin |
14.29% |
7.20% |
9.23% |
|
ROE |
43.11% |
18.48% |
19.13% |
|
|
Valuation |
P/E GAAP [FWD] |
25.98 |
21.07 |
14.39 |
|
Growth |
Revenue Growth 3 Year [CAGR] |
6.09% |
-1.07% |
3.05% |
|
Revenue Growth 5 Year [CAGR] |
6.34% |
1.52% |
3.29% |
|
|
EBIT Growth 3 Year [CAGR] |
11.84% |
-15.37% |
– |
|
|
EPS Growth Diluted [FWD] |
8.78% |
45.26% |
NM |
|
|
Dividends |
Dividend Yield [FWD] |
1.22% |
2.62% |
– |
|
Dividend Growth 3 Yr [CAGR] |
11.50% |
-2.61% |
– |
|
|
Dividend Growth 5 Yr [CAGR] |
11.12% |
9.42% |
– |
|
|
Consecutive Years of Dividend Growth |
9 Years |
0 Years |
– |
|
|
Dividend Frequency |
Quarterly |
Annual |
– |
|
|
Income Statement |
Revenue |
46.71B |
22.82B |
5.68B |
|
EBITDA |
7.51B |
2.27B |
665.97M |
|
|
Balance Sheet |
Total Debt to Equity Ratio |
82.63% |
90.05% |
72.01% |
Source: Seeking Alpha
The High-Quality Company [HQC] Scorecard
“The aim of the HQC Scorecard that I have developed is to help investors identify companies which are attractive long-term investments in terms of risk and reward.” Here you can find a detailed description of how the HQC Scorecard works.
Overview of the Items on the HQC Scorecard
“In the graphic below, you can find the individual items and weighting for each category of the HQC Scorecard. A score between 0 and 5 is given (with 0 being the lowest rating and 5 the highest) for each item on the Scorecard. Furthermore, you can see the conditions that must be met for each point of every rated item.”
Source: The Author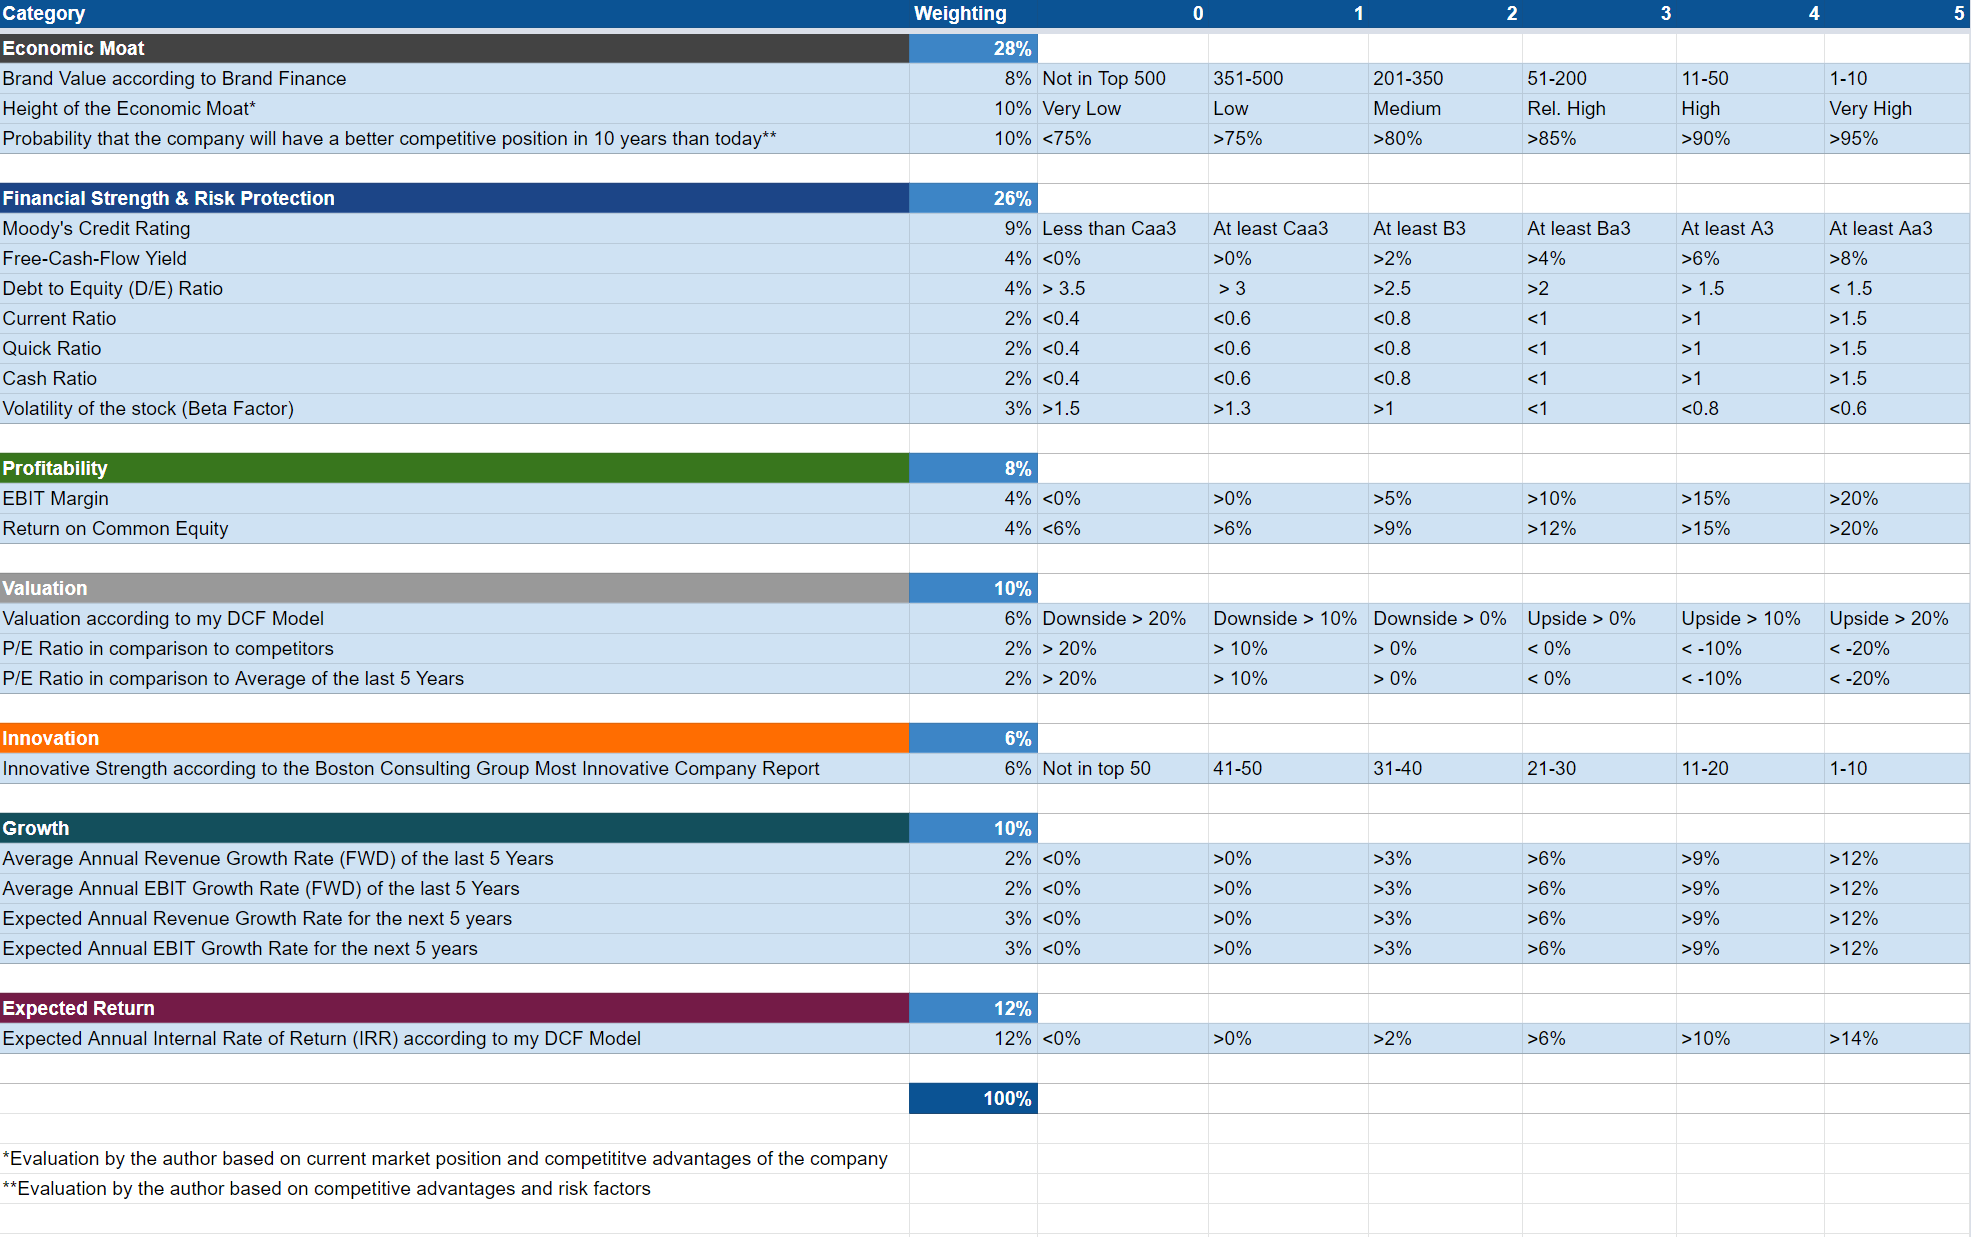
Nike According to the HQC Scorecard
Source: The Author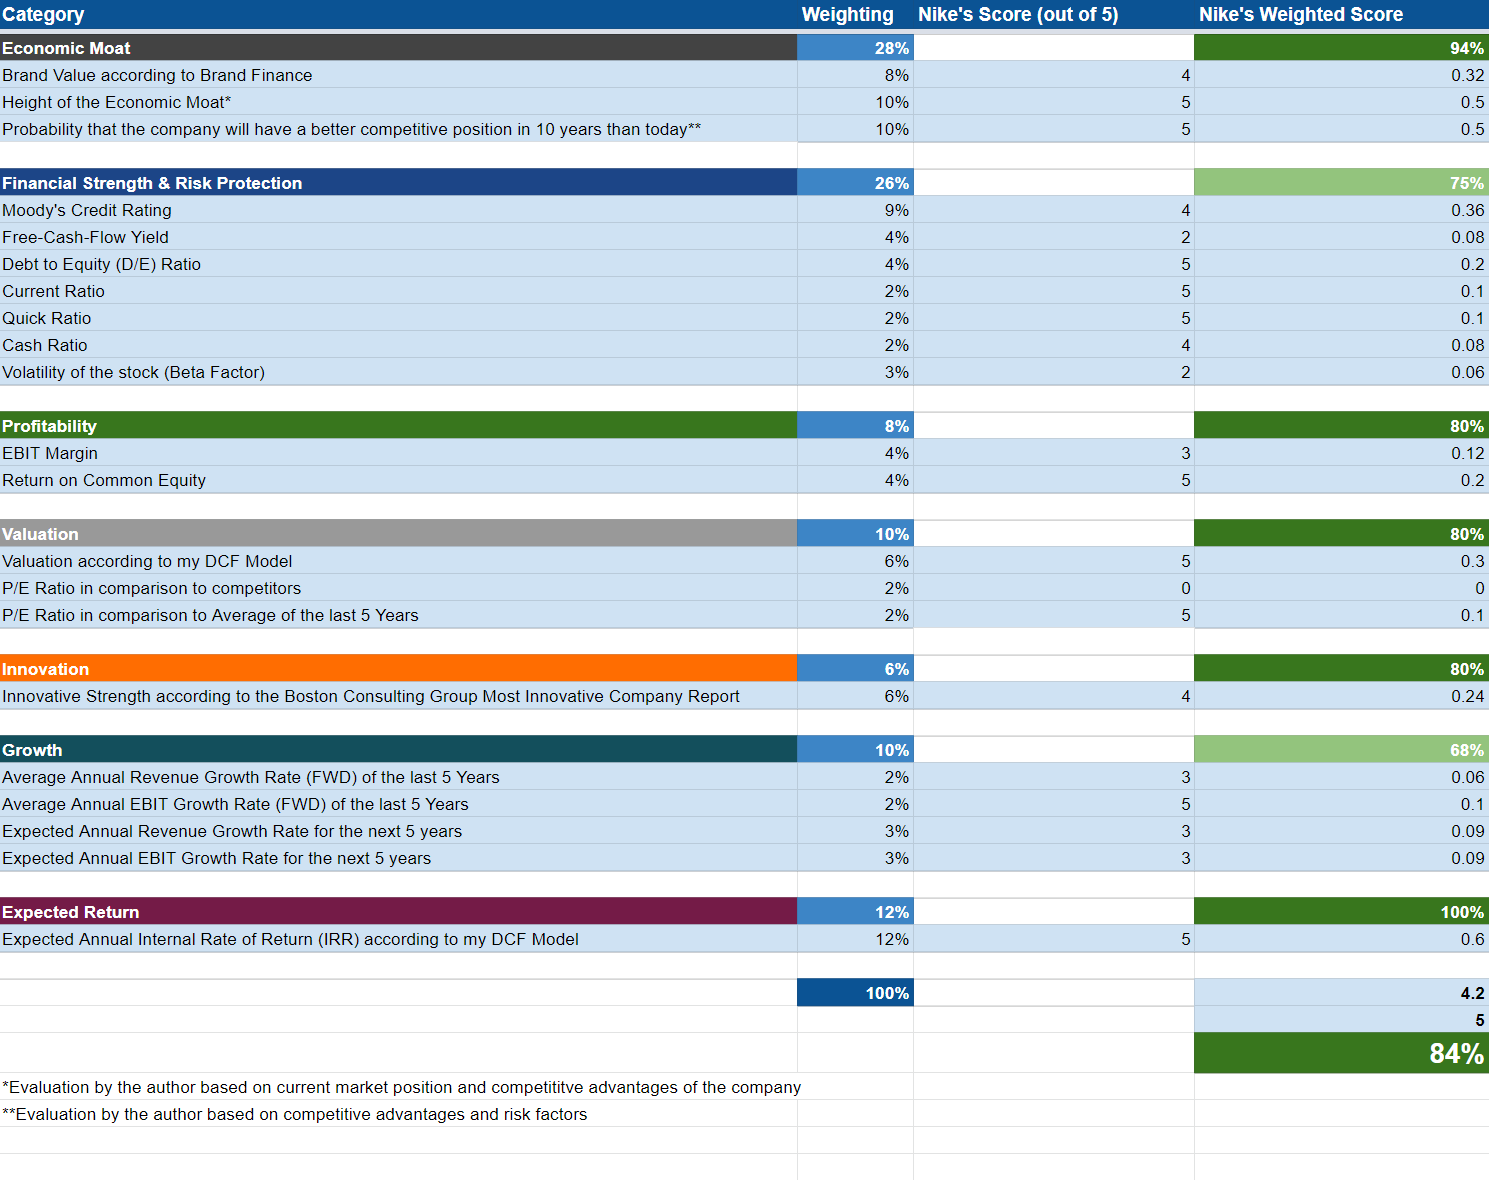
According to the HQC Scorecard, Nike receives a very attractive rating in terms of risk and reward. The company is rated with 84/100 points.
In the category of Economic Moat, Nike scores 94/100 points.
In the category of Financial Strength, Nike receives 76/100 points. The attractive rating in this category is particularly a result of its A1 credit rating by Moody’s, a relatively low Total Debt to Equity Ratio of 82.63%, as well as its relatively high Current Ratio of 2.63 and Quick Ratio of 1.65.
In the category of Profitability, Nike receives 80/100 points, which is mostly due to its relatively high EBIT Margin of 14.29% and its high ROE of 43.11%.
For Valuation, Nike gets 80/100 points and for Innovation, it receives 80/100. In terms of Growth, Nike scores 68/100.
Due to the relatively high Expected Internal Rate of Return as according to my DCF Model, Nike receives 100/100 points in the category of Expected Return.
Nike’s very attractive overall rating as according to the HQC Scorecard, strengthens my belief that the company is currently a buy.
Nike According to the Seeking Alpha Factor Grades
According to the Seeking Alpha Factor Grades, Nike is rated with an F in terms of Valuation and a D for Growth. For Profitability, Nike receives an A+ rating. For Momentum and Revisions, the company gets a C.
Source: Seeking Alpha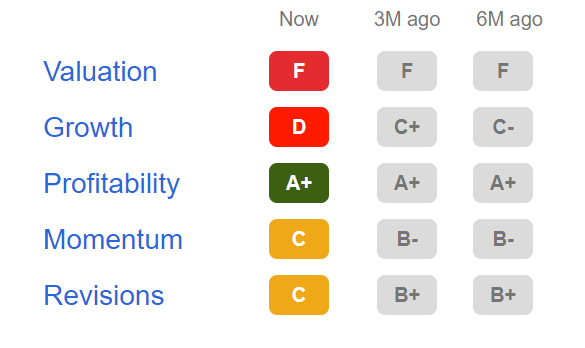
Nike According to the Seeking Alpha Quant Ranking
According to the Seeking Alpha Quant Ranking, Nike is ranked 4th out of 8 in the Footwear Industry and 225th out of 537 in the Consumer Discretionary Sector.
Source: Seeking Alpha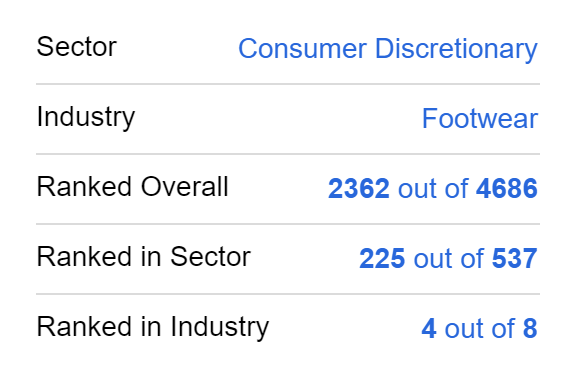
Nike According to the Seeking Alpha Dividend Grades
The Seeking Alpha Dividend Grades underline once again my opinion that Nike is an excellent choice for dividend growth investors. For Dividend Growth and Dividend Consistency, Nike is rated with an A. For Dividend Safety, the company receives a B+ and for Dividend Yield, it gets a D-.
Source: Seeking Alpha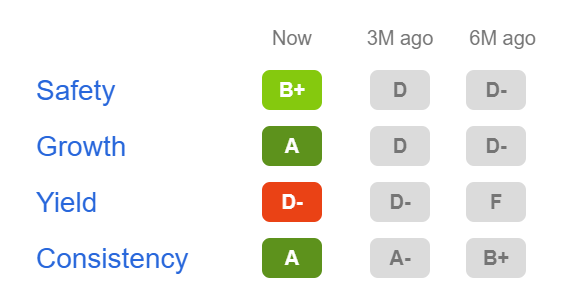
Nike According to the Seeking Alpha Authors and the Wall Street Analysts
While Nike is rated as a hold according to the Seeking Alpha Quant Rating, the Seeking Alpha Authors and the Wall Street Analysts both currently rate the company as a buy.
Source: Seeking Alpha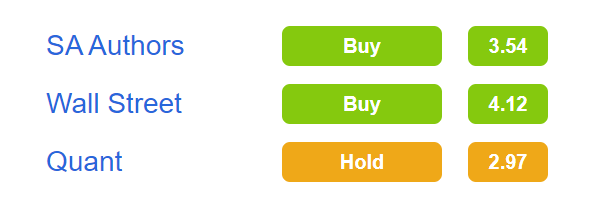
Risk Factors
In a previous analysis on Nike, I wrote the following concerning the company’s risk factors:
“In my view, one of the biggest risks of investing in Nike is the danger the company would face if their brand image were to get damaged. According to Forbes, Nike is currently the 13th most valuable brand in the world. This brand image could be damaged if, for example, one of the athletes endorsed by Nike, was involved in a scandal. Nike’s image could then be affected negatively which could subsequently damage the company’s brand value. This could have a serious impact on the company’s financial results.”
Furthermore, I see the intense competition with its main competitors Adidas and Under Armour as an additional risk factor, which I also discussed in my previous analysis:
“Another risk I see in investing in Nike is the intense competition the company faces. The athletic footwear as well as the apparel and equipment industry are all extremely competitive, not only in the U.S. but also worldwide. This intense competition, especially with Adidas and Under Armour, could result in a negative impact on Nike’s profit margin.”
There are two factors in particular that strengthen my belief that the company will stand out against its competitors in the long run and therefore will be an excellent long-term investment: Nike’s strong brand image and its long-term endorsements with the world’s elite athletes and sports teams. Both provide the company with an enormous competitive advantage over its competitors.
Due to these strong competitive advantages, I see an investment in Nike as much less risky than an investment in one of its competitors.
The Bottom Line
Both my DCF Model as well as Relative Valuation Models show that Nike is currently undervalued. Therefore, the company continues to receive my buy rating: Nike has broad competitive advantages such as its strong brand image and endorsements with the world’s top athletes and sports teams. Proof of its excellent competitive position is the fact that both its EBIT Margin and ROE are significantly higher compared to its competitors Adidas and Under Armour: while Nike has an EBIT Margin of 14.29%, the one of Adidas is 7.20% and Under Armour’s is 9.23%.
The results of the HQC Scorecard underline that Nike is an excellent pick in terms of risk and reward. Additionally, Nike’s strong rating strengthens my opinion to overweight its stock in an investment portfolio that is built with a long investment-horizon.
The results of the Seeking Alpha Dividend Grades confirm that Nike is an appealing choice for dividend growth investors: for Dividend Growth and Dividend Consistency, Nike is rated with an A, for Dividend Safety, it receives a B.
Nike is one of the largest positions of my investment portfolio and I plan to benefit from its growing dividend while having a long investment-horizon.
Be the first to comment