

mabus13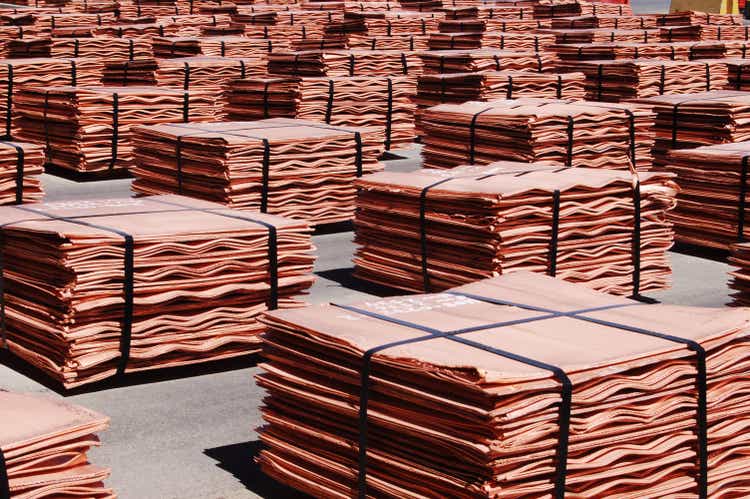
Doctor Copper is an industrial metal that can diagnose the health and well-being of the worldwide economy. Historically, copper prices tend to rise during inflationary periods and when the worldwide financial landscape experiences growth. Economic contraction tends to weigh on copper’s price as the metal is a critical infrastructure building block.
Meanwhile, the demand side of copper’s fundamental equation has changed over the past years. Copper is a critical ingredient in green energy initiatives, leading Goldman Sachs’ analysts to state, “Copper is the New Oil,” and decarbonization does not occur with the red nonferrous metal in May 2022.
Nearby COMEX copper futures rose to a new all-time high of $5.01 per pound in March 2022. In 2021, Goldman forecasted the price of copper would increase to $15,000 per ton by 2025, translating to a price of just below the $7 per pound level for COMEX futures. Meanwhile, copper prices have declined from the March 2022 highs and were trading below $3.60 on the December COMEX futures contract on Sept. 15. Bull markets rarely move in straight lines, and selloffs can be brutal. With copper nearly $1.50 below the price six months ago, accumulating the metal on a scale-down basis could be the optimal approach for the coming years. The iPath Series B Bloomberg Copper Subindex Total Return ETN product (NYSEARCA:JJC) does an excellent job tracking the copper price higher and lower.
Fighting inflation weighs on copper
While the August CPI rose by a more-than-expected 8.3%, the producer price index declined and was 8.7% higher on a year-over-year basis. While the inflation barometers fell from the July reading, they indicate that inflation remains a clear and present danger. The latest data will encourage the US central bank to increase the Fed Funds Rate from the current band between 2.25% and 2.50% by 75 basis points when the FOMC meets on Sept. 20-21. Rising interest rates are bearish for commodity prices as they increase the cost of carrying inventories. The quantitative tightening level doubled in September, putting additional upward pressure on interest rates further out along the yield curve.
US 30-Year Treasury Bond Futures Chart (Barchart)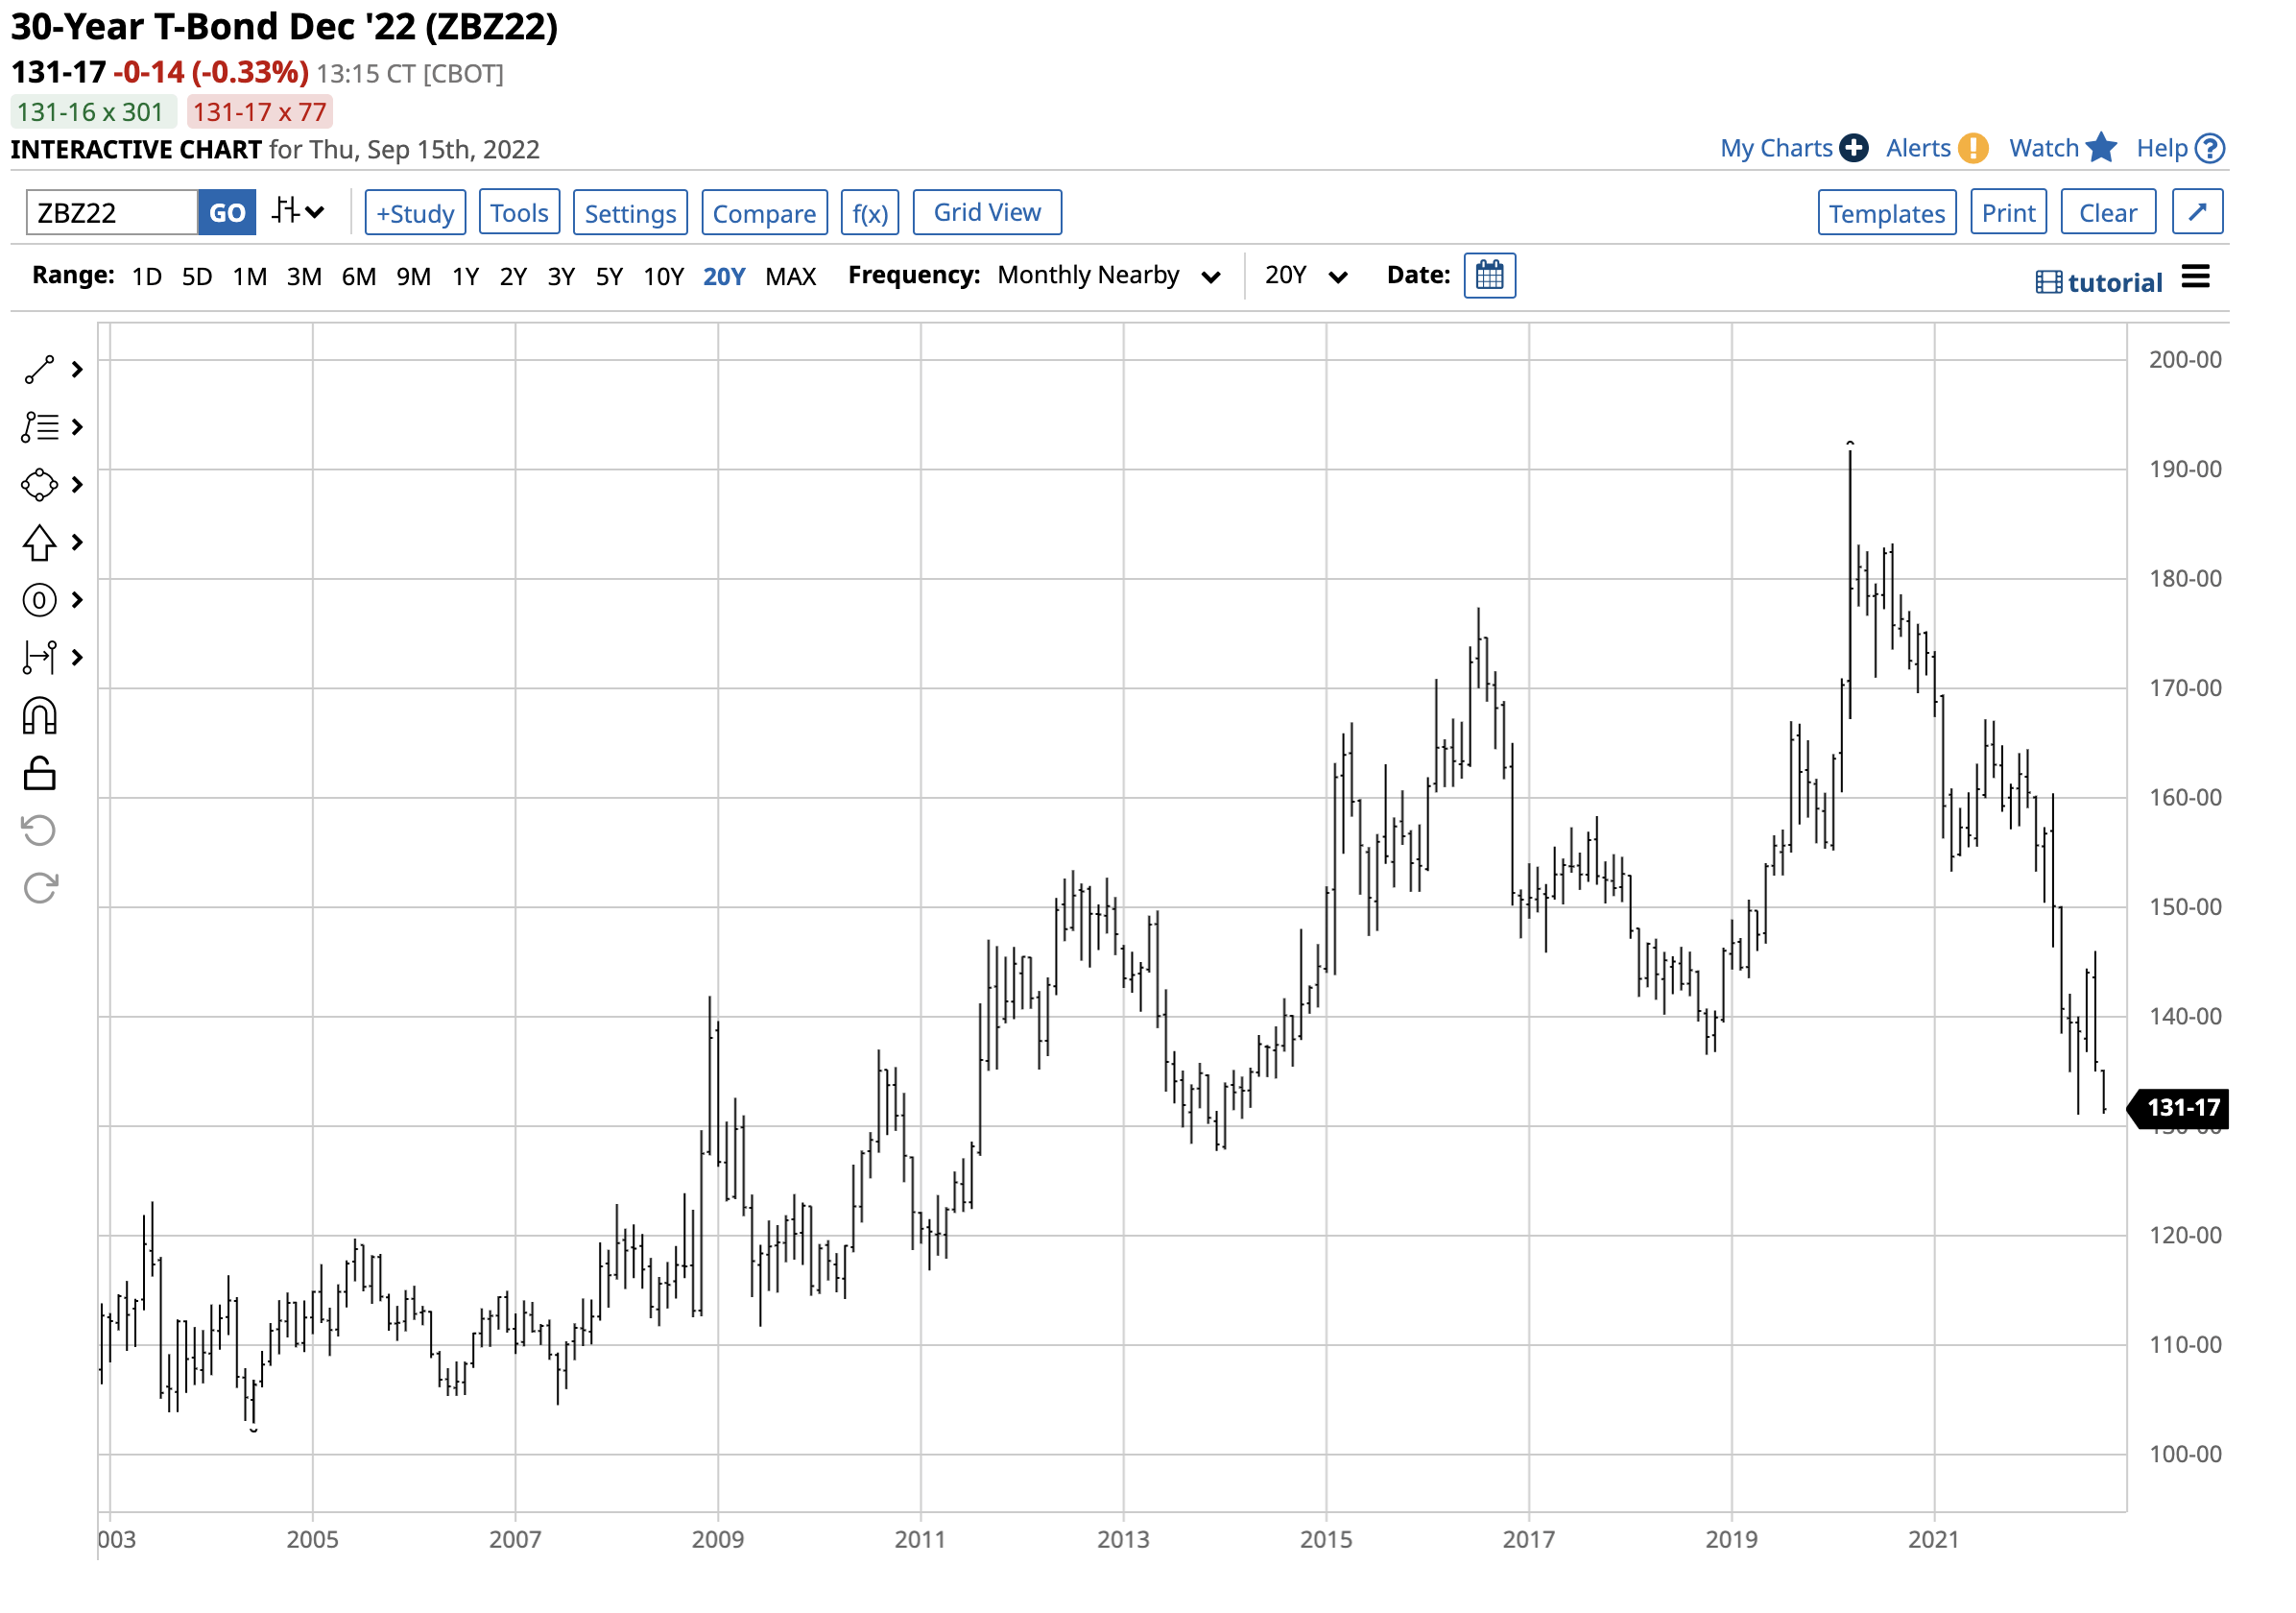
The US 30-Year Treasury bond futures chart shows the decline to the lowest level since April 2014 in June. The long bond futures fell to 131-01 and was near that level on Sept. 15. The next downside target sits at the December 2014 127-23 low. The bottom line is fighting inflation is pushing interest rates higher. At the same time, higher rates threaten to push the economy into a deeper recession after the two consecutive quarterly declines in US GDP in Q1 and Q2 2022. A contracting US economy could cause the Fed to curb its enthusiasm for rate hikes later this year or in 2023 because of recessionary pressures. Meanwhile, short-term interest rates appear to be on an express train toward the 4% level, and fighting the Fed tends to be a losing approach to markets. Higher rates are bearish for raw material prices, and copper is no exception.
A strong US dollar is bearish for the red metal
Since interest rate differentials are one of the primary factors for the path of least resistance of one currency against another, the dollar has moved higher on the back of increasing US interest rates. The dollar index reflects the value of the US currency against other world reserve foreign exchange instruments. Since the euro is the second most popular reserve currency, it has a 57.6% weighting in the dollar index. Aside from interest rate differentials, the euro faces unique challenges in 2022 as the war in Ukraine is on Western Europe’s doorstep. Moreover, Russia’s retaliation for sanctions directly impacts the European economy, weighing on the euro vs. the US dollar exchange rate. The euro has dropped to parity against the dollar for the first time in two decades, pushing the dollar index to a 20-year high.
US Dollar Index Futures Contract (Barchart)
The US dollar index chart highlights the rally in the US currency to the highest level since 2002 at 110.785. The dollar index has moved 24.2% higher since January 2021 at the most recent peak. At over the 109 level on Sept. 15, the index remains at its highest level in two decades. The US dollar is the benchmark pricing mechanism for most commodities, and copper is no exception. COMEX futures trade in US dollar terms, and even though the London Metals Exchange is the hub of international copper trading and is in the UK, the forward contracts are in US dollar terms. A rising dollar tends to be bearish for copper prices as it causes the metal’s price to rise in other currencies. The elasticity of demand tends to cause dollar prices to fall when the dollar rises, as demand declines when prices rise in different weakening currencies. While interest rates and the strength of the US dollar have weighed on copper, the world’s leading consumer, China, has experienced an economic slowdown caused by COVID-19 protocols and lockdowns. Economic weakness in China could be the leading bearish factor for the red nonferrous metal.
The Fed could overreact to the latest data while ignoring other risks
In 2021, the US central bank and government attributed rising inflation as a “transitory” pandemic-related event. As the economic condition continued to rise, they reversed course in late 2021, realizing that inflation was more of a structural financial problem. The artificially low interest rates and massive government stimulus programs planted inflationary seeds during the pandemic that bloomed in 2020 and 2021 and began to grow and spread like wildfire.
In 2022, economic enemy No. 1 is inflation, with a hawkish Fed that hiked the Fed Funds Rate by 75 basis points at the June and July FOMC meetings to a range between 2.25% and 2.50% from zero in March 2022. Over the past two quarters, US GDP declines amount to the textbook definition of a recession. However, the government and central bank have attributed the economic contraction to a “transition” instead of a recession. Just as they waited too long to realize the need for a monetary policy shift in 2021 and early 2022, they could be making the same mistake with recessionary pressures in 2022.
Fighting inflation and battling an economic contraction requires mutually exclusive monetary policy tools. Moreover, continued interest rate hikes only increase the potential for a deeper recession. As the Fed prepares to meet on September 20 and 21 to push rates another 75 basis points higher to the 3.00% to 3.25% range, the central bank is making a conscious decision to sacrifice economic growth to drive inflation to its 2% target rate. Meanwhile, since some of the factors increasing inflationary pressures come from the economy’s supply side, it does not guarantee the success of the rate hikes. The Fed is in a challenging position as stagflation, or inflation plus economic contraction, is a unique and complex economic condition.
Some economists warn that the Fed needs to curb its enthusiasm for rate hikes because of the growing threat of a deepening recession. However, it could take months before an epiphany that “transition” in 2022 is a similar mistake to “transitory” in 2021. The latest CPI and PPI reports that put inflation at over 8% remain far above the short-term interest rate even after another 75-point increase. The core inflation reading at 6.3% remains over double the rate after the third consecutive three quarters of one percent Fed Funds Rate increase. The question is whether the Fed remains behind the inflationary curve or is now falling far behind in fighting a recession that requires stimulus.
Copper fundamentals remain bullish
Markets reflect the economic and geopolitical landscapes, which are uncertain in September 2022. Rising interest rates and a strong dollar have driven copper prices lower since the red metal reached a record high over the $5 per pound level in March 2022.
COMEX Copper Futures Chart (Barchart)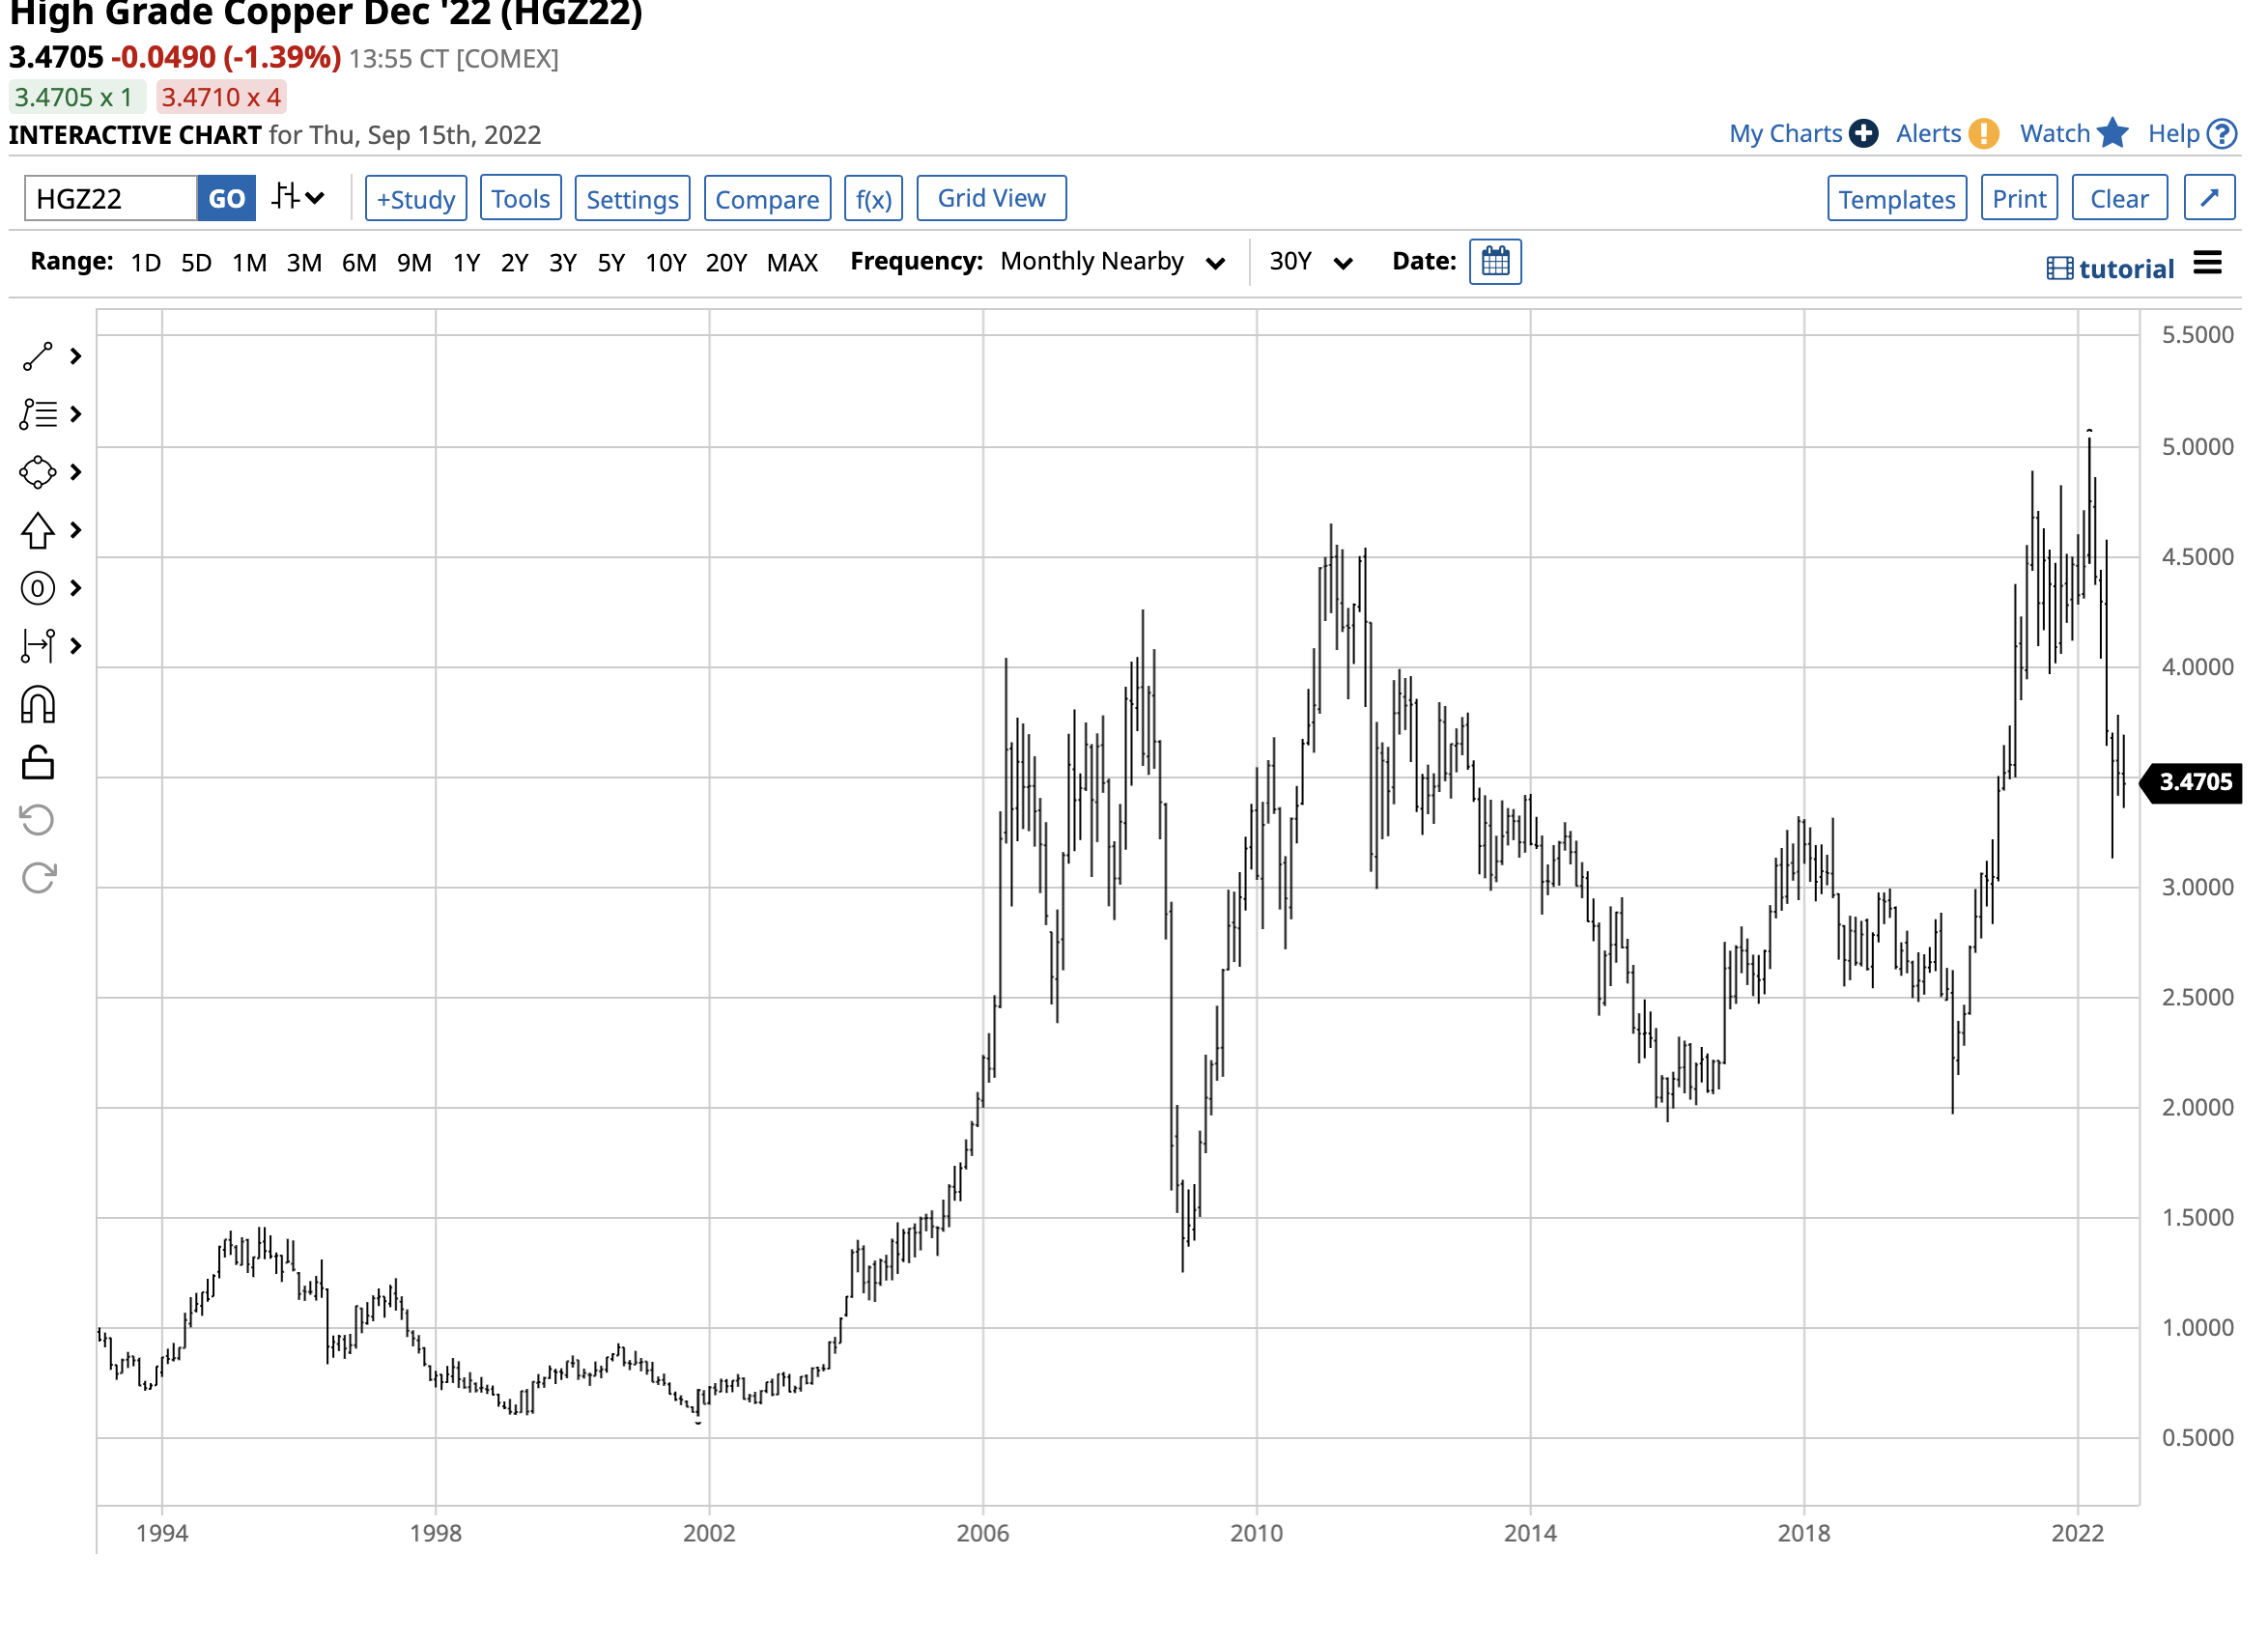
The chart highlights copper’s decline from the over $5 high to below $3.50 per pound on Sept. 15. The over 30% correction comes on the heels of higher rates that increase the cost of carrying inventories, an economic slowdown in China and the US, and a rising US dollar.
Meanwhile, after losing over 30%, copper fundamentals remain a compelling reason to add the red metal to portfolios below the $3.50 per pound level. As Goldman Sachs noted, copper is the new oil and energy commodity as it’s the critical metal for decarbonization as EV batteries, wind turbines, and other green initiatives require the metal. Addressing climate change will cause the demand will rise over the coming years, and copper inventories have been trending lower.
LME Copper Inventories (Kitco/LME)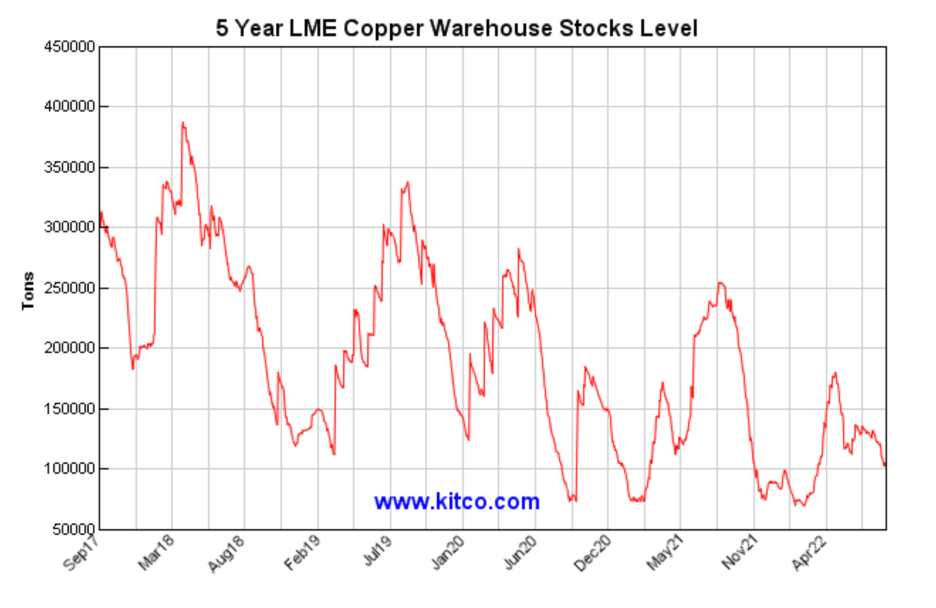
The five-year chart of copper inventories on the London Metals Exchange illustrates the pattern of lower highs and lower lows. As of Sept. 14, LME stocks stood at 103,025 metric tons.
COMEX Copper Inventories (Kitco/CME-COMEX)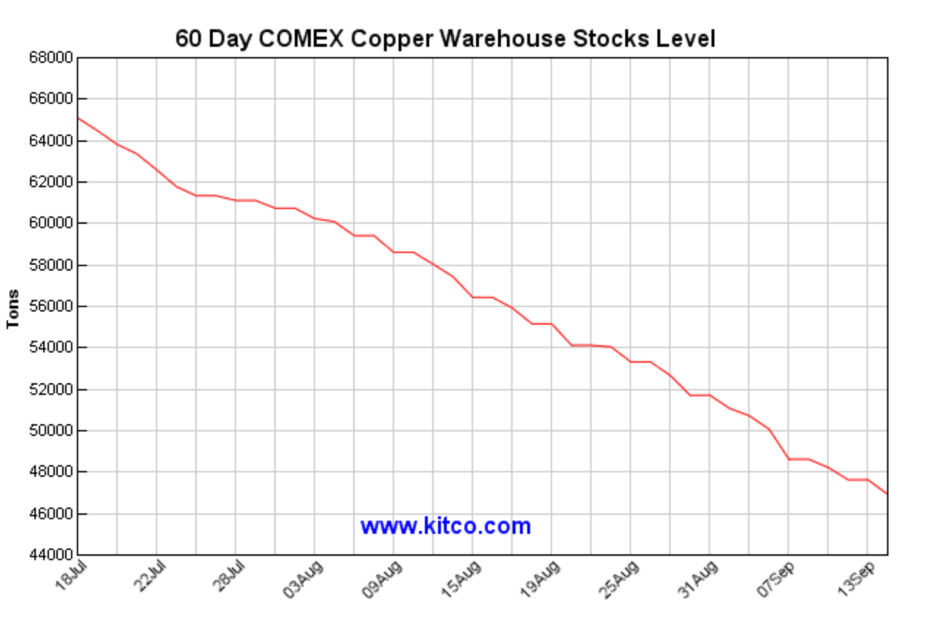
Over the past two months, COMEX copper stocks have declined from over 65,000 to below 47,000 metric tons. Even though China has been under economic pressure, inventory levels have been declining. When China reopens, we could see a sudden explosive move in copper as the Chinese move to secure metal supplies.
While the short-term trend since March remains bearish, the supply and demand fundamentals in the copper market remain strong. It will take the better part of a decade to bring new production online. While producers are scouring the world for new reserves, the market will not see significant production increases until the end of this decade.
JJC follows copper higher and lower
The most direct route for a risk position in the copper market is via the COMEX futures and futures options or the forwards and options on the London Metals Exchange. The iPath Series B Bloomberg Copper Subindex Total Return ETN product provides an alternative to the COMEX and LME products for those looking to participate in the copper market in their standard stock portfolios.
At $17.43 per share on Sept. 15, JJC had $57.498 million in assets under management. The ETF trades an average of 43,132 shares daily and charges a 0.45% management fee. While JJC can suffer from low liquidity at times, it does an excellent job tracking copper futures prices.
Nearby December COMEX copper futures rose from $1.9725 in March 2020 to $5.0395 two years later in March 2022, a 155.5% increase.
JJC ETN Product (Barchart)
Over the same period, the JJC ETN rose from $10.67 to $24.87 per share or 133.1%. One of the drawbacks of the ETN is that while copper trades around the clock during the week, the ETN is only available for trading during hours when the US stock market operates, so it can miss highs or lows that occur during European and Asian trading hours. However, the ETN is an option for those looking to build a long position with exposure to the copper market.
I believe copper offers a compelling value below the $3.50 per pound level. However, long positions require plenty of room to add on further price declines in the current environment because selloffs can push prices to illogical, irrational, and unreasonable levels. I favor a scale-down buying approach to the copper market and the JJC ETN product.
Be the first to comment