

PeopleImages
Investment Summary
Resiliency is a key factor to equity portfolios in the forward-looking climate. Maintaining a constant weight to quality and resiliency are paramount to reduce portfolio variance and reduce equity beta. We are seeking exposure to names that exemplify quality and cash generation to capture this theme. Here we look to Henry Schein, Inc. (NASDAQ:HSIC) and note it displays a close fit to the kind of equity premia we are seeking exposure to here. Here we note double-digit return on invested capital and an FCF yield of 6% with HSIC trading at a market cap well behind FY15-FY17 levels. We re-rate HSIC to buy and value it at $87.30.
Exhibit 1. HSIC 6-month price action
Data: Updata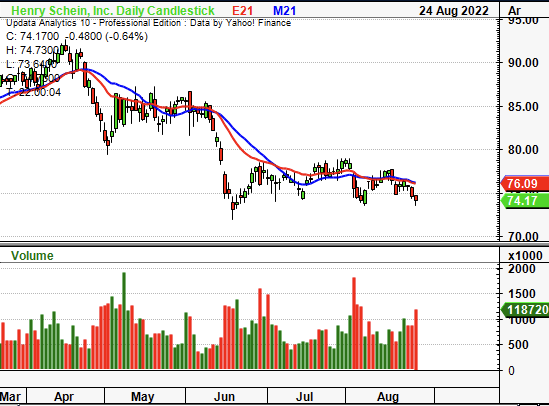
Q2 earnings illustrate the case in point.
Second quarter earnings were robust and demonstrate the factor of resiliency in the investment debate. Revenue of $3 billion came in ~210bps higher YoY whereas ex-PPE and Covid-19 turnover, local growth was closer to 6% for the year. Segmentally, global dental sales came in at $1.9 billion and narrowed by 310bps YoY. Meantime, global medical sales gained ~10% YoY to $1 billion. Consumable merchandise sales also narrowed by 220bps over the year, whereas North American dental sales also narrowed 110bps YoY in constant currency terms. Meanwhile, technology and value-added services printed $181 million in turnover and grew 18% YoY, underlined by strength in the Dentrix segment.
However, dental equipment sales in North America gained 810bps from Q2 FY21. Underlining the growth is a 550bps gain in equipment sales. Covid-19 and related personal protective equipment (“PPE”) sales have also diminished in line with industry expectations. HSIC sold ~$68 million in Covid-19 test kits last quarter, down from $75 million last year. The sales mix was between multi-assay and Covid-combination kits. Pricing volatility continues in this segment, and management anticipates further downside in Covid-19 and related PPE sales.
Despite this, order backlog for equipment in both the North American and international businesses remains strong. In particular, HSIC recognized $242 million of demand pull-through in sales of dental specialty products, up 660bps YoY.
Moving down the P&L, quarterly operating margin came in at 7.3% to $220 million ($1.60/share), up from $205 million ($1.46/share) YoY. It brought this down to a net income of $160 million for the year, or $1.16 per share. As part of its capital management strategy, the company also repurchased 1.3 million shares at an average of $81.42, spending $110 million. Free cash flow (“FCF”) narrowed to $133 million, which was constructive seeing total debt decrease by $8 million sequentially.
As seen in Exhibit 2, operating results have been seasonal for the company on a sequential basis since FY15. FCF yield has been equally as seasonal, yet continues to climb on a long-term basis. We note that HSIC is printing operating results in line with its FY15-FY17 levels; however, it is trading at a market capitalization and enterprise value that is 18% and 12% lower than December FY15 and FY17, respectively. Investors also realize an FCF yield at least 200bps higher over the same time at 6%. This exemplifies the kind of resiliency on offer. Plus, the pricing asymmetry looks yet to be realized on the chart, by estimate.
Exhibit 2. Operating results back in line with FY15-17 levels, albeit on lower corporate valuation
Data: HB Insights, HSIC SEC Filings and Prospectus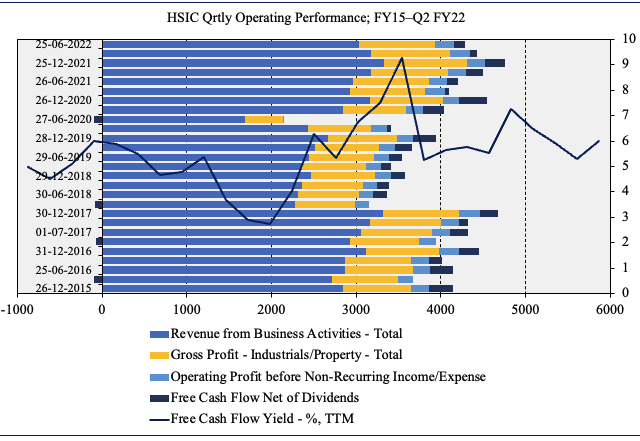
Further evidence of this asymmetry is seen in the charts below. In Exhibit 3, note that return on invested capital has returned to FY15-17 highs of over 12%. Collectively, HSIC has printed a c.20% return on investment [defined as quarterly ROA plus ROIC]. Hence, we are now receiving ~12% ROIC for an EV that is 12% lower than FY15. This sits well above the company’s WACC of 7%.
Exhibit 3. ROIC and ROA have returned to previous ranges
We are receiving this at market cap / enterprise value 18%-12% below the previous periods.
Data: HB Insights, HSIC SEC Filings and Prospectus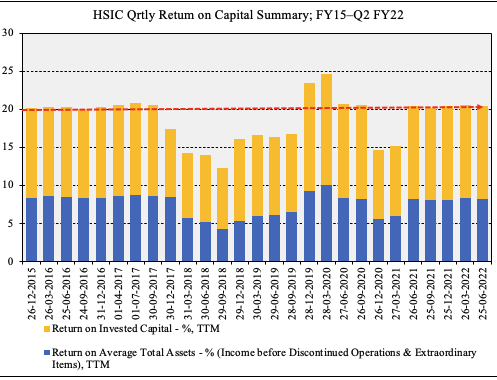
Meanwhile, in Exhibit 4, observe the quarterly marginal analysis for HSIC over the past 7 years to date. As noted, FCF has been seasonal, however operating margin has remained steady over this time period. We note this further evidences the kind of resiliency in earnings and margin retention that we are seeking exposure too.
Exhibit 4.
Data: HB Insights, HSIC SEC Filings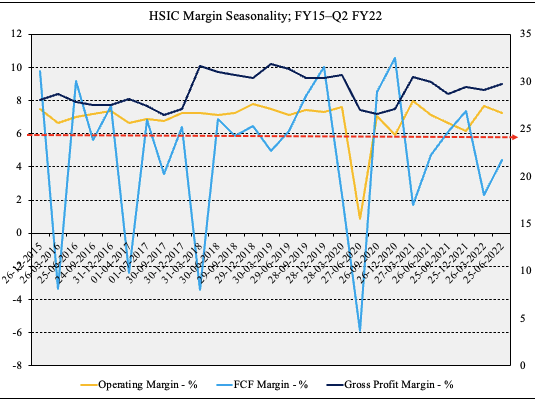
Equity Value Balanced to Tangible Value
Unlike many other names within the healthcare space, HSIC’s balance sheet is skewed towards tangible value. Intangibles and goodwill continue to make up ~40% of total assets, as seen in the chart below. This trend has held constant since FY15, providing a solid case for valuation. Again, this is further evidence of the resiliency factor available to harvest for HSIC.
Exhibit 5. When factoring in measures of corporate value, tangible book value is paramount in identifying payback period, valuation and future cash flows.
This is the kind of equity asset structure that we are seeking exposure too – one that is tilted towards tangible measures of value.
Data: HB Insights, HSIC SEC Filings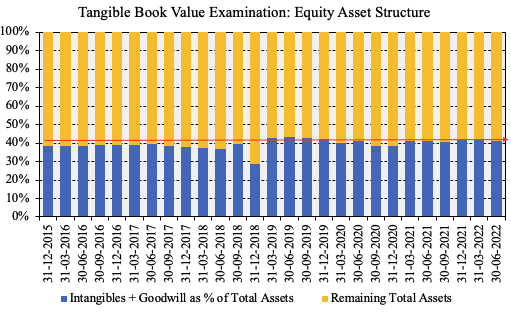
In addition, cash earnings are high for HSIC, with the percentage of accruals in the earnings profile narrowing to c.0% as of Q2 FY22. As seen below, accruals historically make up a small portion of earnings, and trends have been improving in this regard since Q2 FY21. Despite this, the percentage of current assets made up by accruals has increased to ~8% last quarter, in range with the past 3 years (and before the pandemic).
Exhibit 6. Percentage of accruals making up earnings remains low and has improved sequentially since FY19
Data: HB Insights, HSIC SEC Filings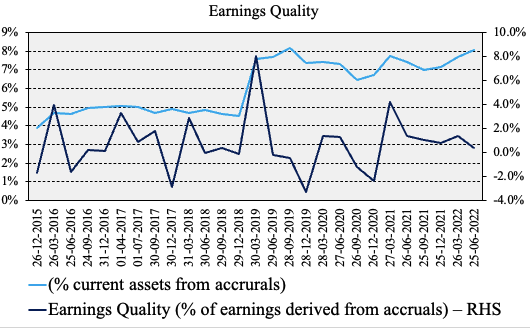
Valuation
Shares are also trading at a deep discount to peers across key multiples used in this analysis. We note HSIC trading at 2.9x book value which is a 44% discount to GICS Industry peers, whereas it is also trading at a 51% discount to peers at 16.7x P/E. However, the market has priced HSIC to deliver a below-sector result next year at 18x forward P/E, below the sector median’s 21.5x.
Exhibit 7. Multiples and comps
Data: HB Insights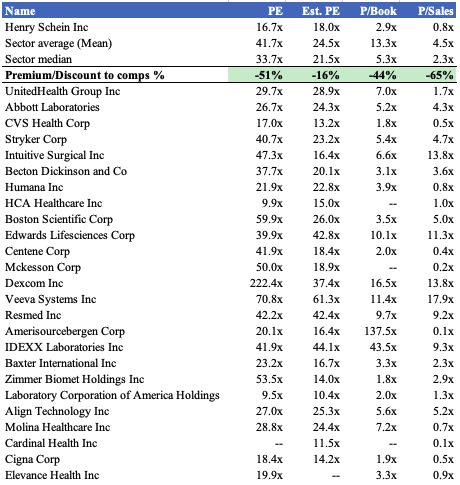
Referring back to Exhibit 6, we note that HSIC’s earnings are largely cash-based and light on accruals. On this note, the stock’s valuation is backed by cash/tangible value, and this gives us confidence in prescribing future value based on forward earnings targets.
Assigning the 18x forward P/E to our EPS estimates of $4.85 sets an initial objective of $87.30, seeking a return potential of ~18% to that level.
Portfolio Positioning
Backtesting of portfolio weighting reveals a substantial benefit of positioning HSIC on an equal-weight basis in a balanced portfolio, all the way down to a 2% weighting. Results of the testing are seen below, with special note to the performance of the balanced portfolio (portfolio 2) vs. the HSIC inclusion (portfolio 3).
Exhibit 8. Portfolio Positioning Test Results
Data: HB Insights, Portfolio Visualizer
Data: HB Insights, Portfolio Visualizer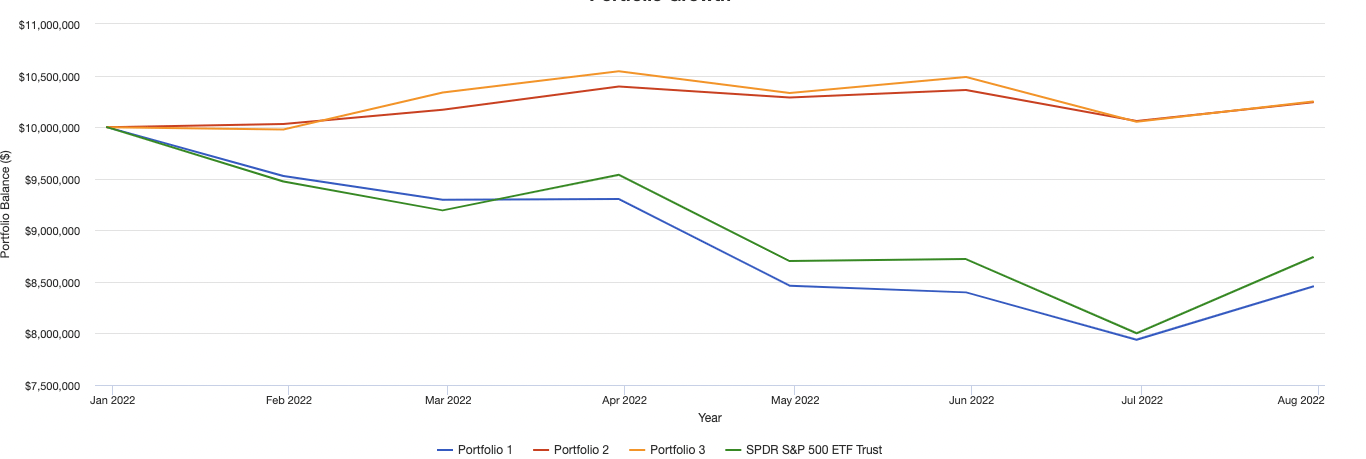
Data: HB Insights, Portfolio Visualizer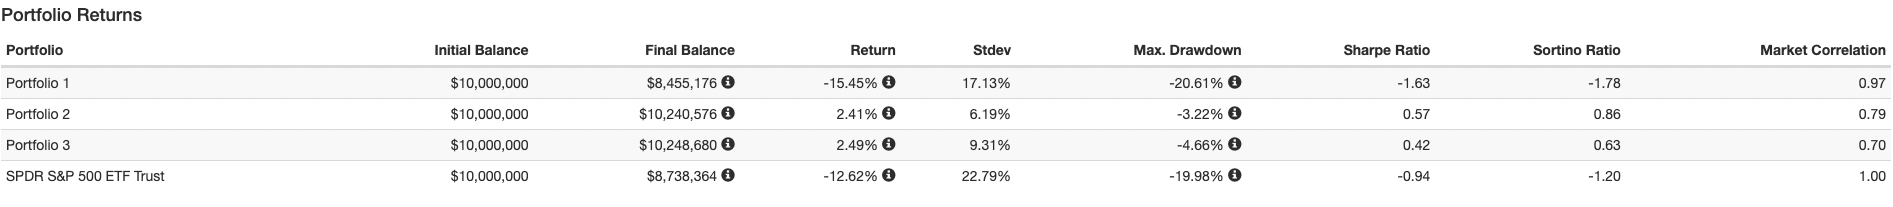
In Short
Those seeking to add a layer of resiliency in equity portfolios might consider a position in HSIC as part of their weighting towards defensives. The stock continues to churn higher on the chart over longer time frames, and we now receive 12% ROIC and 6% FCF yield at a market cap and enterprise value substantially lower than 5-7 years.
With this in mind, valuations are also conducive and the company’s earnings are backed by large portions of cash vs. accruals, providing more certainty on estimating future value based on earnings multiples. We price HSIC at $87.30 and rate it a buy to collect a ‘resiliency premium’ over the next 6-12 months.
Be the first to comment