

Miro Nenchev
In the last few months, the market condition for bulk carrier companies was not as strong as in the first quarter of 2022. Driven by the lockdowns in China, higher interest rates in the United States and European countries, and the war in Ukraine, the demand for bulk carriers decreased. However, the Golden Ocean (NASDAQ:NASDAQ:GOGL) stock price bounced back in the last few days. Also, Star Bulk Carriers (NASDAQ:NASDAQ:SBLK) stock price increased by more than 10% in the past five days. In terms of the market outlook, I expect a stronger market condition for GOGl and SBLK in the following months. Also, my analysis shows that both companies are well-positioned to make significant profits in the second half of 2022.
2Q 2022 highlights
In its 2Q 2022 financial result, GOGL reported total operating revenues of $317 million, compared with 2Q 2021 total operating revenues of $276 million, up 15%, driven by increased time charter revenues. The company’s total operating expenses decreased from $181 million in 2Q 2021 to $170 million in 2Q 2022, driven by significantly lower charter higher expenses. Golden Ocean reported a 2Q 2022 net income of $164 million, or $0.81 per diluted share, compared with a 2Q 2021 net income of $105 million, or $0.52 per diluted share. In the second quarter of 2022, GOGL’s cash and cash equivalents increased by 53% QoQ to $164 million. The company reported a 2Q 2022 EBITDA and adjusted EBITDA of $208 million and $192 million, respectively, compared with 2Q 2021 EBITDA and adjusted EBITDA of $144 million and $130 million, respectively. The total fleet on-hire days of the company decreased from 8633 in the second quarter of 2021 to 8486 in 2Q 2022. For the second quarter of 2022, Golden Ocean reported a TCE per day of $29431, compared with a 1Q 2022 TCE per day of $24920. “Golden Ocean delivered another strong result in the second quarter of 2022 despite trade disruptions and economic headwinds,” the CEO commented. “Despite recent weakness in freight rates caused by easing port congestion and the contraction in China’s economy due, in part, to zero COVID policy, our market outlook remains optimistic,” he continued.
In its 2Q 2022 financial results, Star Bulk reported voyage revenues of $417 million, compared with 2Q 2021 voyage revenues of $311 million as its TCE per day increased by 33% YoY and 11% QoQ to $30451 in 2Q 2022. The net income of the company increased from $124 million, or $1.22 per diluted share in 2Q 2021 to $200 million, or $1.95 per diluted share, in the second quarter of 2022. In the second quarter of 2022, the company’s EBITDA and adjusted EBITDA increased by 40% and 42% YoY to $251 million and 258 million, respectively. “With a limited supply of vessels, the upcoming environmental regulations curbing vessel ordering and speeds, our competitive operating costs, and our scrubber equipped fleet, we remain optimistic on the income earning prospects of our company despite a seemingly uncertain macroeconomic environment,” the CEO commented.
The market outlook
In the week ending 11 September 2022, Global iron ore shipments decreased by 17.5%. From 29 August 2022 to 4 September 2022, 2636 million tonnes of iron ore arrived at Chinese ports. This number decreased by 41% a week later. Also, iron ore shipment volume to China decreased from 1895 million tonnes in the week ending 4 September to 1652 million tonnes in the week ending 11 September. However, I expect the shipment volume of iron ore to Chinese ports to increase. According to the MMI daily iron ore index report, published on 13 September 2022, the increasing trend of total iron ore inventories at China ports has stopped (see Figure 1). Also, total China iron ore import volumes increased by about 5 million tonnes in August 2022 (see Figure 2).
Figure 1 – Total iron ore inventories at China ports
MMI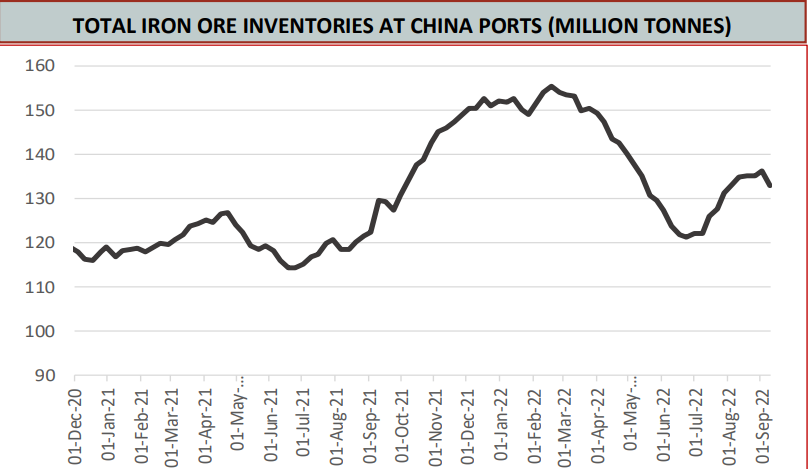
Figure 2 – Total China iron ore import volumes
MMI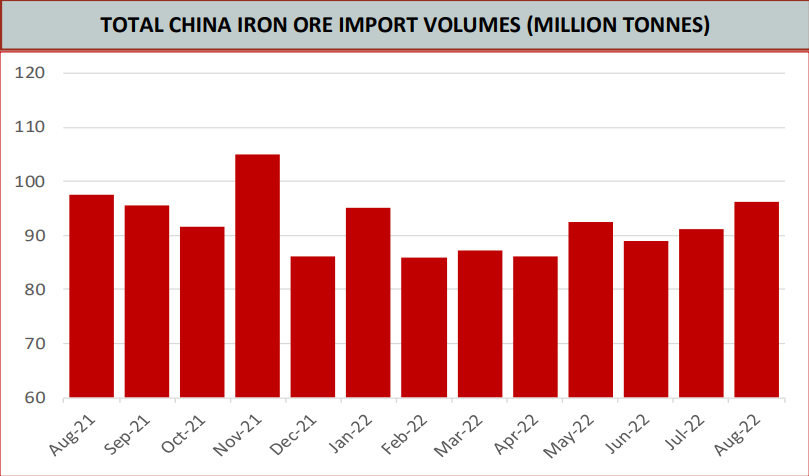
Moreover, Chinese rebar and hot-rolled coil production increased in the last few weeks (see Figure 3). Furthermore, Chinese rebar and hot-rolled coil consumption in September 2022 are getting close to their levels in September 2021. Baltic Dry Index shows that after a significant drop from more than 3000 in May 2022 to below 1000 at the end of August 2022, the index has bounced back by more than 40% in the past two weeks (see Figure 4). Thus, after experiencing a weak period during the past few months, the market condition for bulk carrier companies is improving.
Figure 3 – Chinese steel consumption and production
MMI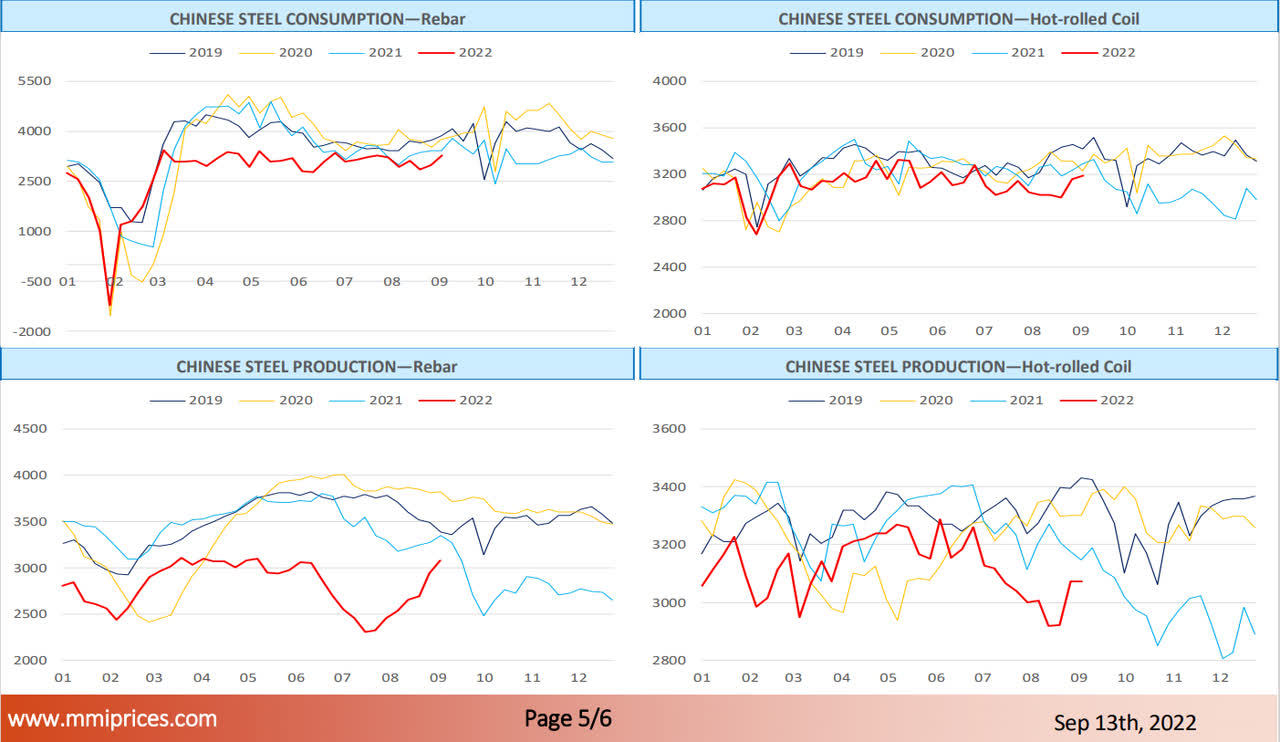
Figure 4 – The Baltic Dry Index
tradingeconomics.com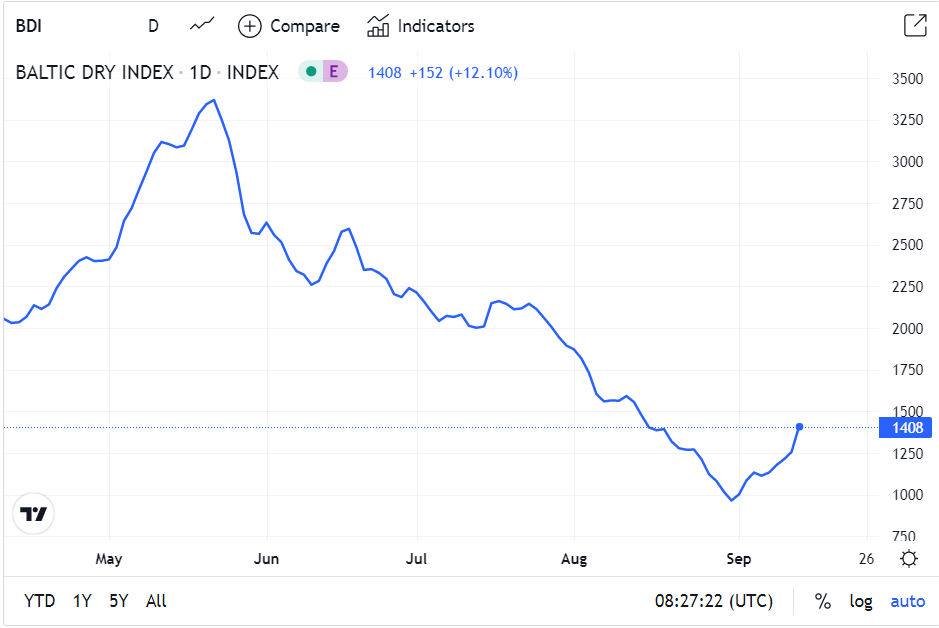
Performance
In this section, I cater a minutiae analysis Under the lenses of Golden Ocean and Star Bulk’s financial metrics. According to GOGL’s leverage conditions, a decreasing net debt aligned with an improvement in EBITDA led to a decline in the company’s net debt-to- EBITDA amount of 6.61 in Q2 2022, compared with its previous level of 9.47 in Q1 2022. Furthermore, following its lower net debt and higher operating cash flow, it is not surprising to see its leverage ratio decrease across its net debt-to-operating cash flow to sit at 7.6 at the end of Q2 2022 versus the last quarter’s 10.34. Hence, Golden Ocean Group illustrates financial stability under the lens of leverage ratios. Meanwhile, to provide a capture of the liquidity condition, their current and cash ratios moved slowly forward and sat at 1.54 and 0.71 in the second quarter of 2022, respectively. (see Figure 5).
Figure 5 – GOGL leverage and liquidity ratios
Author (based on SA data)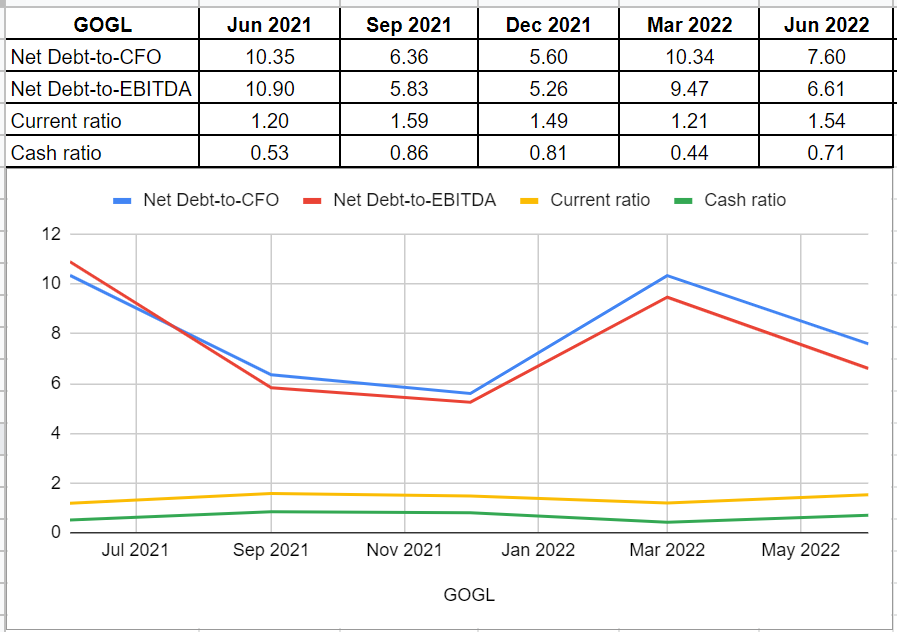
On the other hand, according to Star Bulk’s leverage and liquidity conditions, it is observable that its lower amount of net debt, higher amount of EBITDA, and operating cash flow versus GOGL led to better leverage ratios. In Q2 2022, SBLK’s net debt-to-EBITDA and net debt-to-CFO were 4.08 and 4.3, respectively.
Following SBLK’s strong cash and capital performance, it is not surprising to observe increases in its liquidity ratios. The company’s current ratio of 2.07 in Q2 2022 was 84% higher than its result of 1.12 at the end of Q2 2021. Albeit a slight decrease in the cash ratio compared with the first quarter of 2022, there is a twofold increase in the cash ratio of 1.27 compared with its amount of 0.63 at the same time last year. In short, Star Bulk’s healthy liquidity position is observable from its liquidity ratios (see Figure 6).
Figure 6 – SBLK’s Leverage and Liquidity ratios
Author (based on SA data)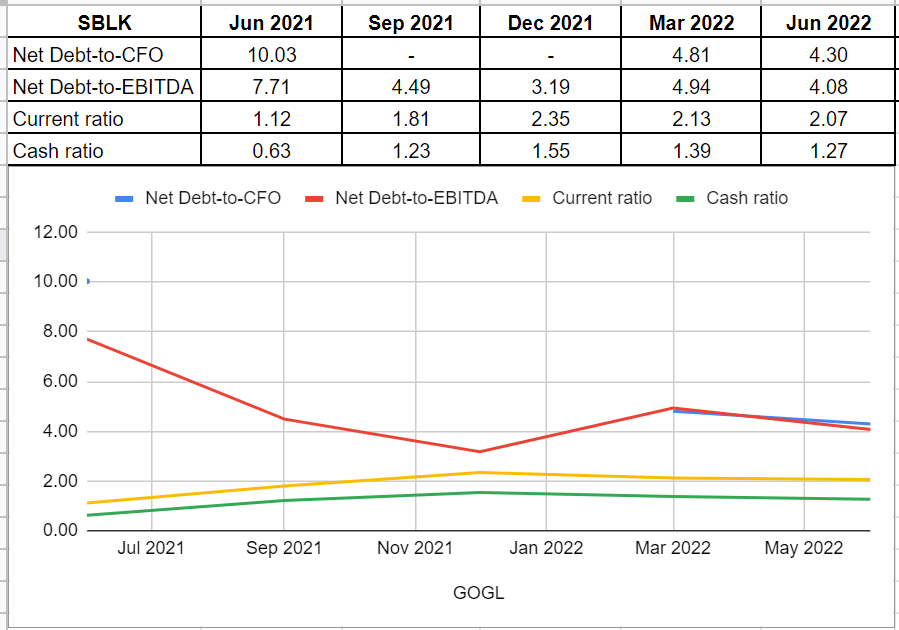
Furthermore, we can analyze Golden Ocean’s coverage ability across the board of its interest-coverage and cash-coverage ratios and compare them with Star Bulk. GOGL’s ICR in Q2 2022 indicates that 31 times the company can pay its interest expenses on its debt with its operating income. Golden Ocean’s interest coverage ratio has improved three times versus its amount at the same time last year. Similarly, as a conservative metric to compare the company’s cash balance to its annual interest expense, GOGL’s cash-coverage ratio in Q2 2022 was 34.89, which shows an astonishing increase compared with its level of 16.47 in Q2 2022. So, thankfully, the company’s well-generated free cash flow eliminates concerns about its ability to cover obligations in case of slow recovery after the COVID-19 pandemic. Under the lens of Golden Ocean’s profitability, it is worthwhile to mention that both return-on-asset and net profit margin amounts improved in Q2 2022 compared with the same time last year. Its ROA and net profit margin were 0.05 and 0.52, respectively, in the recent quarter. All was said and done, Golden Ocean’s profitability ratios indicate that the company is performing well by generating revenue and cash flow (see Figure 7).
Figure 7 – GOGL profitability and coverage ratios
Author (based on SA data)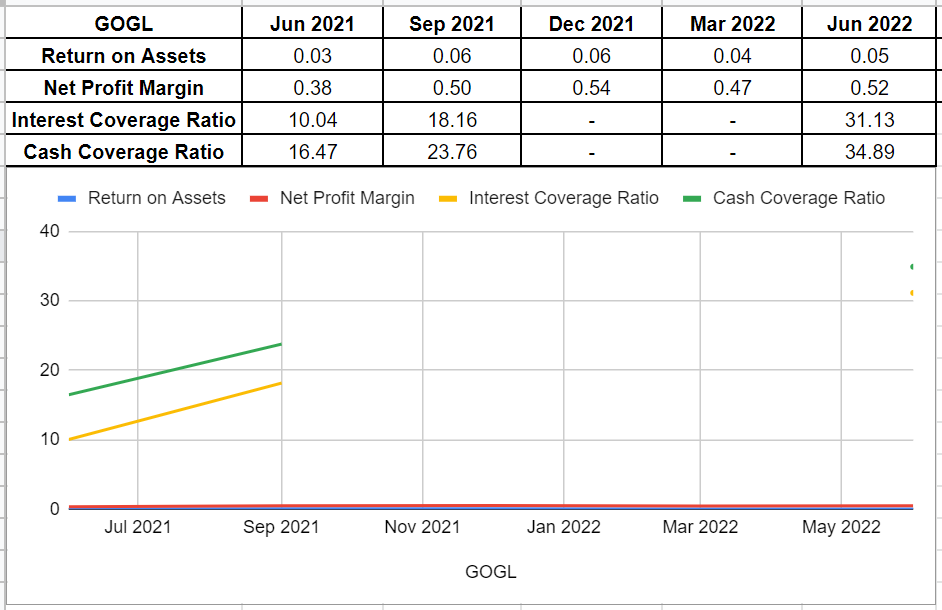
In the case of Star Bulk’s profitability and coverage ratios, SBLK’s net profit margin showed a 12 bps decline since the start of 2022 and sat at 48% in Q2 2022, although it improved slightly from 40% at the same time in 2021. Notwithstanding a decrease since the start of 2022, SBLK’s ROA amount has been fairly unchanged. The ROA ratio in Q2 2022 shows that 5% of the company’s net earnings is related to its total assets. Moreover, as a measurement to calculate its ability to pay the interest expenses on debt with its operating income, Star Bulk’s ICR was 17.5 in Q2 2022, which was lower than Golden Ocean’s. Furthermore, comparing SBLK’s cash balance to its annual interest expense shows the company’s potential to cover its interest about 32 times (see Figure 8).
Figure 8 – SBLK profitability and coverage ratios
Author (based on SA data)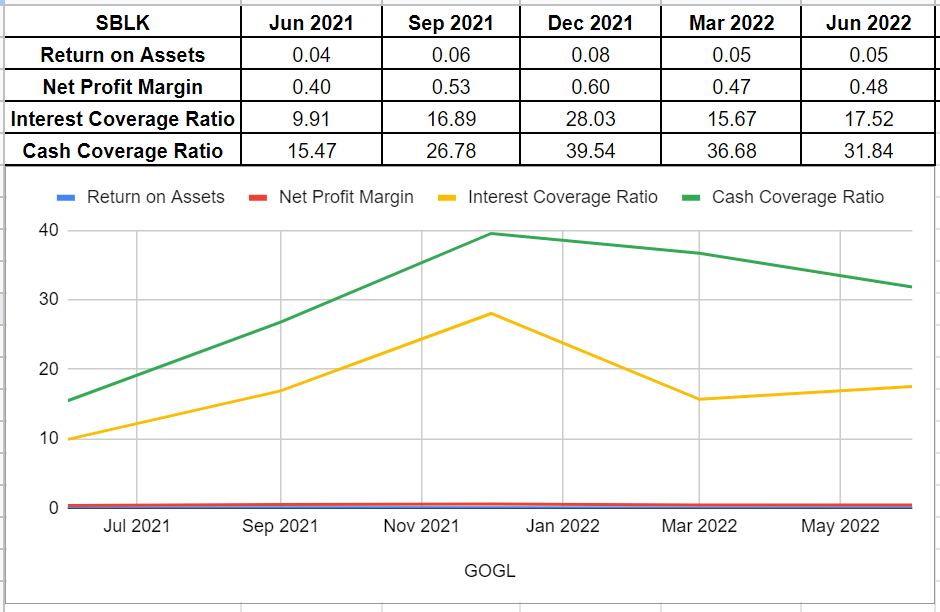
Conclusion
Although China’s lockdown, as the second-largest economy in the world, could affect the steel supply and shipping industry severely, we know that this situation is most likely temporary, and a brighter future could be waiting for the shipping companies. Thus, in my opinion, it is worthwhile to analyze and compare dry bulk companies in different aspects to give the best shot. In this regard, I analyzed Golden Ocean’s leverage, liquidity, profitability, and coverage ratios and compared them with its peer, Star Bulk. Both companies are in a healthy position in general, and thus, I believe they are a Buy.
Be the first to comment