

eranicle/iStock via Getty Images
Cambria Emerging Shareholder Yield ETF (BATS:EYLD) is an around $89 million actively-managed fund investing in about one hundred or at times fewer emerging market equities exhibiting quality and value characteristics.
The concept of the shareholder yield applied by the fund is based on dividends, share repurchases, and debt reduction. Another way of saying, EYLD favors cash-rich, efficient emerging market companies capable of growing organically and without taking excess borrowings, thus maximizing shareholder value.
The allure of its strategy is a peculiar yet potentially lucrative mix of the EM-specific risk discounts with the quality factor that should ensure the weakest players (value and yield traps included) never percolate into its portfolio, adding an aura of relative safety, something that EM investors would certainly appreciate.
Additionally, exposed to a few EM currencies that have taken a battering this year, EYLD could also be a bet on U.S. inflation to be ultimately quelled, and the USD trimming some gains of the hawkish 2022 in case traders start dialing back their bets on more aggressive Fed moves going forward. It could be already noticed that the growth premia issue has become less of a concern for investors as the tech- and growth-heavy iShares Core S&P 500 ETF (IVV) extended its July rebound well into August, supported by the recent CPI and PPI reports.
Anyway, the main weakness of this premise is that materials- and energy-heavy EYLD, in essence, should be a pro-inflation bet, so in case the EM currencies it is most exposed to regain ground against the greenback while its major coal- and oil-producing holdings give up gains as the surging prices narrative retreat and traders crank up bearish bets on commodities, the ETF would end up trading sideways.
That said, while appreciating its gargantuan LTM yield of 8.4% which secured its A+ Dividend grade, I should warn investors of the risks surrounding emerging markets, while also reminding them that this quality strategy comes with a hefty expense ratio of 65 bps that will be a major detractor from its performance over the long term.
The solid cash-centered investment strategy
While not tracking an index, EYLD has a carefully described multi-step stock selection process, which makes its portfolio decisions more predictable and explainable than when it comes to less transparent active funds.
It has an immense selection universe encompassing equities from a few emerging markets from locomotives like China, India, and Brazil to smaller players like the Czech Republic, Greece, and Thailand. An essential remark is that EYLD does include Korean equities in this pool, while funds sticking to benchmarks provided by S&P Dow Jones Indices ignore them as the index provider upgraded South Korea to a developed market in the 2000s already. The SPDR Portfolio Emerging Markets ETF (SPEM) is a nice example.
Companies face a complicated test designed to reveal whether they are capable of returning cash to debt and equity investors and whether they trade at reasonable levels.
In short, “cash payments for dividends, buybacks, and debt paydown” are amalgamated to select those EM equities that boast the highest shareholder yields. For the value factor, a few metrics including EV/EBITDA and P/E are then considered. After all, the 100 equities sporting the best value and quality (shareholder yield) characteristics are selected for the portfolio.
Despite active strategy, the fund’s equity basket remains comparatively homogenous when it comes to country exposure. In the current iteration, EYLD is a mix of predominantly Chinese, Taiwanese, and South African equities. This has also been the case in March 2021 as the factsheet saved by the Wayback Machine illustrates. Even in June 2018, Chinese stocks occupied the top spot with over 24% weight, followed by Taiwan and South Africa.
It should also not go unnoticed that EYLD has a meaningfully larger allocation to Turkey (about 10%) compared to the iShares MSCI Emerging Markets ETF (EEM) and iShares Emerging Markets Dividend ETF (DVYE); for example, the former has less than 2% invested in Istanbul quoted equities, with the latter having approximately 32 bps. Lira bulls would be happy to own it, less so Turkey skeptics, who would riposte here that astronomical inflation in the country is a good reason to avoid it.
However, sector exposures are less stable. Substantial changes could be observed in recent years. For example, in March 2021, it was overweight materials (close to a quarter of the net assets) and technology (23.5%), with industrials in third place (14.8%). In 2018, technology even was the key sector, accounting for 18.4%, with financials in second place (16.8%). As of end-June 2022, materials (26%) climbed to the first position, followed by energy (17.9%), while tech was only in third place (17.4%).
So over the medium-to-long term, investors should be prepared for fluctuating sector exposure. For example, in case of a global recession, companies operating in the materials sector would see weaker cash flows and, hence, it would be tougher for them to pay dividends and repurchase shares (most will likely even suspend buybacks), and their shareholder yields would shrink, making it more complicated for them to qualify for EYLD. The recession should also send commodities into a tailspin, resulting in a pullback in energy equities. This should allow asset-light tech companies to climb back to the top spot.
Performance review: unfavorable macro bolster risk discounts in 2022
Geopolitics and the energy crisis stirred volatility for EM equities this year. A slew of bearish factors including historic strength in the U.S. dollar amid yield differentials raised concerns about whether less developed nations could cope with the economic stresses of 2022, including woes related to servicing of their USD-denominated debt in the wake of higher rates and weaker currencies.
EM portfolios saw five consecutive months of outflows, the longest streak since 2005 as illustrated by the data published by the Institute of International Finance on August 3. This chimes well with the International Monetary Fund downgrading the 2022 and 2023 growth forecast for EM and developing countries in its July update by 20 bps and 50 bps, respectively, with the downward revisions being most significant for EM locomotives, namely China and India. While the growth profile became bleaker, reasons to stick with equities exposed to the EM risks were wearing thin, which likely stimulated outflows.
One of the consequences of investor exodus from EM equities is an F Momentum grade of the EYLD ETF. Its solid cash-centered strategy did not save it from an almost 24% price decline YTD. However, its historical returns since inception are more encouraging. For example, it even managed to beat the iShares Core S&P 500 ETF in 2017, and grossly. The following tables add a bit more context, comparing EYLD’s monthly and annual returns to IVV.
Created by the author using data from Portfolio Visualizer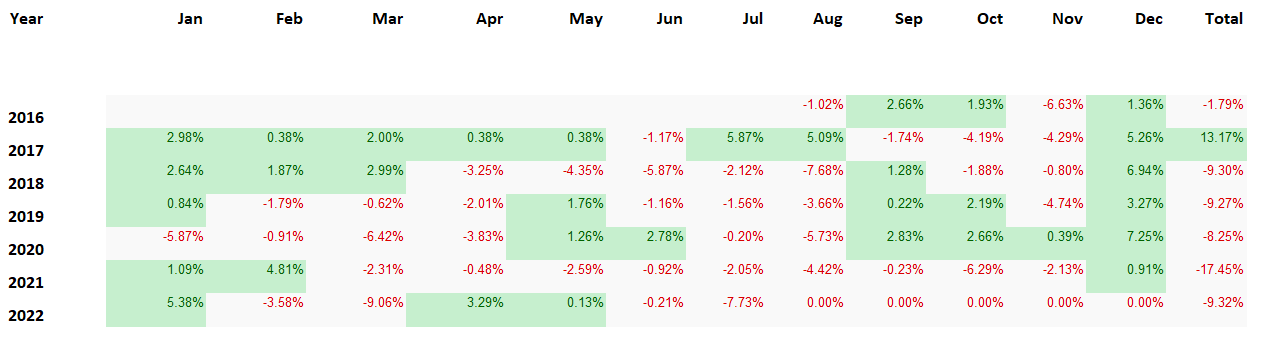
However, though unable to outmaneuver the racier IVV, it clearly had an edge over the dividend-centered DVYE as it underperformed this iShares ETF only in 2018 while delivering solid alpha in other years except for 2021 when it was only marginally stronger. The table below illustrates this vividly.
Created by the author using data from Portfolio Visualizer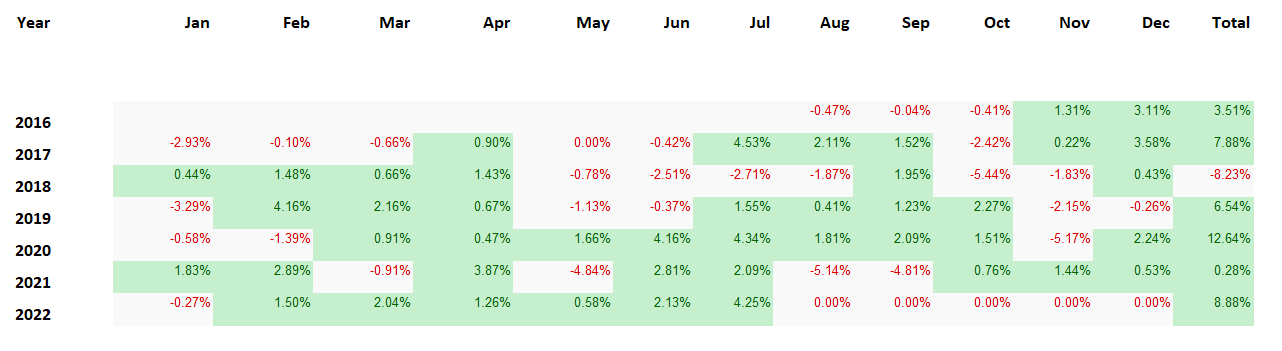
Besides, it also outperformed EEM over the August 2016 – July 2022 period, though with higher volatility. Anyway, the U.S.-centered Cambria Shareholder Yield ETF (SYLD) still did better as its U.S. holdings were immune to FX headwinds.
Created by the author using data from Portfolio Visualizer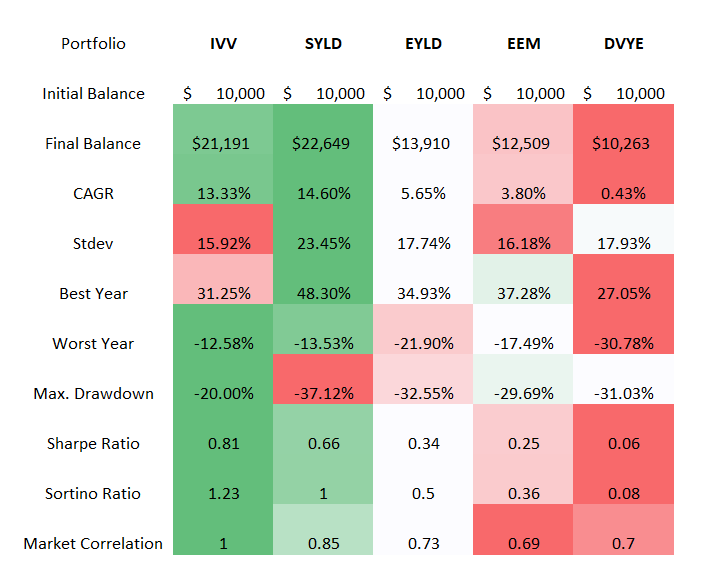
Final thoughts. Is cash-centered EYLD a Buy?
I like the concept of the shareholder yield applied to EM equities. This is an efficient way to separate the wheat from the chaff, investing only in the strongest and safest (comparatively), while also maintaining exposure to the value factor.
Its massive LTM distribution yield of 8.4% supports the point that EYLD succeeded in the selection of the less expensive cash-rich EM companies. Also, its portfolio has single-digit P/E and P/cash flow as shown in the factsheet.
What I dislike about the fund are its expenses that will consistently eat into returns over the long term. Additionally, assuming I have become much more skeptical about investing in less developed economies due to personal experience, I would opt for the Hold rating for EYLD this time and once again remind my dear readers to do their own due diligence.
Be the first to comment