

Deagreez
The 401(k) is a glorious thing, allowing you to reduce your tax bill while saving for the future. The only thing better is the Roth IRA, which lets you compound savings (with no tax benefit) but tax-free forever.
Small-business owners get a special treat from the IRS.
- $66K contribution limit to their SEP 401(k)
- up to $22,500 (including in the cap) for their Roth IRA.
In other words, if you’re self-employed and make at least 4X this much, you can reduce your adjustable gross income by $43.5K to $66K.
- tax savings of this amount X your top marginal tax rate (Federal, State, and Local).
How much savings is that? For me it’s $22K per year.
For someone living in NYC, where the top rate is 55%, it’s potentially as much as $36K.
The power of such tax savings is incredible. Consider this. In 2022, Congress passed the SECURE ACT 2.0.
- by 2033 RMD limits on 401(k)s will go up to 75 years old
- in other words, until age 75 you can keep contributing and let your money compound 5 more years.
If you’re 40 years old, that’s potentially 35 years with tax savings as high as $36K per year, or $1.26 million in tax savings alone!
The average retired couple at age 65 has $510K, so tax savings alone, even if invested into cash (which is expected to just keep up with inflation long-term), is all you need to do.
For me, I’m looking at 39 years of tax savings totaling $858,000, also enough to retire on comfortable.
Could I just invest that in the S&P 500 and retire in comfort? You bet.
In fact, it’s what Warren Buffett recommends.
But why settle for retiring in comfort when you can retire in safety and splendor?
By combining the world’s best blue-chip assets, you can achieve:
- 30% better annual returns than the S&P 500
- with 3.5X higher safe yield
- with 33% lower annual volatility
- and 33% to 66% smaller peak declines during even the most extreme market crashes.
How on earth can you accomplish such a miracle? Let me show you how I’m doing just this with my 401(k).
Why I’m Investing 100% Of My 401(k) Into 5 World-Beater Blue-Chips
In 2023 I’m going to rebalance my portfolio around five world-beater blue-chip assets based on the Dividend Kings ZEUS retirement portfolio strategy.
- 33% blue-chip ETFs
- 33% hedging assets (what you sell in a bear market to buy blue-chip bargains)
- 33% individual stocks.
ZEUS = Zen Extraordinary Ultra SWAN (sleep well at night) and let me show you why it lives up to that name.
In fact, ZEUS is the king of sleep well at night retirement portfolios.
Now there are infinite combinations of the ZEUS portfolio.
Here is my Uncle’s ZEUS Income Growth Portfolio.
Here is our family friend Rose’s ZEUS High-Yield Ultra-Low Volatility portfolio.
You can build a ZEUS portfolio to optimize for any goal you want.
- maximum safe yield today
- maximum safe retirement income over time
- maximum long-term returns
- low volatility
- safety and quality.
You can use anywhere from 1 stock exchange-traded fund (“ETF”) to as many as you want (1 to 3 works best for most people).
You can use using hedging ETFs like EDV (long duration US treasuries), DBMF (the Vanguard of hedge funds), SHY – cash.
And you can buy anywhere from 2 to 20 individual blue chips, which is the key to this strategy.
- the bonds, managed futures, and cash help you sleep well
- the stock ETFs ensure you can’t lose all your money
- the individual blue-chips turbocharge your yield, growth, and total returns.
Let me show you how I built my personally optimal ZEUS 401(k) retirement portfolio.
- my Roth IRA is the same thing, just 1/3rd the size.
How I Built The Perfect 401(k) Portfolio For Me
I’ve linked to articles explaining why each of these world-beater blue-chip assets is worth investing in, including the growth outlook, investment thesis, and risk profile.
(Source: DK Research Terminal, FactSet, Morningstar)
This is as simple and concentrated a portfolio as is reasonable and prudent, and look at how it compares to the S&P 500 and 60/40.
| Metric | 60/40 | ZEUS Income Growth Portfolio | X Better Than 60/40 |
| Yield | 2.25% | 5.0% | 2.22 |
| Growth Consensus | 5.1% | 8.2% | 1.61 |
| LT Consensus Total Return Potential | 7.4% | 13.2% | 1.80 |
| Risk-Adjusted Expected Return | 5.1% | 9.2% | 1.80 |
| Safe Withdrawal Rate (Risk And Inflation-Adjusted Expected Returns) | 2.9% | 7.0% | 2.42 |
| Conservative Time To Double (Years) | 25.0 | 10.3 | 2.42 |
(Source: DK Research Terminal, FactSet, Morningstar)
Superior fundamentals to the 60/40 in every way.
| Metric | S&P 500 | ZEUS Income Growth Portfolio | X Better Than S&P 500 |
| Yield | 1.8% | 5.0% | 2.78 |
| Growth Consensus | 8.5% | 8.2% | 0.96 |
| LT Consensus Total Return Potential | 10.3% | 13.2% | 1.28 |
| Risk-Adjusted Expected Return | 7.2% | 9.2% | 1.28 |
| Safe Withdrawal Rate (Risk And Inflation-Adjusted Expected Returns) | 4.9% | 7.0% | 1.41 |
| Conservative Time To Double (Years) | 14.6 | 10.3 | 1.41 |
(Source: DK Research Terminal, FactSet, Morningstar)
Superior fundamentals to the S&P 500 in every way.
| Metric | SCHD | ZEUS Income Growth Portfolio | X Better Than SCHD |
| Yield | 3.5% | 5.0% | 1.43 |
| Growth Consensus | 7.6% | 8.2% | 1.08 |
| LT Consensus Total Return Potential | 11.1% | 13.2% | 1.19 |
| Risk-Adjusted Expected Return | 7.8% | 9.2% | 1.19 |
| Safe Withdrawal Rate (Risk And Inflation-Adjusted Expected Returns) | 5.5% | 7.0% | 1.27 |
| Conservative Time To Double (Years) | 13.1 | 10.3 | 1.27 |
(Source: DK Research Terminal, FactSet, Morningstar)
Superior fundamentals to SCHD in every way.
| Metric | QQQM | ZEUS Income Growth Portfolio | X Better Than QQQM |
| Yield | 0.80% | 5.0% | 6.25 |
| Growth Consensus | 11.8% | 8.2% | 0.69 |
| LT Consensus Total Return Potential | 12.6% | 13.2% | 1.05 |
| Risk-Adjusted Expected Return | 8.8% | 9.2% | 1.05 |
| Safe Withdrawal Rate (Risk And Inflation-Adjusted Expected Returns) | 6.6% | 7.0% | 1.06 |
| Conservative Time To Double (Years) | 11.0 | 10.3 | 1.06 |
(Source: DK Research Terminal, FactSet, Morningstar)
Heck, it’s higher return potential than the Nasdaq, but with 6.3X the safe yield!
What kind of difference could this ZEUS 401(k) portfolio make for me over the next 40 years (when I have to start taking RMDs)?
Inflation-Adjusted Consensus Portfolio Value: $43,500 (2023’s Contribution)
| Time Frame (Years) | 5.1% CAGR Inflation-Adjusted 60/40 | 10.9% Inflation-Adjusted ZEUS 401(k) Portfolio | Difference Between ZEUS 401(k) Portfolio Consensus and 60/40 Consensus |
| 5 | $55,801.70 | $72,871.80 | $17,070.10 |
| 10 | $71,582.30 | $122,075.84 | $50,493.54 |
| 15 | $91,825.62 | $204,503.13 | $112,677.52 |
| 20 | $117,793.70 | $342,586.47 | $224,792.77 |
| 25 | $151,105.50 | $573,905.58 | $422,800.08 |
| 30 | $193,837.80 | $961,414.53 | $767,576.73 |
| 35 | $248,654.70 | $1,610,574.88 | $1,361,920.18 |
| 40 | $318,973.70 | $2,698,057.23 | $2,379,083.53 |
(Source: DK Research Terminal, FactSet)
On just 2023’s 401(k) contribution alone, potentially $2.4 million in additional inflation-adjusted wealth.
- don’t just retire in comfort retire in safety and splendor.
| Time Frame (Years) |
Ratio ZEUS 401(k) Portfolio Consensus Vs 60/40 Consensus |
| 5 | 1.31 |
| 10 | 1.71 |
| 15 | 2.23 |
| 20 | 2.91 |
| 25 | 3.80 |
| 30 | 4.96 |
| 35 | 6.48 |
| 40 | 8.46 |
(Source: DK Research Terminal, FactSet)
That’s 8.5X potentially better long-term inflation-adjusted returns than the 60/40.
Ok, so on paper this ZEUS 401(k) portfolio sounds amazing, one might even say extraordinary. 😉
But is it really safe to invest all of your 401(k) savings into just five stocks?
(Source: Morningstar)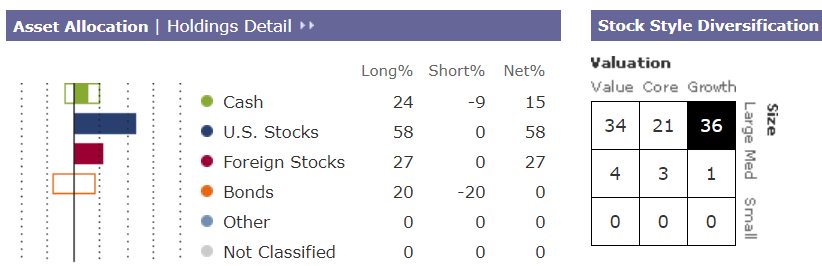
This portfolio is effectively 15% cash (via DBMF), 58% U.S. stocks. and 27% foreign stocks.
It’s perfectly balanced between value, growth, and core holdings.
What about bonds? Aren’t those the best recession hedges in history?
Duke University 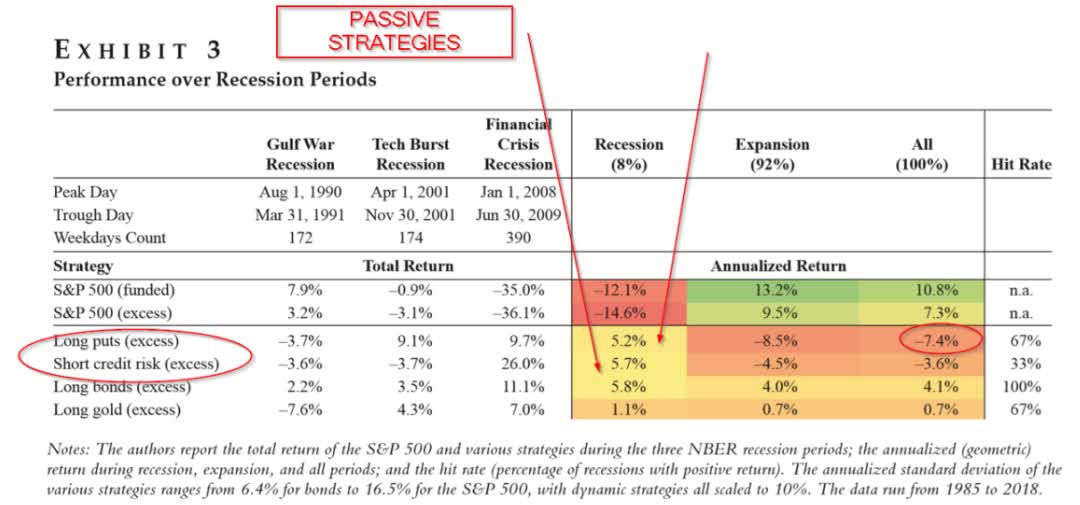
Indeed they are. BUT bonds are a “risk-off” asset that historically deliver 4% long-term returns.
Managed futures are an adaptable strategy that goes long/short stocks, bonds, currencies, and commodities. And guess how managed futures perform in market downturns?
DBMF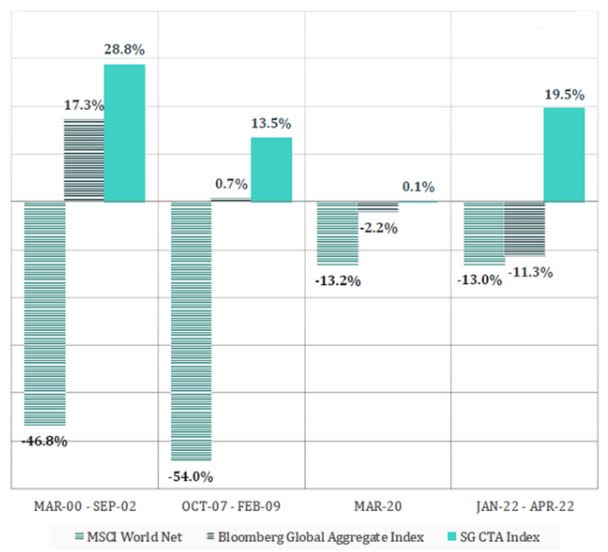
They do a great job of hedging falling stock prices. They even do a wonderful job of hedging the 8% of times stocks and bonds fall together.
But what about stagflation? This is the first time in 40 years we’ve had sky-high inflation and soaring interest rates.
Sure, managed futures did great in the first quarter of 2022, but what evidence do we have that they work in stagflationary conditions? Or just other bear markets, like the 1991 recession, and 1987 Black Monday crash?
Managed Futures Annual Returns 1980 to 1992
Barclays Barclays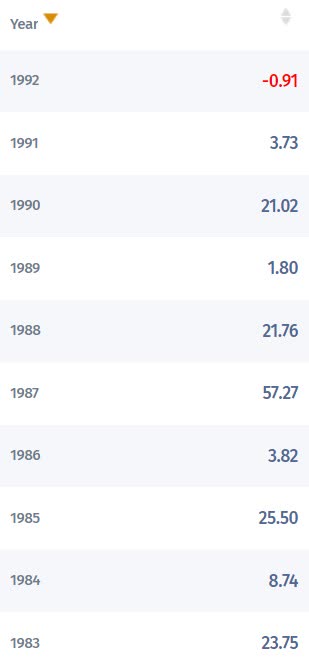
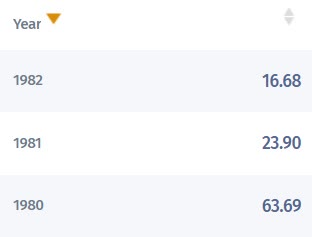
Stagflation hell in the earl[y 1980s? Managed futures doubled.
1987 Black Monday crash? They soared almost 60%.
1990 recession (when the S&P fell 20%)? Managed futures rose 21%.
Bonds tend to rise more in a recession, BUT managed futures tend to outperform bonds by about 0.5% per year (with higher volatility).
And DBMF has averaged 5% higher returns than its peers because of its much lower fees (4% lower) and because it tracks the top 20 hedge funds in the world.
- by definition the 20 largest hedge funds are the ones who have the best strategies that’s why they are ones with the most assets under management
In other words, rather than give up 0.5% yield and 1% annual returns for the lower volatility of bonds, I’m happy to trade a bit more volatility for superior income and returns.
- it’s still a very low volatility portfolio
- though I check my 401(k) once per year when I add money and rebalance so I don’t care about volatility
OK, but you own just 2 individual stocks, isn’t that reckless?
AMZN and BTI are my highest conviction high-yield and hyper-growth Ultra SWAN recommendations.
- 80% confidence they will be great long-term investments
- the Marks/Templeton certainty limit on individual companies
- “I’ll die on this hill” confidence
And let’s not forget that 33% of the portfolio is invested into 2 ETFs that own 200 of the world’s best growth and high-yield blue-chips.
200 Of The World’s Best Blue-Chips
(Source: Morningstar) (Source: Morningstar) (Source: Morningstar) (Source: Morningstar) (Source: Morningstar)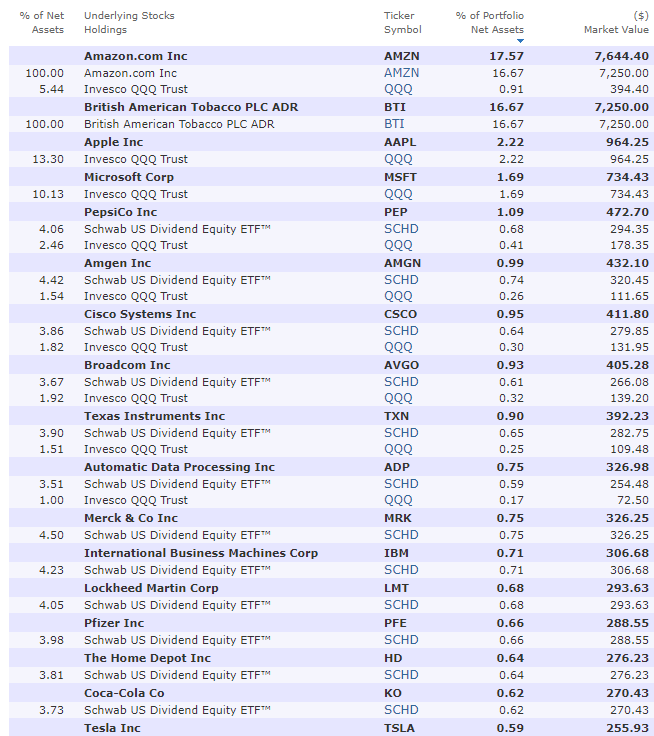
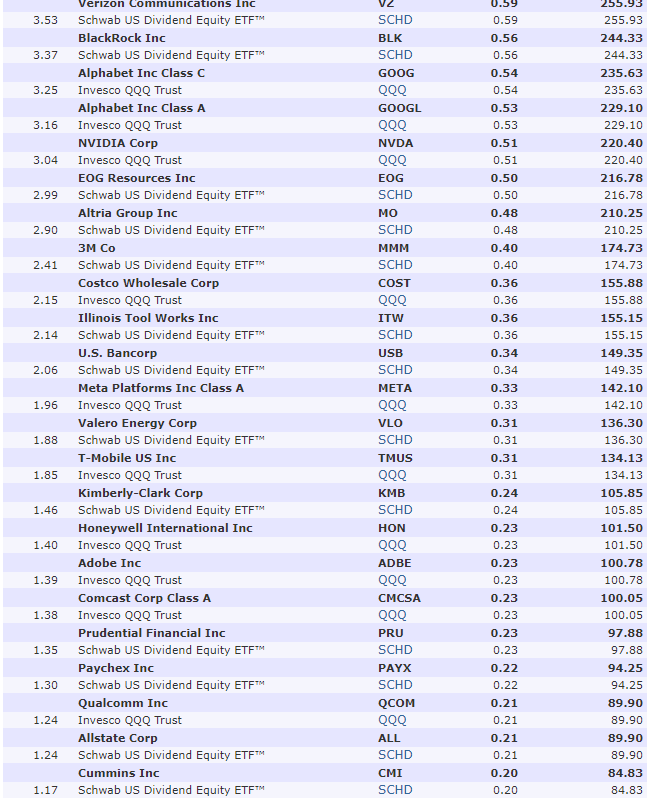
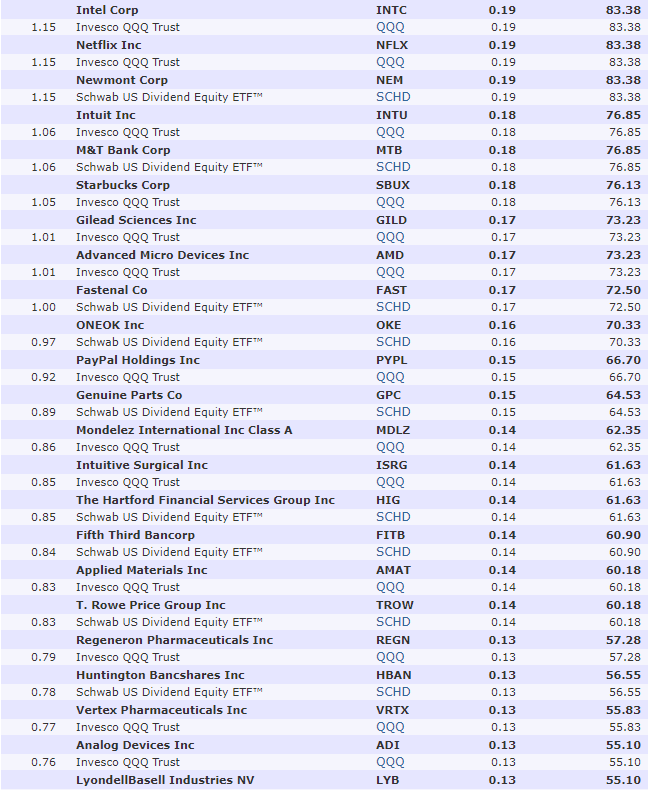
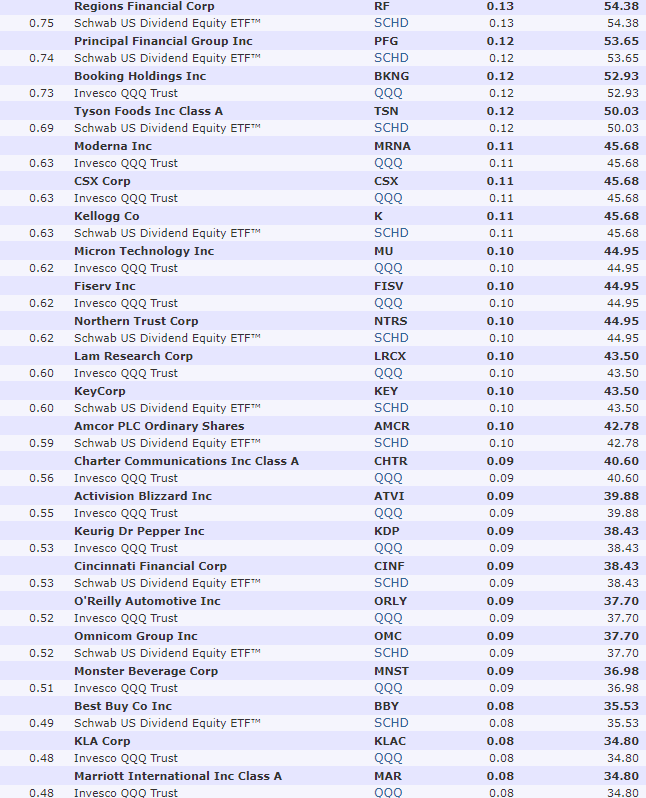
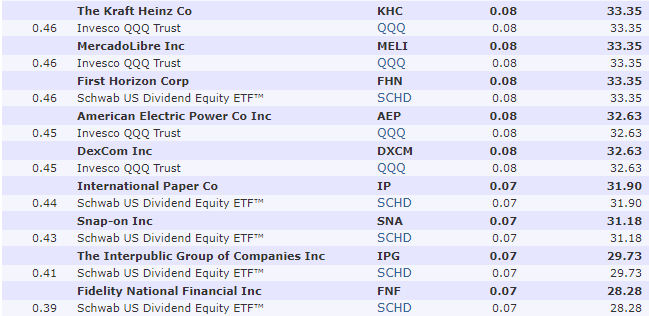
I’ll own a highly diversified collection of All-star blue chips.
(Source: Morningstar)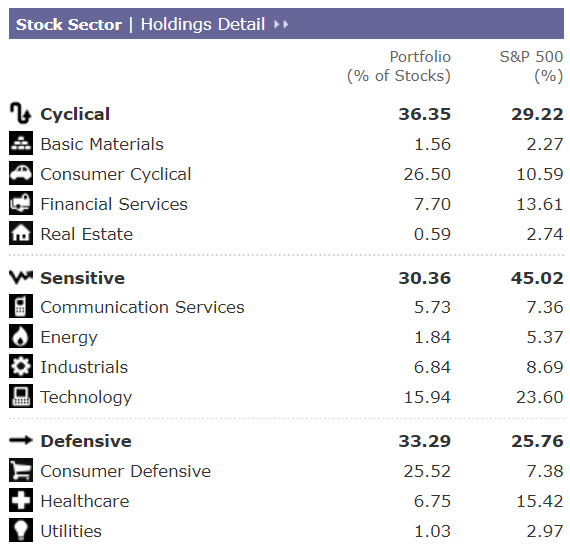
Representing every sector of the economy.
(Source: Morningstar)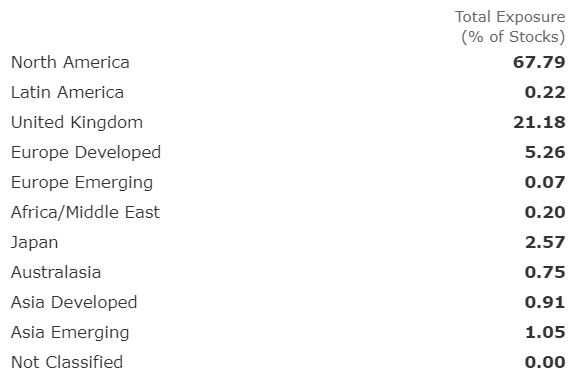
And with exposure to every part of the world, though focused on North America and the UK, were most world-beaters are from.
(Source: Morningstar)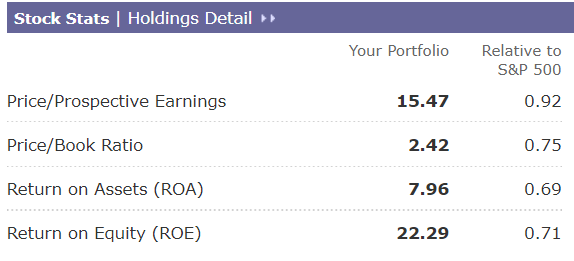
A portfolio that’s trading at a better valuation than the S&P 500, but with far stronger growth and which Morningstar estimates is 25% undervalued.
- 5% yield + 8.2% growth + 5.9% CAGR valuation boost = 19.1% CAGR consensus return potential over the next five years
Buffett like return potential for the next five years?
5% safe yield today?
And long-term return potential better than the Nasdaq, S&P, dividend aristocrats, SCHD, and just about any mutual fund or ETF you can think of?
Yes, I’ll take some of that, thank you very much;)
(Source: Morningstar)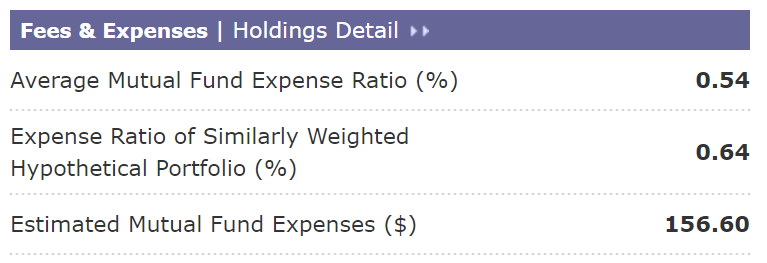
0.54% expense ratio is much higher than the S&P 500 and 2.5X more than the Nasdaq.
But remember this is effectively a hedge fund, and hedge funds average 5% annual fees, in exchange for lower returns than what ZEUS 401(k) is offering.
OK, so this sounds truly spectacular. In theory, a near-perfect retirement portfolio to set and forget and rebalance once per year while sleeping well at night no matter what happens in the future.
All models are wrong, but some are useful.” – British Statistician George E.P Box
BUT what evidence is there that this 401(k) portfolio actually works as designed?
Super high high? Super high returns? Super low volatility?
Historical Returns Since March 2007 (The Entire Great Recession)
- substituting RYMTX for DBMF
- RYMTX is a 2-star Morningstar rated managed futures fund
- DO NOT BUY IT
- DBMF is expected to deliver FAR BETTER returns
Managed Futures Since June 2019
(Source: Portfolio Visualizer)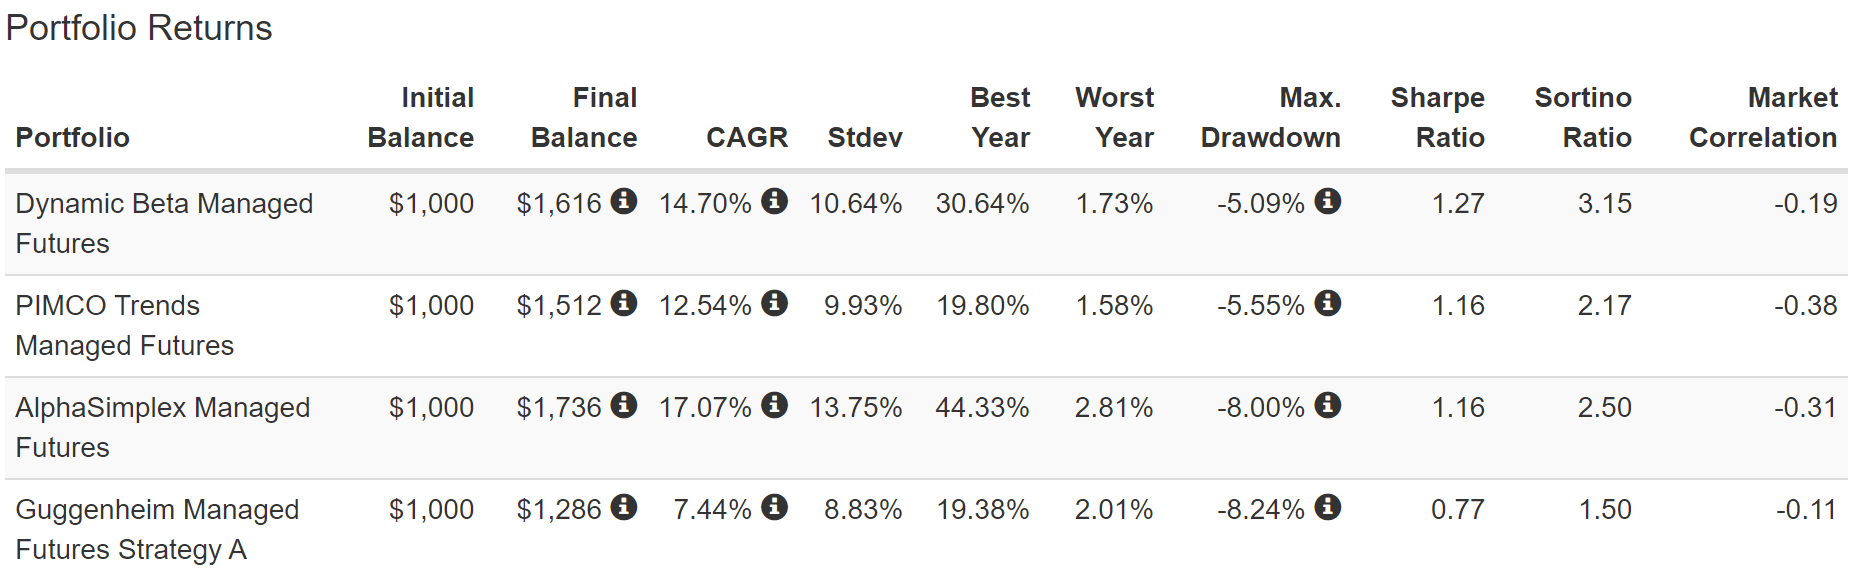
Managed futures as an asset class are highly negatively correlated to both stocks and bonds. That’s why they are such great diversifiers.
But note how RYMTX, a 2 star rated fund, gets crushed by 4 and 5 star rated DBMF, GIFMX, PQTAX, and AMFAX.
Managed Futures Since February 2016
(Source: Portfolio Visualizer)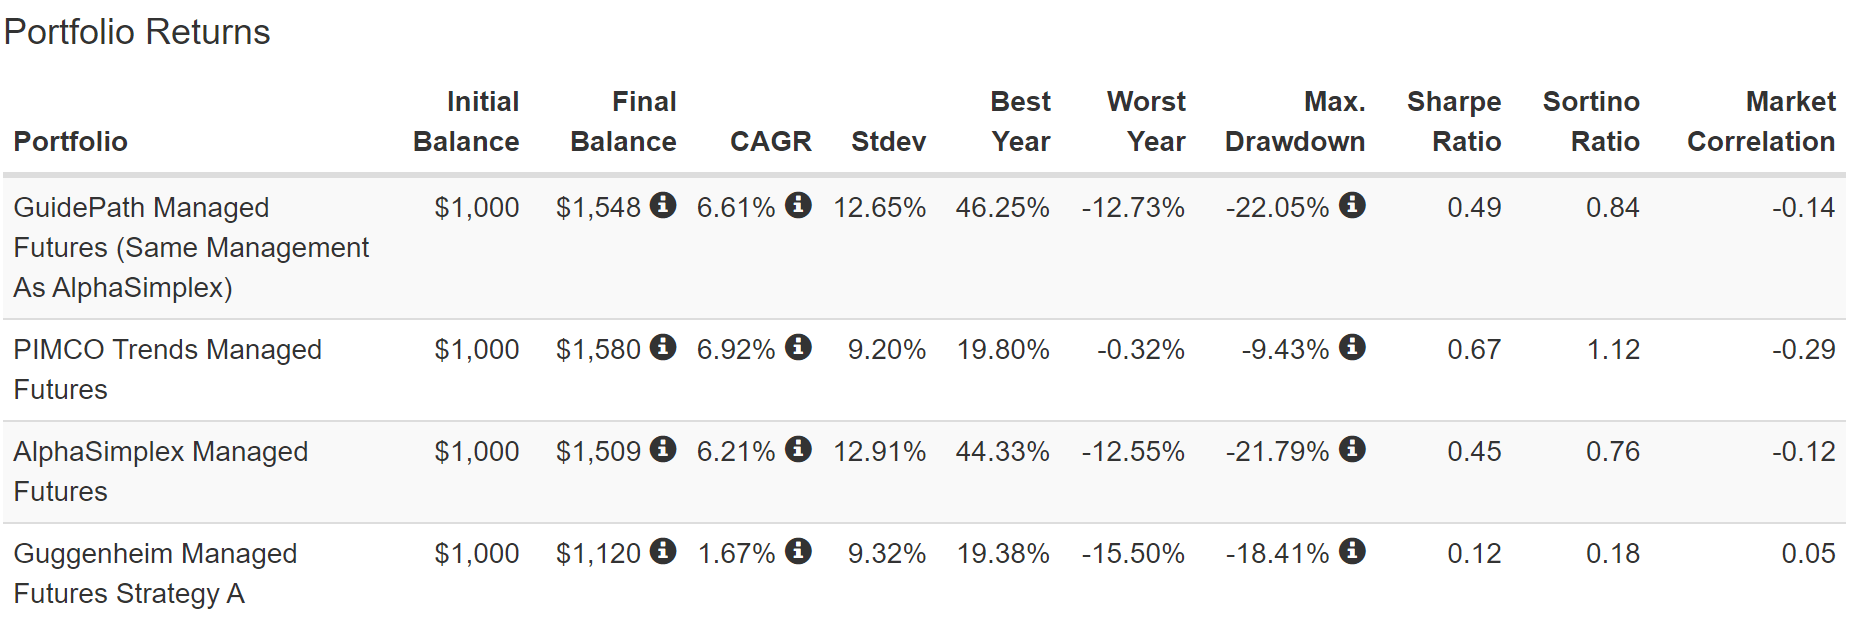
Managed Futures Since January 2014
(Source: Portfolio Visualizer)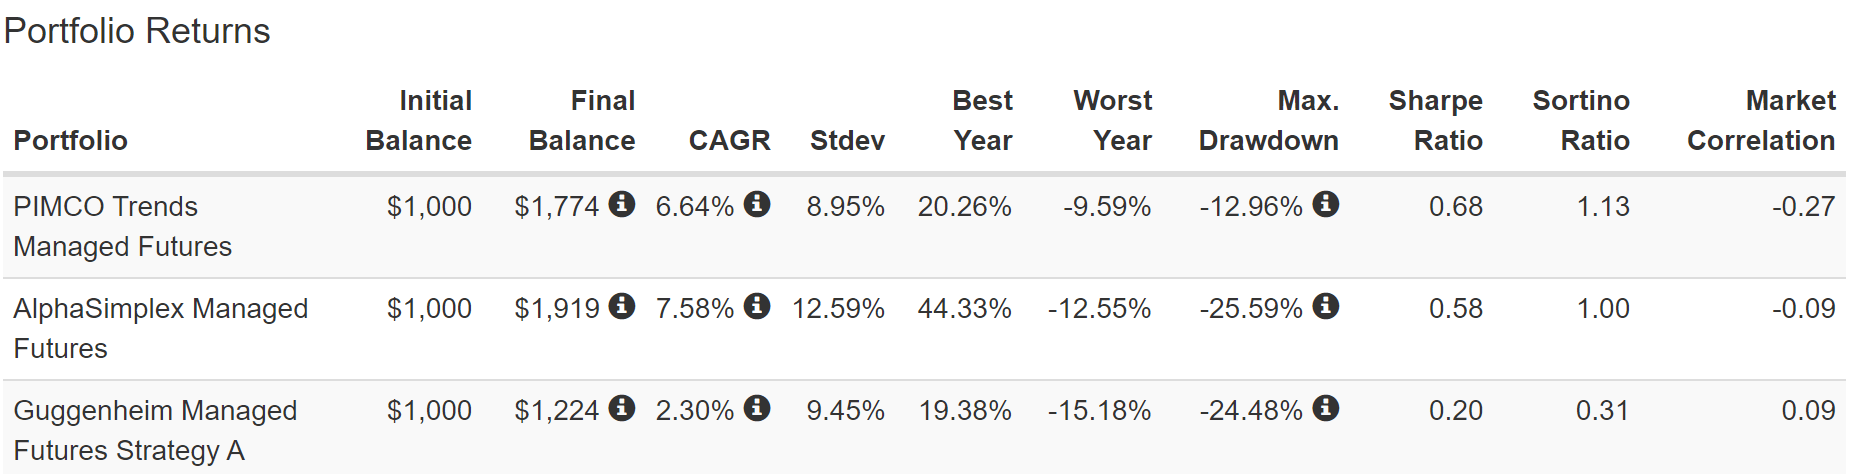
Managed Futures Since August 2010
(Source: Portfolio Visualizer)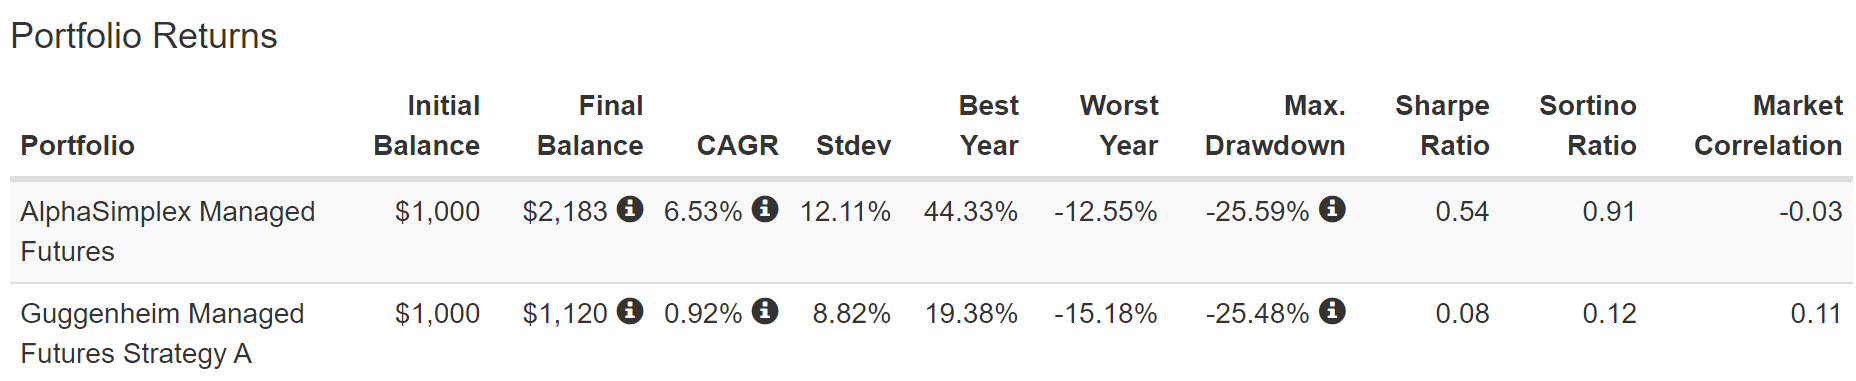
RYMT’s historical returns since 2007 are about 1% per year and -1% CAGR adjusted for inflation.
- GIFMX, PQTAX, and AMFAX historical returns 6.5% = 4.5% adjusted for inflation vs 2% long bonds
- DBMF historical return is 5% higher than its peers, 9% to 10% potential long-term return = 7% to 8% CAGR inflation adjusted return
- DBMF can potentially 4X long-term real bond returns
- and conservatively at least 2X them.
The future doesn’t repeat, but it often rhymes. – Mark Twain
Remember, “past performance is no guarantee of future results.”
But studies show that blue chips with relatively stable fundamentals offer predictable returns based on yield, growth, and valuation mean reversion over time.
Bank of America 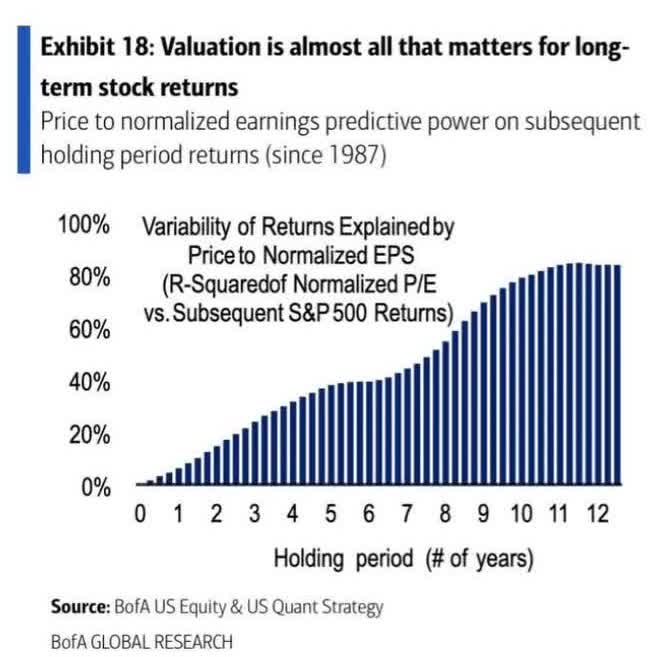
16 years is a time frame in which 91% of total returns are due to fundamentals, not luck.
(Source: Portfolio Visualizer Premium)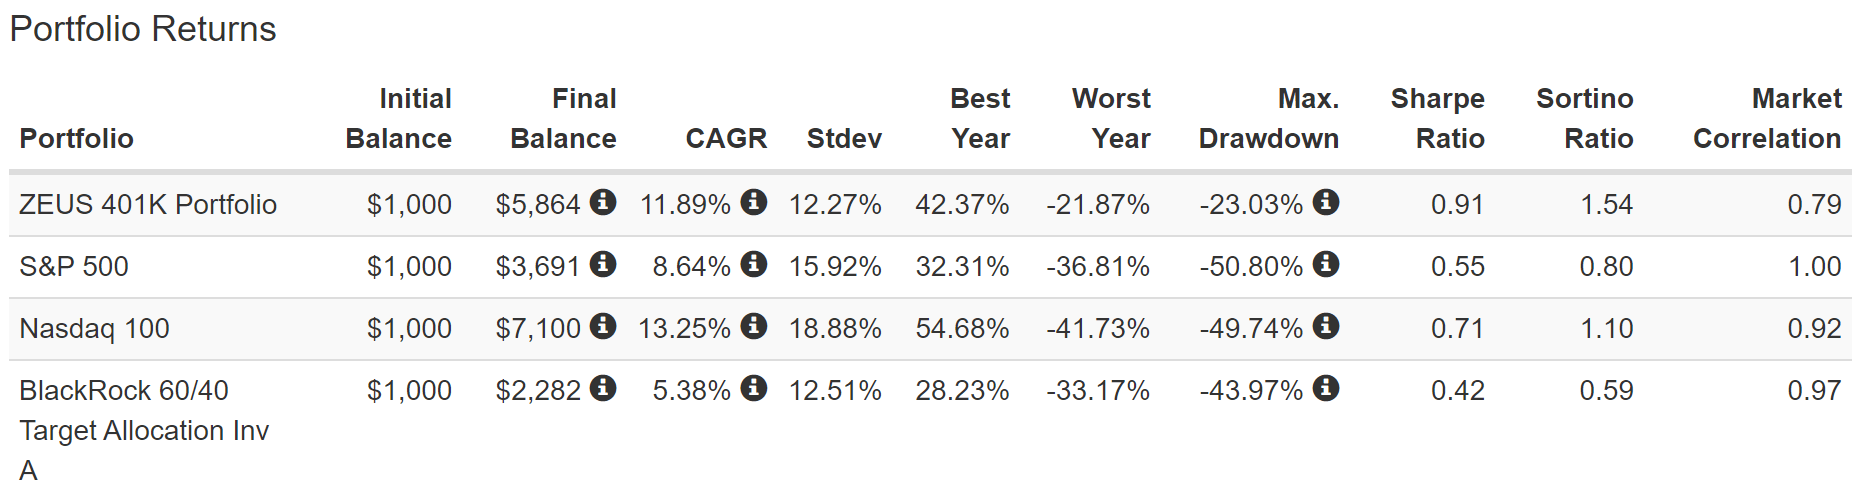
Even with 33% of the portfolio invested in one of the worst managed futures funds, which has delivered virtually no returns for a decade (but has been a wonderful hedging tool) ZEUS managed to deliver far better returns than the S&P 500 and almost match the Nasdaq in one of the hottest tech bull markets in history.
But with 12% annual volatility, 33% less than the S&P 500 and 50% less than the Nasdaq.
Returns were more than 2X that of a 60/40, just as analysts expect in the future. And with equal annual volatility and a peak decline just half as large.
Intra-day the S&P 500 hit -56% in the Great Recession while ZEUS bottomed at -23%.
The Sortino ratio, negative-volatility-adjusted total returns, were 50% higher than the Nasdaq and almost 3X better than the 60/40 and 2X better than the S&P 500.
(Source: Portfolio Visualizer Premium)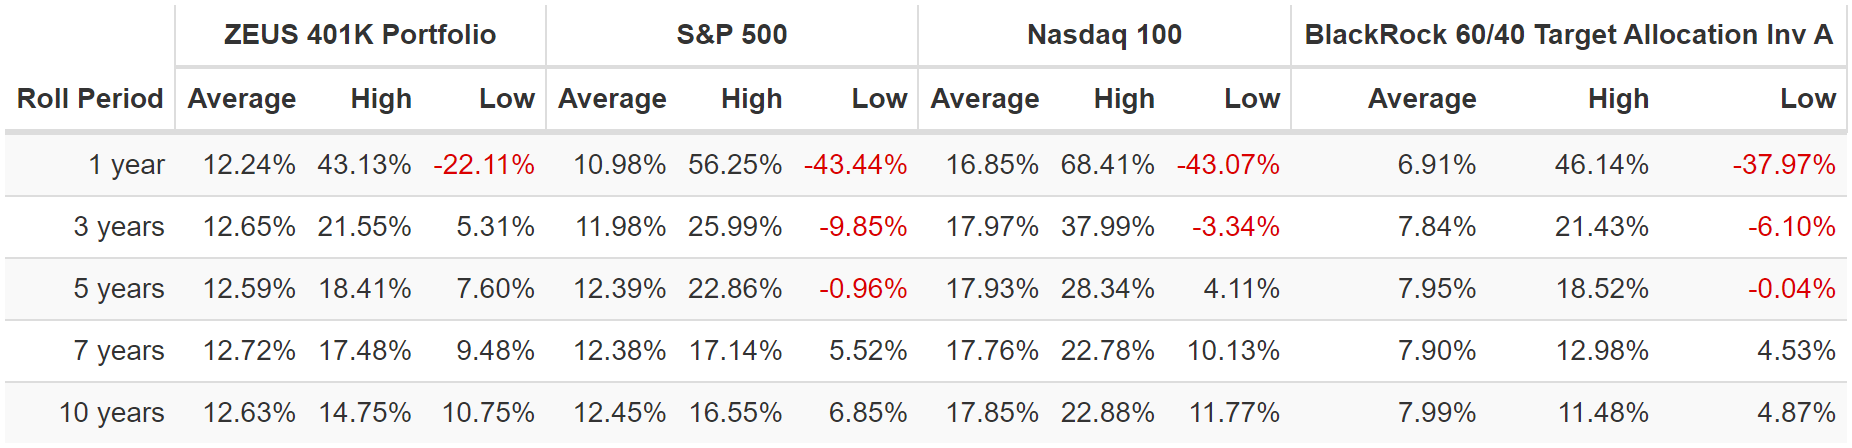
Consistently better returns than the S&P and 60/40 and that’s with the worst managed futures fund.
- AMFAX, PQTAX, and GIFMX have delivered 6% better returns = 2% higher weighted return = 14% rolling returns
- DBMF has delivered 9% better returns = 3% higher weighted return = 16% CAGR
Returns on par with the greatest investors in history…and a 60% smaller decline in the Great Recession…and a 5% yield!
- a retirement dream portfolio
(Source: Portfolio Visualizer Premium)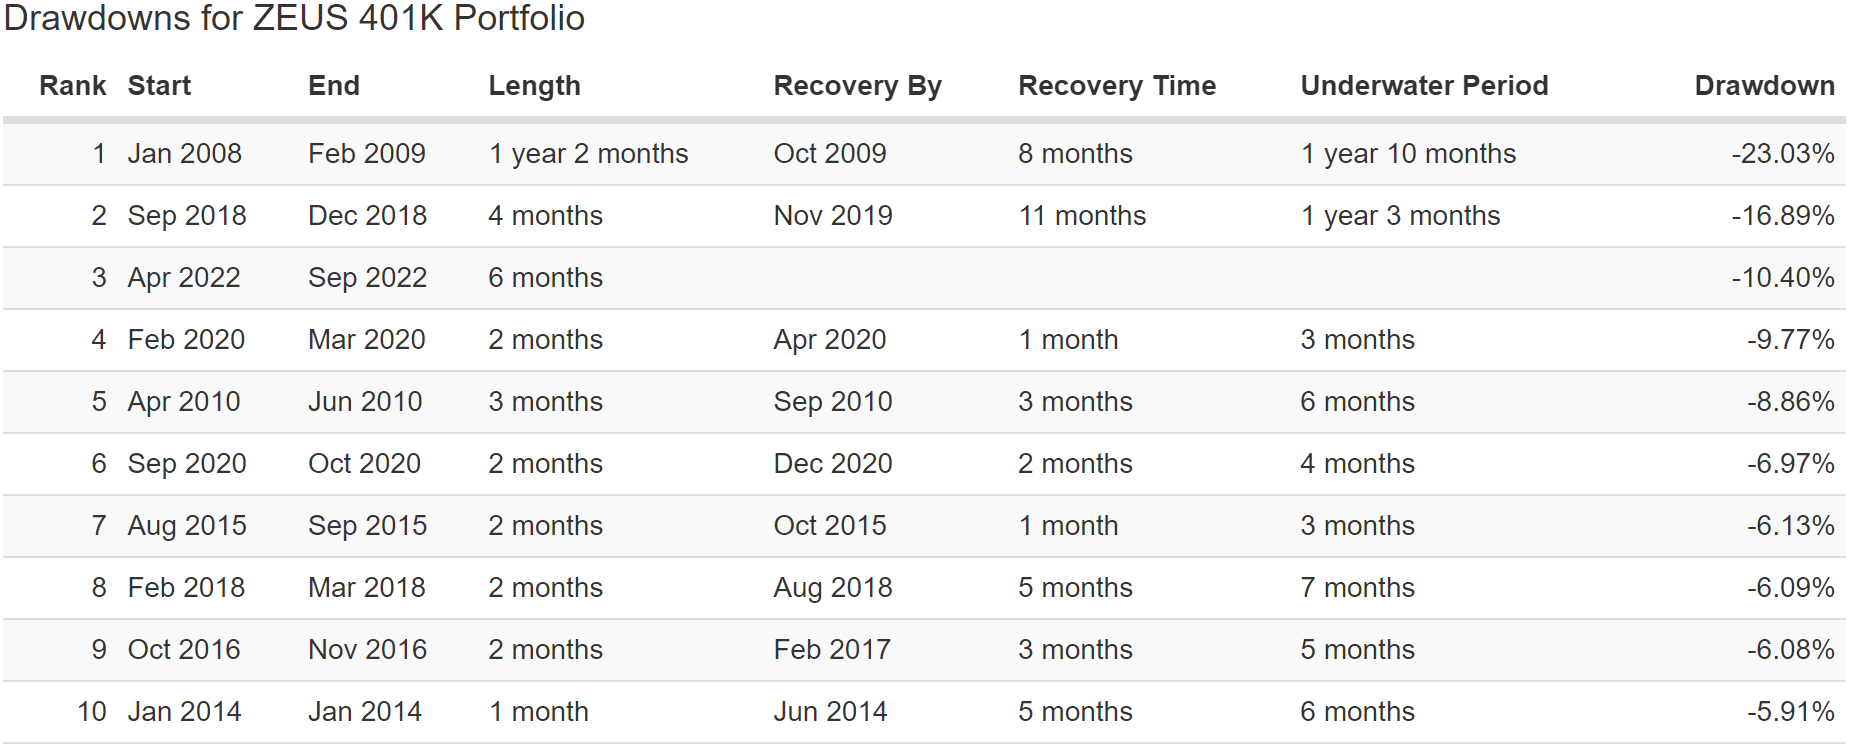
A 10% peak decline in 2022’s bear market:
- Nasdaq -35%S&P -28%
- 60/40 -21%
Just one bear market in 16 years, and it took the 2nd largest market crash in U.S. history to knock ZEUS down 23%.
ZEUS 401(k) In The 2022 Bear Market
DBMF, Not RYMTX ((Source: Portfolio Visualizer Premium))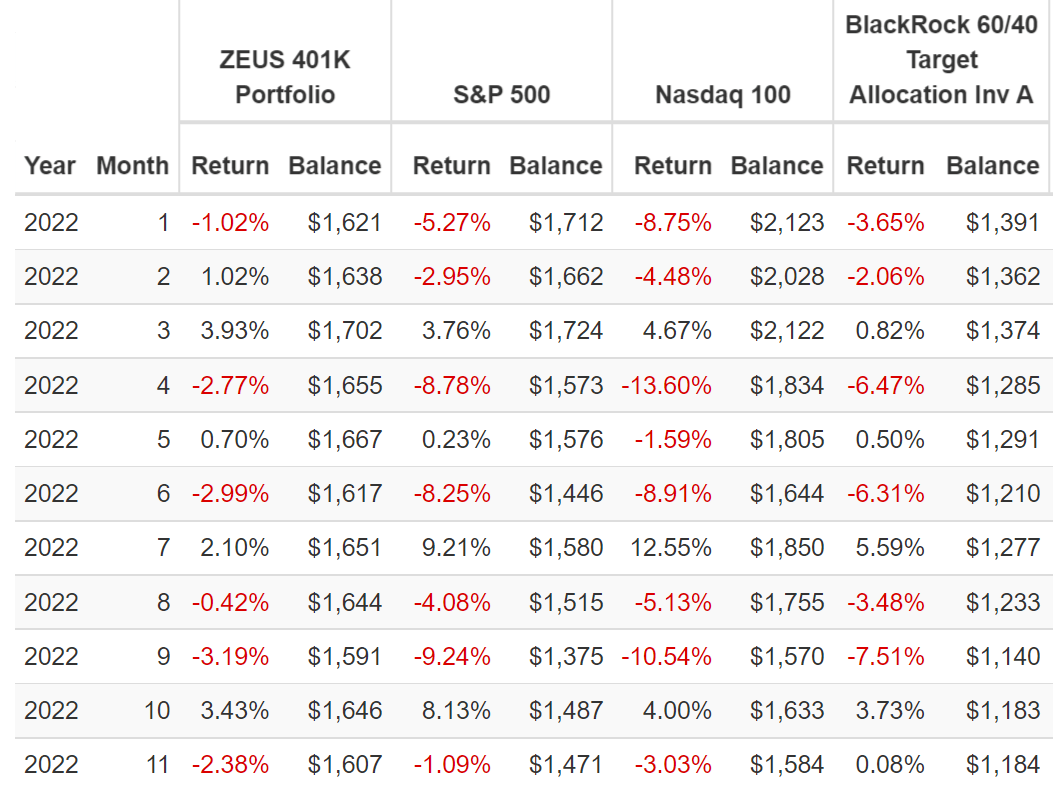
In this bear market ZEUS has been a champion, falling 3% in September when the market fell 9% and the 60/40 8%.
It also fell 3% in April and June, when the market fell 8%.
When the Nasdaq crashed 14% in April, ZEUS fell 3%.
ZEUS 401(k) In The Pandemic
(Source: Portfolio Visualizer Premium)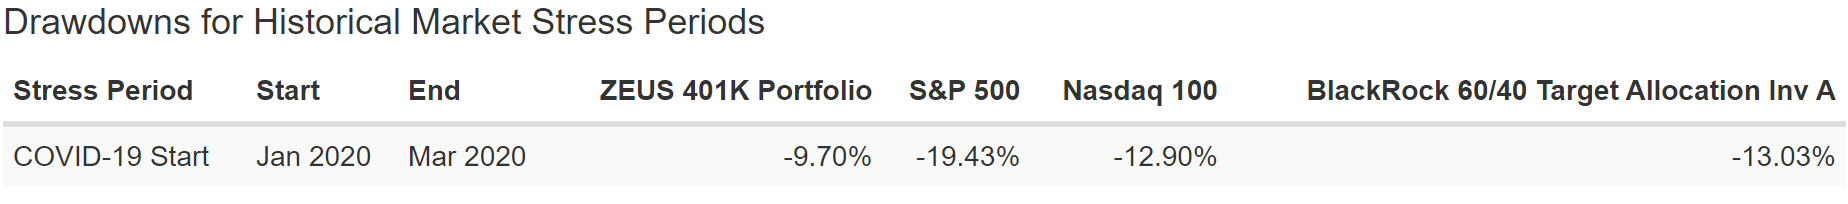
Not even a correction in the Pandemic crash, and down 30% less than a 60/40 and half the S&P 500.
ZEUS 401(k) In The 2018 Bear Market
(Source: Portfolio Visualizer Premium)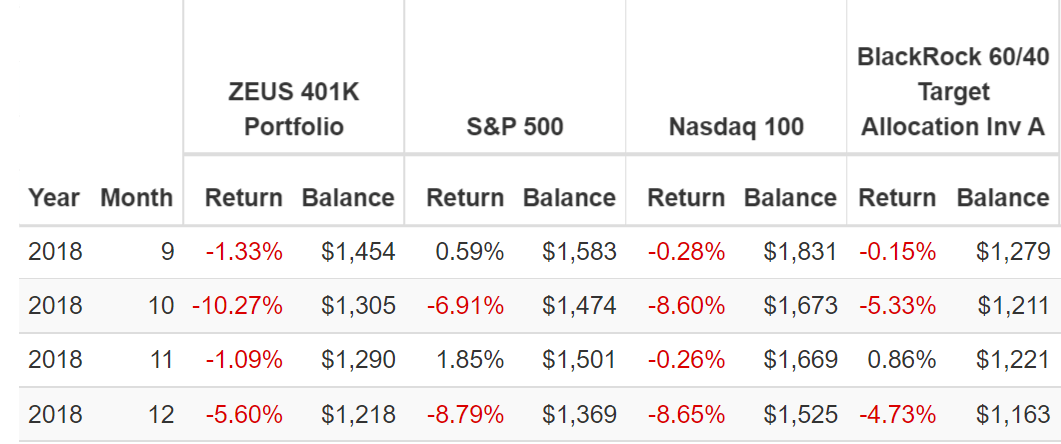
In the 2018 bear market the S&P hit -21% intra-day on December 24th. That included a 9% decline in December.
Managed futures were in a bear market in 2018 (the worst in a decade) and they basically failed.
But even when 33% of the portfolio failed to hedge, ZEUS 401(k) fell 16% while the market fell 21% and the 60/40 fell 14%.
- even when it fails ZEUS still does its job and falls less than the market
ZEUS 401(k) In The 2011 Bear Market
AMFAX instead of RYMTX ((Source: Portfolio Visualizer Premium))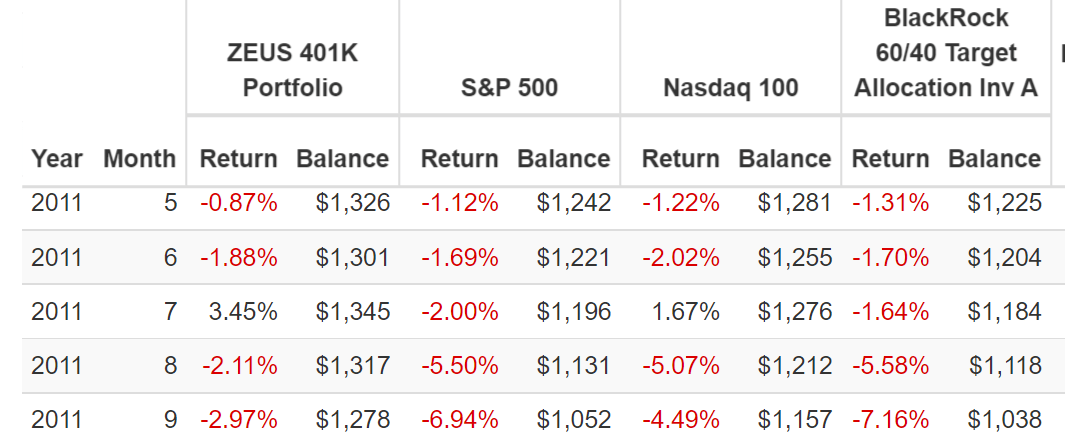
2011, the S&P hits -22% intraday and the 60/40 falls 16%. ZEUS falls just 4%, 75% less than a 60/40 and 82% less than the S&P 500.
ZEUS 401(k) In The Great Recession
(Source: Portfolio Visualizer Premium)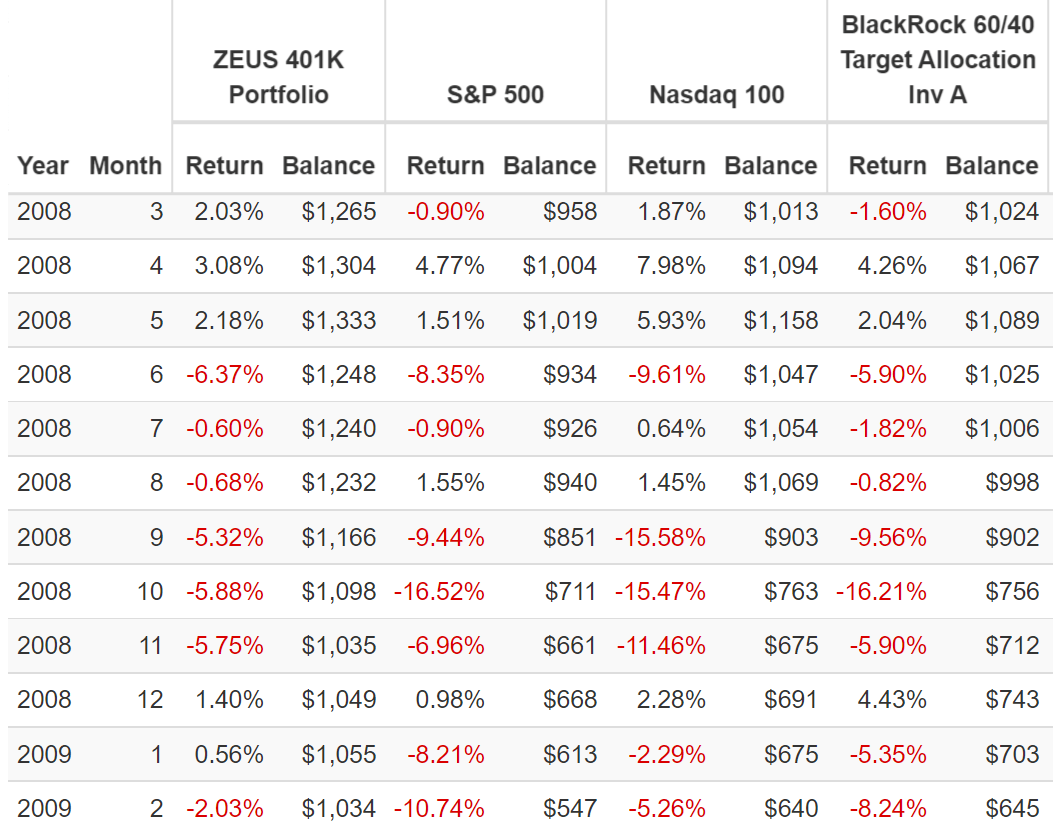
Great Recession, the 2nd largest market crash in U.S. history, with a 56% peak intraday decline in the S&P 500.
60/40 falls a peak of 44% and the Nasdaq 50%.
ZEUS fell a peak of just 23% and when the market fell 17% in October 2008 and a 60/40 16%, ZEUS fell just 6%.
- 66% smaller decline in the worst month for stocks since 1987.
When the market fell 11% in February, at the end of the crash a 60/40 fell 8% and ZEUS? Just 2%.
- ZEUS = riding over even the biggest market potholes in a Rolls Royce.
OK, so the assets are amazing, the portfolio fundamentals are wonderful and 16 years of historical returns are astonishingly great.
But what about the future?
75-Year Monte Carlo: Stress Testing The Future
Every registered investment advisor, including Ritholtz Wealth Management, uses some version of Monte Carlo simulations when doing retirement planning.” – Ben Carlson
- long-term Monte Carlo simulation use statistics and past historical returns and volatility data to run thousands of simulations about what’s likely to happen in the future
- as long as the future isn’t more extreme than the last 15 years, this is the best way to estimate the probability of likely return ranges, volatility, and the probability of achieving your investment goals.
The last 15 years have seen:
- the 2 worst Recessions since the Great Depression
- the 2nd worst market crash in history
- the fastest bear market in history
- the strongest 12 month rally-month history (100%)
- inflation ranging from -3% to 9%
- 10-year treasury bond yields ranging from 0.5% to 5%
- Fed funds rate from 0% to 4.25%.
Unless you think the future will be more extreme than this, 5,000 75-year Monte Carlo simulation is statistically the best way to forecast the likely future.
- a 75-year time horizon provides more extreme ranges of potential outcomes
- the ultimate stress test for a “forever portfolio.”
(Source: Portfolio Visualizer Premium)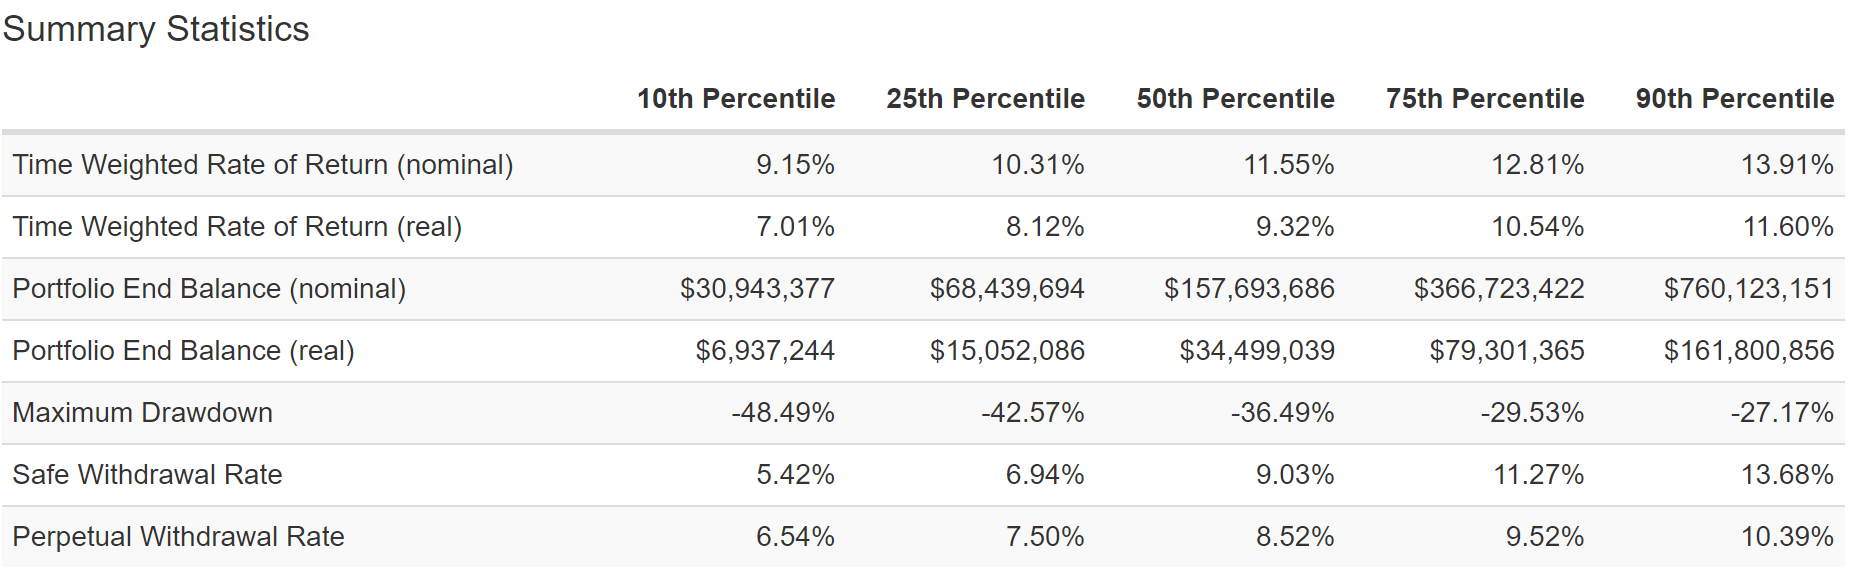
- 90% statistical probability of 7+% inflation-adjusted returns
- base-case 9.3% (analyst consensus 10.9% CAGR)
- 80% probability of a 27% to 48% bear market.
(Source: Portfolio Visualizer Premium)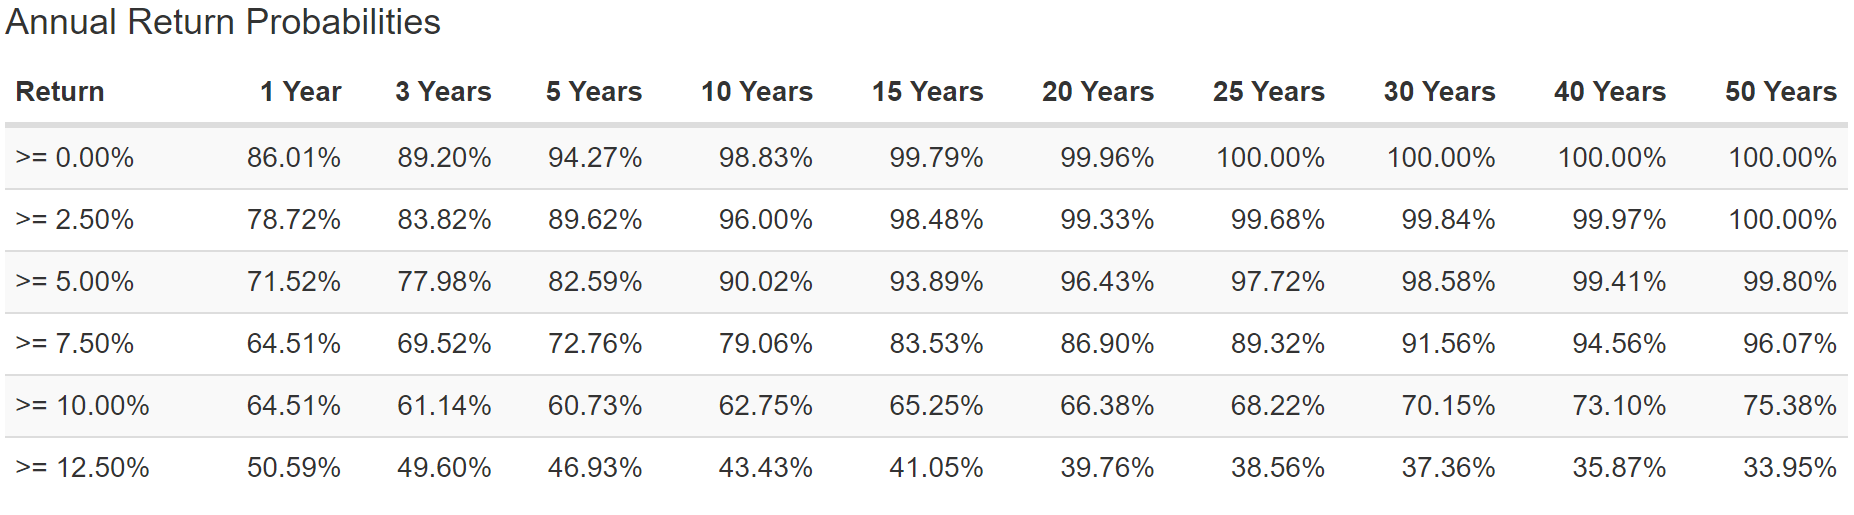
60/40’s historical return is 7.4% and that’s what analysts expect in the future.
S&P’s historical return is 10% and that’s what analysts expect in the future.
ZEUS 401(k) has a conservative 96.07% probability (2% to 3% higher returns expected from using DBMF instead of RYMTX) of beating the 60/40 over the next 50 years.
It has a 75.38% chance of matching or beating the market over the next 50 years.
(Source: Portfolio Visualizer Premium)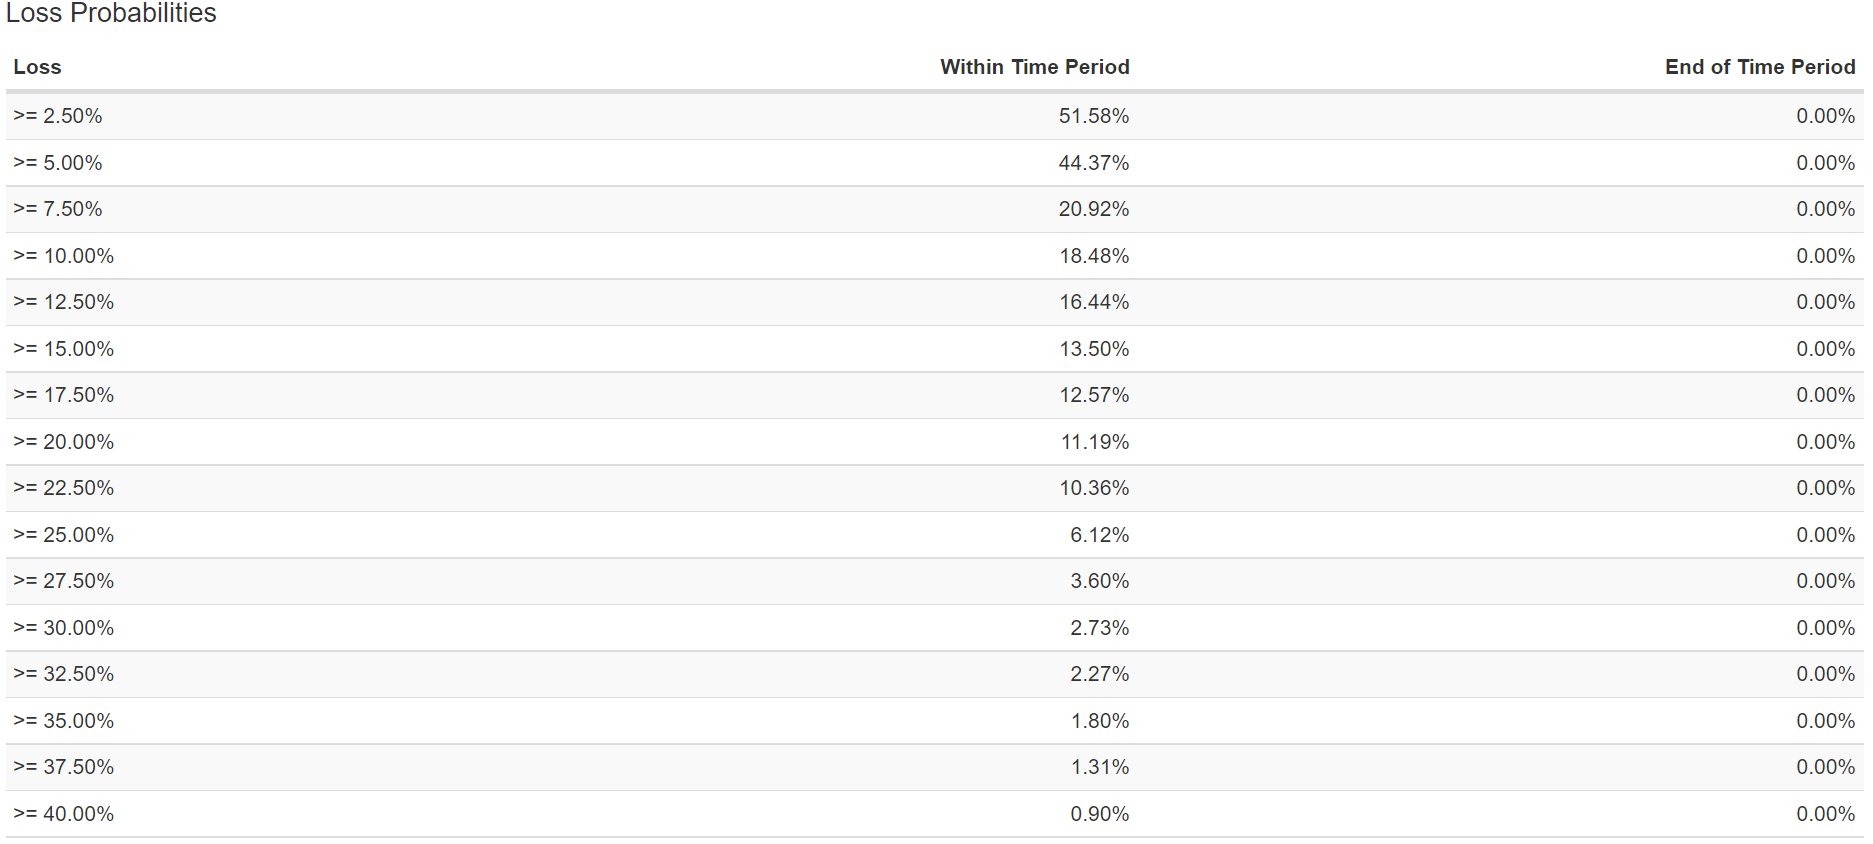
The probability of a 20+% bear market over the next 75 years? 11.19% = 1 in 9.
The probability of a 25+% bear market over the next 75 years is 6.12% or 1 in 16.
The probability of a 30+% bear market over the next 75 years is 2.73% or 1 in 37.
The probability of a 35+% bear market over the next 75 years is 1.8% or 1 in 56.
The probability of a 40+% bear market over the next 75 years is 0.9% or 1 in 111.
This is what I call sleeping well at night while 200 of the world’s best companies make me rich.
- so I can donate to my favorite charities.
Bottom Line: The World’s Best Blue-Chips Can Help You Build A Dream Retirement Portfolio
401(k)s are amazing, offering you a nice tax break for saving for your future.
And there are no better times to take advantage of maxing out your 401(k) than during a recessionary bear market.
Is the economy going to suffer? For a few months yes.
Daily Shot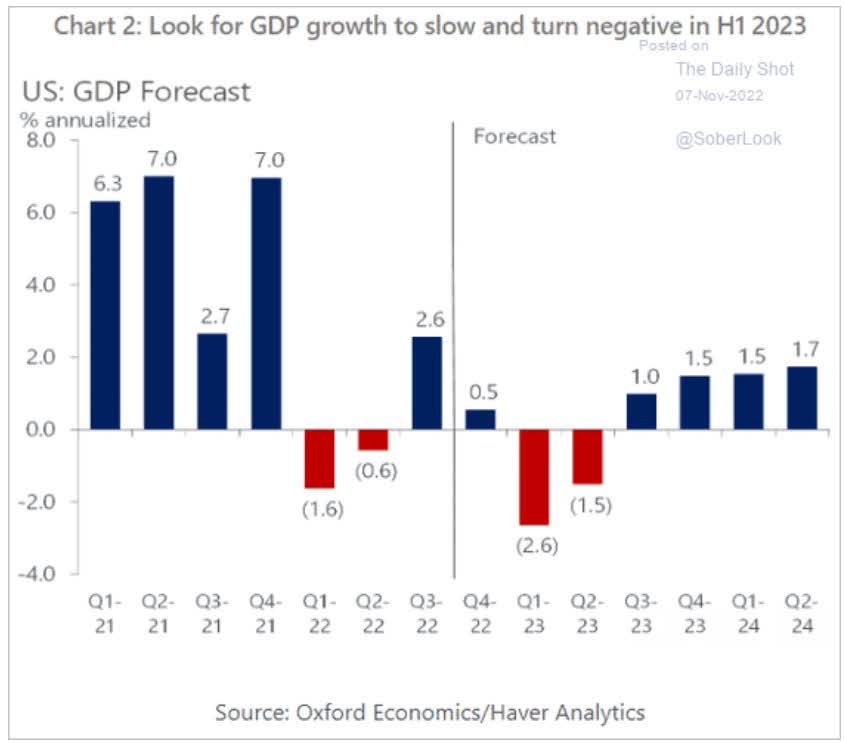
JPMorgan thinks the recession will begin in Q3 and last four quarters. They expect a historically average recession with 12 month GDP falling about 1.4% and peak unemployment of 6%.
BAC thinks the recession will last from Q1 to Q3, and US GDP falls 0.3% in 2023 (the mildest recession in history).
Deutsche Bank thinks the recession begins in Q3 and lasts two quarters, with 2023 GDP declining 0.5% (2nd mildest recession in history).
Moody’s and Morgan Stanley don’t expect a recession at all, just very low growth of 0.7% next year.
Will a weak economy hurt 2023 earnings? Almost certainty.
Might they hurt 2024 earnings? If the recession lasts long enough, sure.
But will world-beater blue-chips like AMZN, BTI, and 200 companies in QQQ and SCHD see their long-term growth rates permanently harmed? Almost certainly not.
Will anyone buying the world’s best companies at a 25% margin of safety like I’m doing in my 401(k) regret it in 5 years? 10 years? 20 years? 30 years?
Ben Carlson 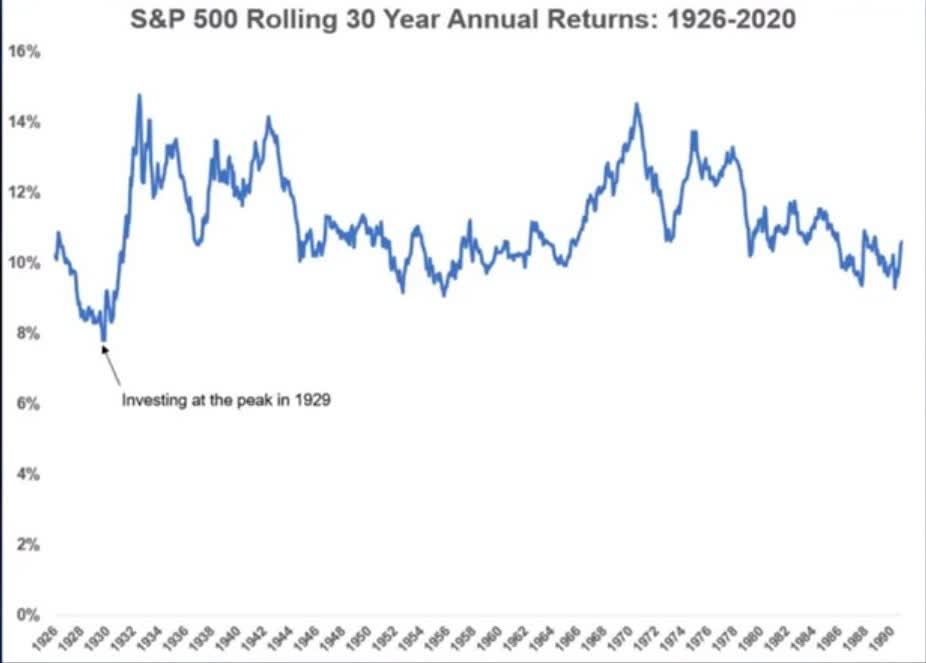
The lowest 30 year rolling return since 1926, including the Great Depression and stagflation hell of the 70s (when the Dow was flat for 16 years not counting dividends) was 8% per year.
What about the election? Does that matter?
Bloomberg 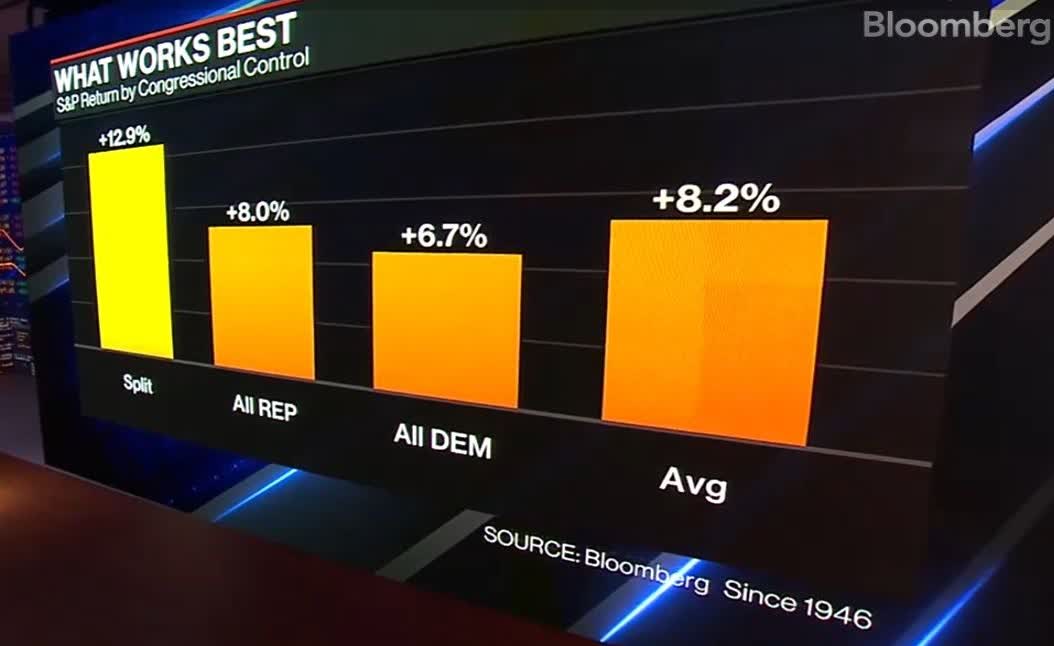
According to Bloomberg, since 1946 stocks have averaged:
- 8.2% annual returns
- 6.7% returns when Democrats controlled all branches of government
- 8.0% when Republicans had full control
- 12.9% when we had divided government.
But in a recession gridlock could mean less fiscal stimulus. Doesn’t that mean a worse recession? Maybe, but then again if the government were spending a lot to stimulate the economy what do you think an inflation-obsessed Fed would be doing?
- likely hiking rates even higher
- UBS thinks the Fed might be forced to hike above 6% if Congress were to pass another big stimulus bill.
So should we be worried about 2023’s recession? Not if you’re a long-term investor.
Should we be worried about the election? Not at all, divided government is the most bullish kind of government for stocks.
Should we be worried about stocks falling in the next few months? Why? Do you need the money in the next few months?
- any money you need in the next 3 years should be in an FDIC insured savings account or CD.
DollarSavingsDirect Has The Best Reviews (Depositaccounts.com)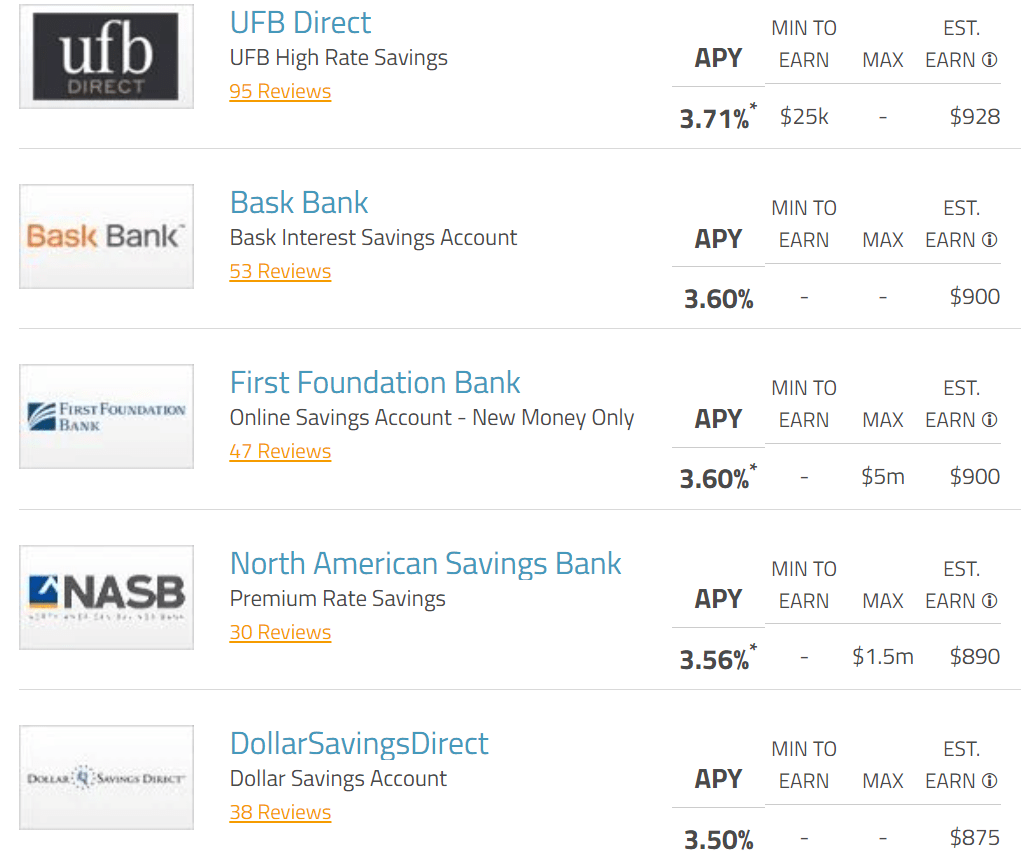
So why should I or any long-term investor worry about the next few months, or even 2023 or 2024?
In the short term, stock prices are a crap-shoot. In the long term, they are fundamentals-driven destiny.
And just take a look at my ZEUS 401(k)’s fundamentals.
- 5.0% safe yield
- 8.2% CAGR growth consensus
- 13.2% CAGR long-term return potential (better than the Nasdaq)
- historical returns of 12% to 13% CAGR for the last 16 years (using the worst managed futures fund, 2% to 3% higher with DBMF or other 4 or 5 star rated funds)
- 75% likely to beat the S&P 500 over the next 50 years
- 96% likely to beat a 60/40 over the next 50 years
- less than 1% chance of falling 40+% in the next 75 years
- 11% chance of falling 20+% in the next 75 years
- 23% peak decline in the Great Recession Vs. 56% S&P and 44% 60/40
- 33% to 66% smaller peak declines than the S&P through five bear markets.
And while I don’t care about volatility at all in my 401(k), having managed futures serving as a hedge that can be sold during annual rebalancing is a wonderful way to take advantage of this and all future bear markets.
Every bear market is caused by different things. But the goal of all smart long-term investors is to build a “Forever” portfolio that you can trust in ALL economic and market conditions.
- what’s the Fed doing in 10 years? 20 year? It doesn’t matter.
- what are geopolitics doing? It won’t matter.
- who is in control of the government? It won’t matter.
This is why I’m investing 100% of my 401(k) into SCHD, QQQM, DBMF, AMZN, and BTI.
Because when you have the world’s best 200 blue chips working hard for you, one day you won’t have to. 😉
Be the first to comment