

naphtalina/iStock via Getty Images
This article was co-produced with Hoya Capital Real Estate
Introduction
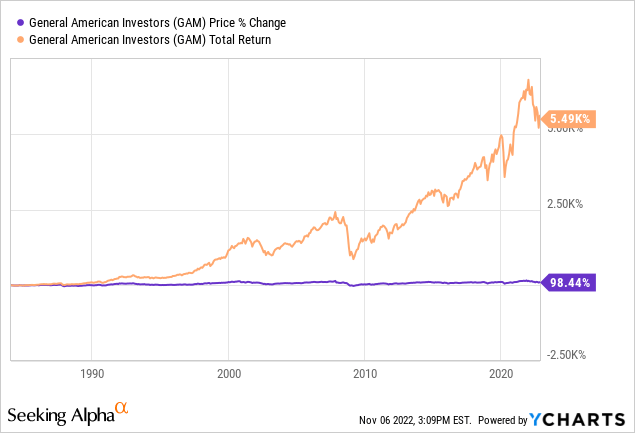
Since I recently covered two other CEFs that predate the 1929 stock market crash, covering the General American Investors (NYSE:GAM) CEF just made sense. Links to recent articles on three other long-dated CEFs can be found at the end of this article. Data will show how a star performer can lose its “mojo” and become just one of the pack. Based on 10-year results, GAM is now behind the others, with the Central Securities (CET) on top. My thought is sell GAM and invest in one of the others, especially as you can capture a tax loss.
General American Investors Company review
Seeking Alpha describes this CEF as:
General American Investors Company, Inc. is a publicly owned investment manager. To achieve long-term capital appreciation, with lesser emphasis placed on current income, GAM invests principally in common stocks believed by its management to have better than average growth potential. Normally, a substantially fully invested position in equities is maintained. Benchmark: S&P 500 TR USD. This CEF started in 1927.
Source: seekingalpha.com GAM
GAM has just over $1b in AUM, with the managers charging 124bps in fees. Like its fellow long-term CEFs, the yield varies widely and is heavily depended on the year-end payment, which most times is funded by LTCGs.
Portfolio strategy overview
The primary investment objective of the Company is long-term capital appreciation with lesser emphasis on current income. We focus on equity securities with growth potential at reasonable valuations. More specifically, we seek investments worldwide in leading public and private companies with significant long-term opportunities, defensible competitive advantages, prudent and profitable business models, and committed first-class management teams with the vision and energy to succeed.
Source: generalamericaninvestors.com
GAM has one portfolio manager and four security analysts, three with CFAs, supporting him. Some important points they list in executing their strategy include:
- General American Investors Company’s portfolio is constructed using a “bottom up” approach.
- Our security analysts utilize numerous sources, including publications and reports, conferences and meetings, and industry trade group activities, to identify the securities of companies with strong long-term growth potential.
- When a recommendation is made, the portfolio manager reviews the rationale provided by the related analyst, often with the assistance and input from other members of the research staff.
- We believe that adequate diversification can be achieved with a limited number of holdings (50 to 70) in diverse industries. Individual security weightings depend upon our assessment of the company’s potential for growth as well as the market liquidity of the security.
Holdings review
generalamericaninvestors.com sectors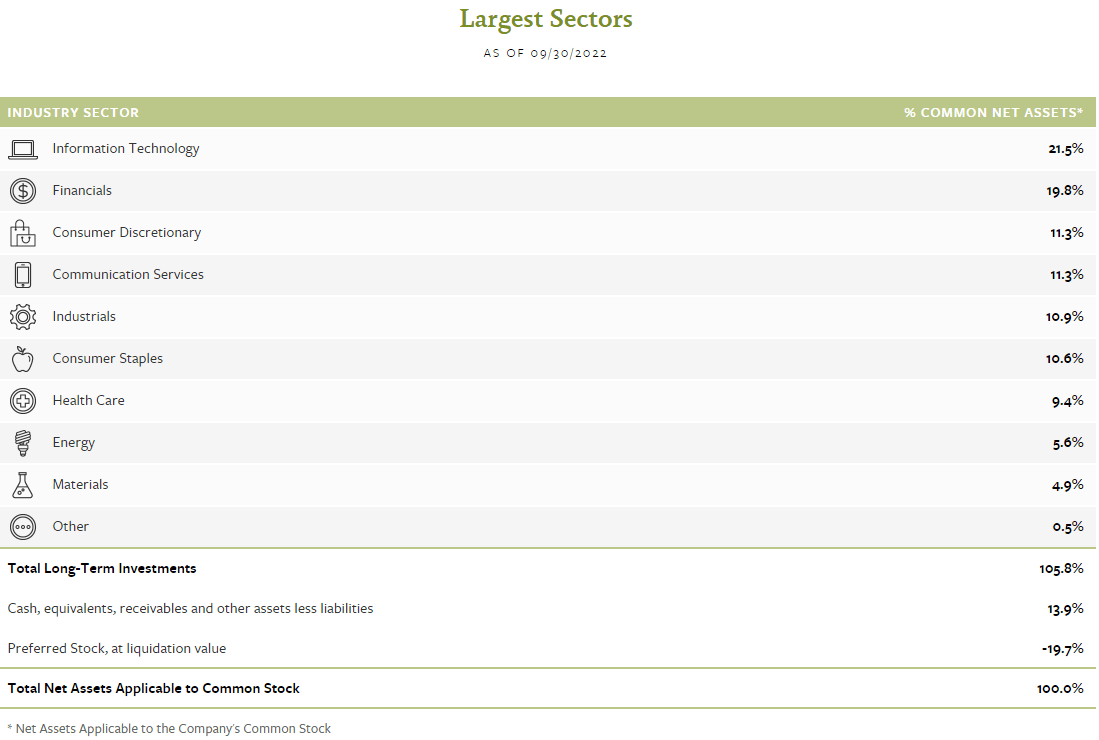
When one compares these sector weights against the benchmark, one sees that GAM invests independent of the benchmark weights. The Top 10 were the only holdings posted on the CEF’s website.
| Company and description | Weight |
| Republic Services, Inc. Republic Services is a provider of non-hazardous, solid waste collection and disposal services in the U.S. The efficient operation of its routes and facilities combined with appropriate pricing enables Republic Services to generate significant free cash flow. | 7.40% |
| Microsoft Corporation Microsoft is a global provider of software, services, and hardware devices. The company produces the Windows operating system, Office productivity suite, Azure public cloud service, and Xbox gaming console. | 5.70% |
| Alphabet Inc. – Class C Alphabet is a global technology firm with a dominant market share in internet search, online advertising, desktop and mobile operating systems, as well as a growing share of cloud computing platforms. Alphabet has a wide competitive moat, a strong business franchise, and potential growth catalysts. | 5.10% |
| Apple Inc. Apple designs, manufactures and markets smartphones, personal computers, tablets, wearables and accessories, and sells a variety of related services. The company’s growth prospects look favorable as the shift to mobile computing expands globally and as more products and services are added to the Apple ecosystem. | 4.80% |
| Berkshire Hathaway Inc. – Class A Berkshire Hathaway is a holding company owning many subsidiaries mainly in the insurance, railroad, utility/energy, aerospace, manufacturing, retail, and finance industries. The company also holds various common stock investments. Berkshire is positioned to provide long term, relatively defensive returns due to its conservative balance sheet. | 4.60% |
| Arch Capital Group Ltd. Arch Capital generates premiums of approximately $12 billion and has a high quality A+ rated balance sheet. The company’s management team exercises prudent underwriting discipline, expense control, and capital management yielding above average shareholder returns. | 4.40% |
| Nestlé S.A. Nestlé is a global food company with a favorably-positioned product portfolio and a strong balance sheet. Market share, volume growth, pricing power, expense control, and capital management offer durable total return potential. | 3.60% |
| T-Mobile US, Inc. T-Mobile is one of the largest wireless communications providers in the United States offering voice, data, and fixed broadband internet connectivity. T-Mobile’s customer value proposition, network quality, and operational discipline position the company to generate free cash flow and allocate it in an efficient manner. | 3.60% |
| The TJX Companies, Inc. Through its T.J. Maxx and Marshalls divisions, TJX is the leading off-price retailer. The continued growth of these divisions in the U.S. and Europe, along with expansion of related U.S. and foreign off-price formats, provide ongoing growth opportunities. | 3.50% |
| Everest Re Group, Ltd. Everest Re is one of the largest independent U.S. property and casualty reinsurers, generates annual premiums of approximately $13 billion, has a high quality investment portfolio, and a well-reserved A+ balance sheet. This Bermuda domiciled company has a strong management team that exercises prudent underwriting discipline and efficient expense control, resulting in above-average earnings and book value growth. | 3.50% |
I did not recognize two names: Arch Capital Group (ACGL) and Everest Re Group (RE). The 3rd quarter report did list all holdings, which was about 60 stocks. The following table shows trades made over the prior quarter.
generalamericaninvestors.com 3Q report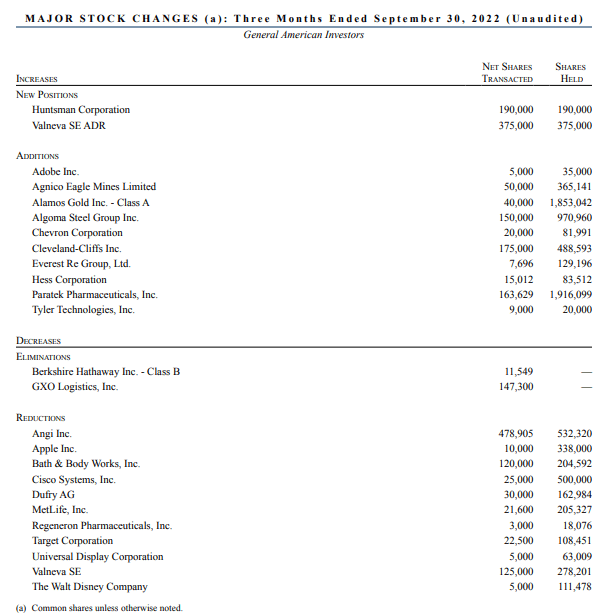
Distribution review
The Company’s dividend and distribution policy is to distribute to stockholders before year-end substantially all ordinary income estimated for the full year and capital gains realized during the ten-month period ended October 31 of that year. If any additional capital gains are realized and available or ordinary income is earned during the last two months of the year, a “spill-over” distribution of these amounts may be paid.
Source: GAM dividend distribution policy
seekingalpha.com GAM DVDs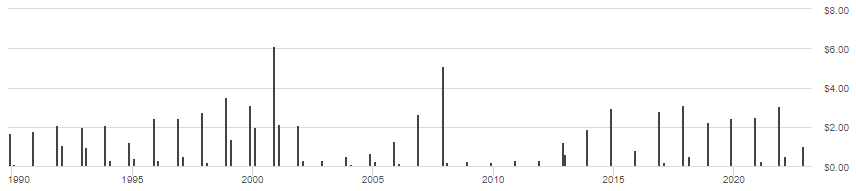
As the next chart shows, GAM’s annual distributions are very dependent on capital gains. About 21% of the portfolio is traded annually, which generates that income source.
generalamericaninvestors.com DVDs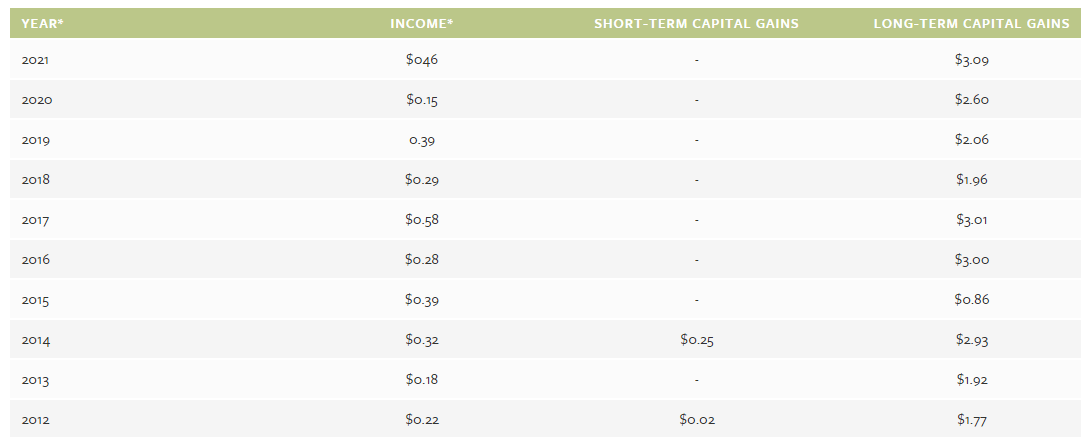
What investors do with those distributions is critical to the actual return earned. This data is from 1995 onward. Investors who re-invested beat the S&P 500 index, the others did not.
dividendchannel.com/drip-returns-calculator/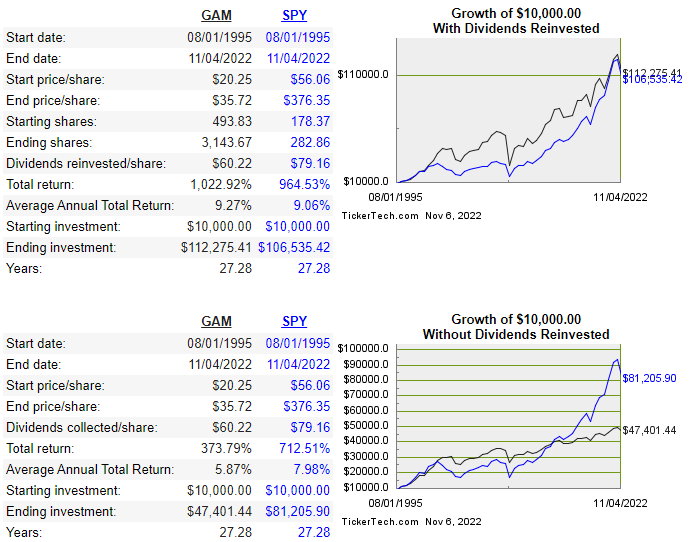
NAV and Premium/Discount review
As the next chart shows more clearly, GAM has a long history of selling at a discount, which currently stands at 16.5%.
CEFConnect.com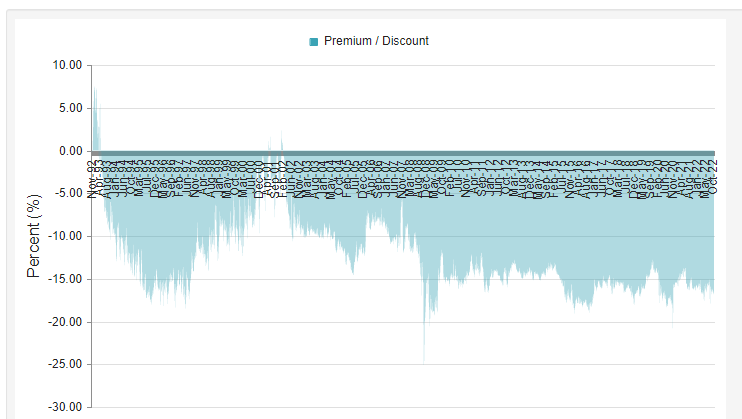
From 1992 onward, there were only two brief periods when GAM was at a premium. Today’s discount is “normal”, with a discount under 10% not occurring since 2007. The point being, this CEF is not one to buy with the hope of profiting from discount shrinkage.
Portfolio strategy
Like many investors, I am regularly reviewing funds, seeking ones that have a track record of outperforming the S&P 500 Index, which to many represents the US equity market, or at least the Large-Cap segment. Besides CET, the other two long-dated CEFs I compared results with are:
This how the four compare against each other and against the Vanguard 500 Index Fund Investor Shares (VFINX), which provides more history than the SPY ETF.
PortfolioVisualizer.com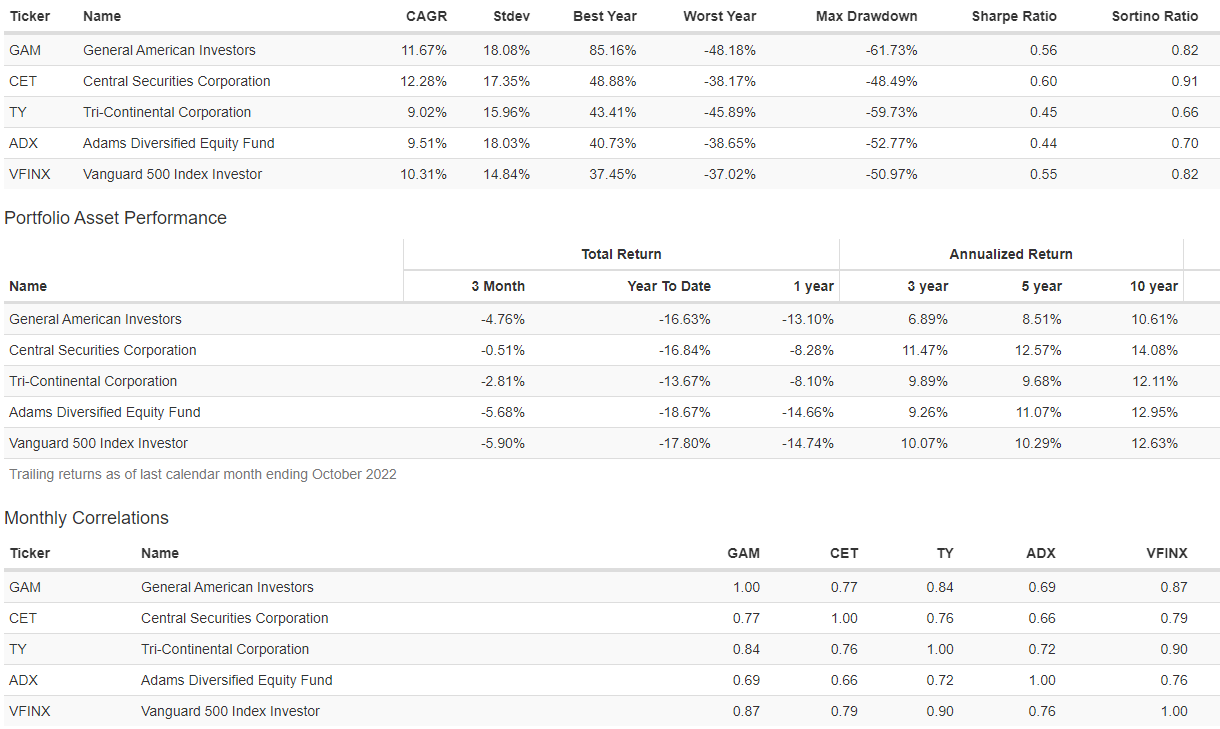
The above shows GAM ahead of the funds that invests based on the S&P 500 index since 1988 but results since have trailed off. Since 1988, GAM was second to CET in CAGR but over the past decade its CAGR trails all those listed. Looking at data for the past decade also shows GAM with the poorest results for drawdown, Sharpe and Sortino ratios. The five-year data shows the same results.
If holding GAM at a loss, consider capturing that loss and investing in one of the better performing CEFs mentioned. Others might want to consider a switch too, especially if held in a tax-sheltered account.
Other long-dated equity CEFs articles
There are at least three others that have long lives, one from the 1840s!
Be the first to comment