

Sakorn Sukkasemsakorn
Written by Nick Ackerman, co-produced by Stanford Chemist. This article was originally published to members of the CEF/ETF Income Laboratory on October 17th, 2022.
BlackRock Utilities, Infrastructure & Power Opportunities Trust (NYSE:BUI) is fairly unique from its other closed-end fund infrastructure/utility-focused peers. Instead of leveraging, the fund utilizes an options writing strategy on a portion of its portfolio. During raging bull markets, that can be detrimental as positions can be called away, limiting the upside.
However, in a year such as 2022, it can help provide some slight protection as the premiums collected can offset some of the losses. In the case of CEFs, it can be beneficial as an equity fund will often rely on capital gains to fund their distributions. With the options premium, this provides an avenue of providing gains no matter the market.
It hasn’t been enough for BUI to cover their distribution completely, but it certainly has helped. Despite a fairly significant portion of unrealized losses, they’ve also realized gains from elsewhere in their underlying portfolio.
Utilities were holding up relatively well, given their defensive nature. However, even utilities have succumbed to the latest September/October plunge in the market. Utilities were slightly positive just a couple of short months ago. Now they are down over 13% at the time of writing.
Since the last update, BUI has underperformed the S&P 500 for some context. Some of this underperformance was a widening discount since our previous update too.
BUI Performance Since Previous Update (Seeking Alpha)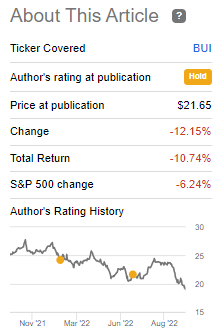
With interest rates set to go higher, that can be a headwind considering that utilities are viewed as an income play. With risk-free Treasuries yielding 4%+, that certainly can take some appeal away from holding common stocks of utilities.
This continues to be a risk for the overall market. As long as inflation numbers keep coming in hot – the expectation of the Fed being even more aggressive in raising rates only continues to grow. Until there is stabilization for interest rates (the almighty ‘pivot’), then I don’t think there can be stabilization in the market.
Hence, why an options writing fund could be more tempting than a leveraged fund. Personally, I don’t know where the rates will go or what the market will do. That’s why I spread my portfolio amongst many names, even within the same sector, to get diversified exposure to several strategies.
The Basics
- 1-Year Z-score: -1.18
- Discount: -3.01%
- Distribution Yield: 7.63%
- Expense Ratio: 1.08%
- Leverage: N/A
- Managed Assets: $436.763 million
- Structure: Perpetual
BUI’s investment objective is to “provide total return through a combination of current income, current gains and long-term capital appreciation.”
To achieve this objective, they have quite a bit of flexibility. They will invest “primarily in equity securities issued by companies that are engaged in the Utilities, Infrastructure, and Power Opportunities business segments anywhere in the world and by utilizing an option writing (selling) strategy in an effort to enhance current gains.”
The fund’s expense ratio is relatively low for a CEF. That’s generally the case with most of BlackRock’s (BLK) funds. A particular benefit when you are the largest asset manager in the world, you have more flexibility with charging less.
As mentioned, the fund isn’t leveraged. They are, instead, opting for a call writing strategy on single positions in its underlying portfolio. They have a general target of between 30 and 40% being overwritten. At this time, they are on the lower end with an overwritten percentage of 31.69%.
Performance – Discount Widening, But Still Not Screaming “Buy”
On a YTD basis, this fund has provided similar losses to other infrastructure funds. That is despite the fund’s utilization of options and no leverage. That being said, while they could be seen as peers, they do have different types of exposure that make them different too. These subtle differences seem to have been resulting in the results not being more favorable to BUI.
That’s why I would mention that the results of their options would have still been relatively better had they not written options, but we can clearly see that it has still resulted in similar performance as these other infrastructure-focused CEFs.
YCharts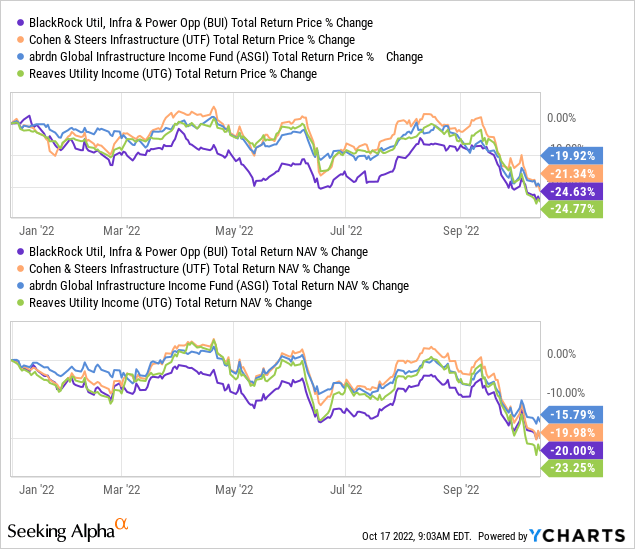
I’ve included Cohen & Steers Infrastructure (UTF) and abrdn Global Infrastructure Income Fund (ASGI). Both of these funds invest globally, so which is similar to BUI.
However, BUI favors more European exposure over what UTF has. UTF also invests in some bonds and preferred, which can make it a bit steadier too. They’ve also just been tremendously strong, seeming to pick the right names over the last several years. Finally, BUI has some China exposure, which the country’s leadership seems bent on destroying their economy with their zero COVID policy.
ASGI is also non-leveraged, but it doesn’t employ an options writing strategy. They also have a fair bit of weighting in Europe but tend to focus more on Spain and France, further away from the more volatile Eastern Europe area. Additionally, the largest offsetting factor for ASGI, which is an “infrastructure” fund, is the significant weighting to industrials. It is actually the largest weighting of the fund; then utilities are shown as the second largest.
BUI has outperformed UTG. However, UTG is even a bit different. They’ve been including more international holdings, where they had previously focused mostly on U.S.-based holdings. They’ve also had fairly significant weighting to REITs, but they’ve also reduced that more recently.
Still, REITs have been hit much harder than utilities, which could have played a role in the weakest performance of this group. That ended up being a sore part of their portfolio, where they had nearly 16% allocated earlier in the year. Additionally, their largest holding is a telecommunication services company, the worst-performing sector YTD at the time of writing.
Still, I would have expected BUI to put up better results given their strategy, so I can’t say that I’m really impressed. It does highlight why I invest across all four of these funds, though, as it provides varying exposure and slightly different results. Additionally, the option writing can still help BUI cover its distribution and provide a bit more predictability.
All this being said, the fund’s discount is widening out but not enough to get me overly confident either. The fund has tended to trade at a premium fairly regularly over the last five or so years. Before that, however, it was a much different story.
YCharts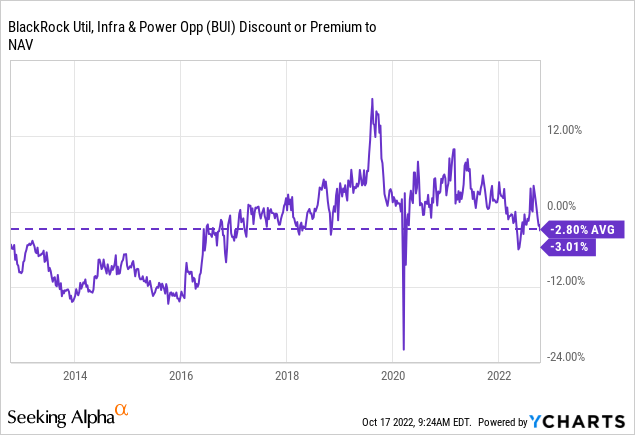
I don’t need to see the fund at a 10%+ discount, but if it were, I’d be a more aggressive buyer. For now, I remain rather neutral, but it seems like an interesting time to at least consider the fund for a long-term add.
Distribution – Coverage Short, But Helped With Options Premium
BUI has maintained the same or equivalent distribution since it was incepted. It initially started as a quarterly payer but then went to a monthly payout that was the equivalent. If you want to get really specific, it was a $0.0005 increase.
BUI Distribution History (CEFConnect)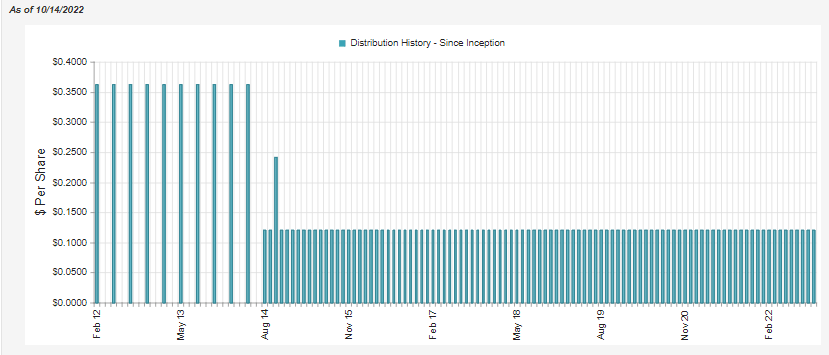
The current distribution yield works out to 7.63%. The NAV rate works out to 7.40%. This is now climbing above the average yield of the last decade.
YCharts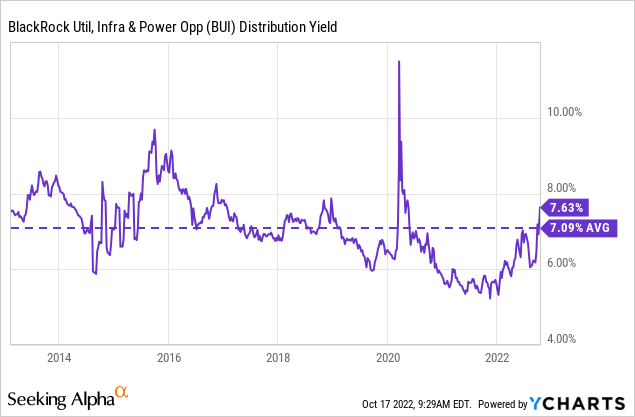
However, it still isn’t at the highest levels we’ve seen. I think that BUI’s distribution remains relatively safe, despite the losses we’ve seen this year. Net investment income or NII distribution coverage comes in at around 30%. The realized gains they could wrangle this year had easily covered any shortfall.
BUI Semi-Annual Report (BlackRock)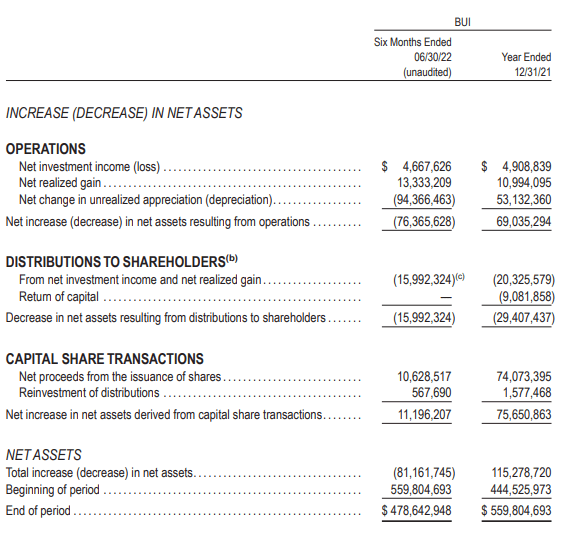
Of those realized gains, $4.135 million was generated via their written options. The fund collects those options premiums by writing calls on their underlying holdings.
BUI Realized And Unrealized Gains (BlackRock)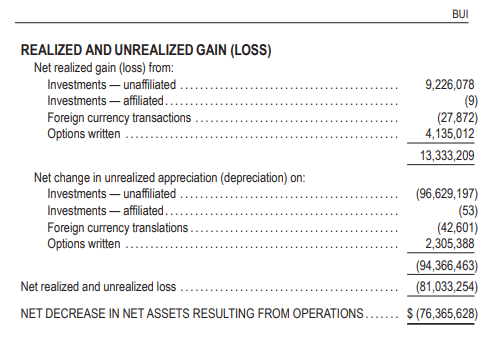
This was for the first six months of the year. That leaves the shortfall between NII + option premium at a meaningfully reduced amount relative to no options premium being generated. Of course, that’s assuming they can collect another $4.135 million through the year’s second half.
I’m willing to bet they can generate more if I had to take a wild guess. This is because utilities were holding up so well earlier this year. Now that they’ve succumbed to the same volatility of the broader market, option premiums can become elevated. That should translate into a higher option premium being generated.
The only way we’ll officially know is when they release their next annual report. Since that won’t be until early March, we have a lot of time for speculation based on history.
BUI’s Portfolio
This fund can be fairly active in its portfolio. The portfolio turnover rate latest came to 17%. That can be compared with the previous fiscal year of 20%. However, that was down from the 39% observed in both the 2019 and 2020 years.
Mostly, the sector weightings remained relatively stable from our update earlier this year.
BUI Sector Allocation (BlackRock)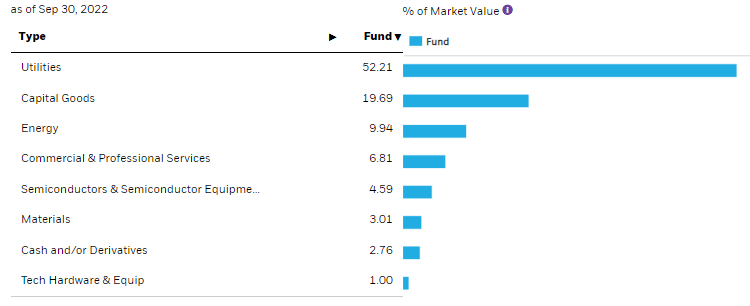
Utilities dominate the portfolio with a meaningful weighting to capital goods (industrials) and then a fairly meaningful allocation to some energy.
We also see the geographic allocations remain relatively similar. Note that Chinese exposure dropped from 2.50% earlier this year. While it’s a fairly small weighting overall, relatively speaking, that is a pretty significant weighting change from where it was. That could highlight the weakness we see in Chinese equities. Overall, U.S. exposure had climbed to 63.80% from the 56.86% previously – as exposure across the board declined in Europe and Asia.
BUI Geographic Allocation (BlackRock)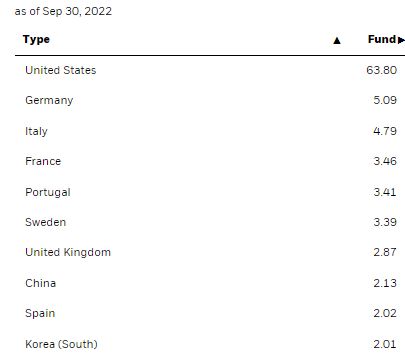
China and Europe were specifically called out in the investor letter talking about the general market environment.
Furthermore, the energy shock and a deteriorating economic backdrop in China and Europe are likely to challenge corporate earnings…
The repositioning away from other geographic regions and back to the relatively more stable U.S. could have been a conscious effort, or it could have just naturally occurred as prices deteriorated elsewhere faster.
Looking at the top ten holdings, NextEra Energy (NEE) continues to dominate the top spot by a significant margin. It has now moved to a more than double weighting relative to the next largest position.
BUI Top Ten (BlackRock)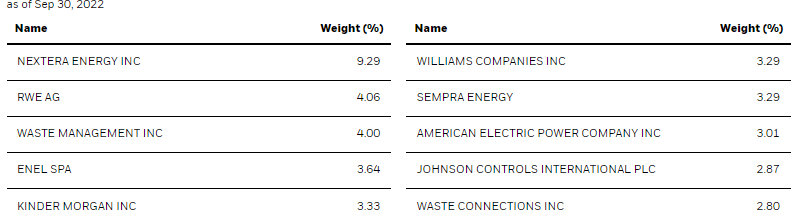
Enel SpA’s (OTCPK:ENLAY) position has shrunk from the second largest to the fourth largest. This seems to be linked to continued weakness in the Italian market. This was also noted as being a weak spot in the portfolio earlier this year.
The Italian utility Enel S.p.A., which was pressured by broad-based weakness in the European markets, was an additional detractor of note.
Another interesting position to gain some ground with the latest update is Waste Management (WM). This highlights another differentiated position and expands on the “infrastructure” classification. However, it has presented a fairly solid performance relative to the broader market on a YTD basis. So it is certainly good to have in their portfolio.
Of the top five positions for BUI, Kinder Morgan (KMI) came in with the only positive performance. Perhaps this is unsurprising as it is energy-related, operating as a midstream company. With energy the only positive performing sector YTD at 44%+ due to commodity prices jumping, it’s natural that KMI would perform well, too.
YCharts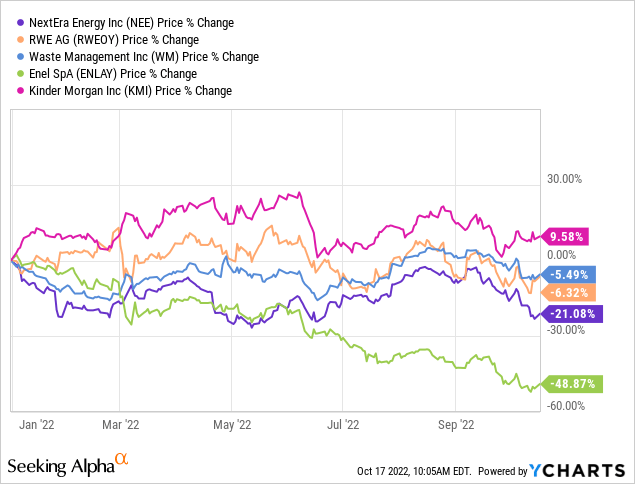
Conclusion
BUI is a diversified utility, infrastructure and power fund. While the options writing strategy is encouraging to see relatively better results had it not been employed, it has still resulted in similar results with leveraged “peers.” At least, peers in the sense that they all invest in infrastructure in one way or another. The sector is so broad there is a lot of play between funds.
While I would have loved to see the fund perform even better relative to these other infrastructure funds, it still remains that the options premium generated by this fund can contribute to the distribution being covered. I believe that is still one benefit in this market when we don’t know how the market will move from one day to the next. In any market environment, these option premiums can be generated. In fact, a more volatile market could contribute to higher premiums.
Be the first to comment