

Alex Wong
“The stock market is a no-called-strike game. You don’t have to swing at everything – you can wait for your pitch. The problem when you’re a money manager is that your fans keep yelling, ‘swing, you bum!’ ”Warren Buffett, April 3, 2016“
In an article published on November 11, 2019, I argued that you and I and Warren Buffett all shape our investment decisions in response to the same few factors. The article was entitled “The Conundrum That Puts Berkshire And Buffett On The Clock: Buy Now Or Buy Better Later.” The conundrum involved the pressure time inflicts on investors. All of us prefer to have all the time in the world. We don’t. Investors often live with time pressure. Enough time pressure may lead to bad decisions for even the most steadfast and rational.
In the thirteen years following the Great Recession, the Fed suppressed rates and maintained a near zero Fed funds rate. It worked, sort of. The economy chugged along with moderate growth. Inflation remained low. The stock market rallied. Bonds continued their 40-year bull market with rates falling to near zero. It felt great for investors who raked in easy gains. The everything bull market gradually became an everything bubble but who cared.
The everything bull market came at a price. Sooner or later there would be a long period of poor returns or a major negative event in the markets, or both. Low rates basically killed the 60/40 portfolio (60% stocks, 40% bonds) which had provided a vehicle for conservative investors for decades. Now investors were forced to own overpriced stocks or hold zero-return cash. TINA stocks, the only alternative to fixed income, were priced based on the 2% or less available in bonds. That’s how we got stocks like McDonald’s (MCD) and Coca-Cola (KO) with essentially zero growth priced at more than 25 times earnings. True growth stocks were often priced at more than double that, discounting future earnings to infinity.
What would happen to them when rates normalized? Or was the present perhaps the “new normal”? Demographic trends both in the US and worldwide supported that as a possibility. From 2008 until 2022, I’m pretty sure that question was never far from the mind of Warren Buffett. His conglomerate, Berkshire Hathaway (NYSE:BRK.A)(NYSE:BRK.B) had a cash position that varied from a bit over $100 billion to as much as $140 billion earning next to nothing. That wouldn’t do. In 2019 Berkshire Hathaway had a market cap of less than $500 billion and that $100 billion in cash earning essentially nothing was a serious drag on overall return.
How Long Can You Wait For A Perfect Pitch?
Baseball and football have one major difference. Baseball is open ended while football has a time limit. Football outcomes often come down to managing the clock. Football fans can be confident that they will be home for dinner. Warren Buffett is a baseball guy, having once bought 25% of the local minor league Omaha Storm Chasers. Like me, he loved the famous Ted Williams diagram of 77 baseballs presented as a grid over home plate and color coded for the areas where the percentages favor taking a swing. I have noticed that a few value investors use that image as a sort of emblem for patient investing. Williams himself once said that if he had to swing at the less favorable pitches, he would have batted about .250 instead of .344. For much of his life, Buffett was able to invest the way Williams’s approach suggested – waiting patiently for an ideal pitch.
But real baseball isn’t exactly like that. How many pitches can you actually stand in the batter’s box and foul off? Even if you choke up your bat, you eventually have to try to hit a single. Highly disciplined and patient young investors can possibly wait for the perfect pitch, but older investors can’t, and people responsible for investing other people’s money certainly can’t. Many Seeking Alpha articles – perhaps most – are built around ways to hit singles on imperfect pitches in an environment where the perfect pitch to swing at has become increasingly rare. It becomes increasingly tempting to lower your standards a bit and go for an investment that doesn’t quite meet your quality standards or comes with clear risks.
The last home run for Buffett was Burlington Northern Santa Fe Railroad which was bought for $44 billion in an acquisition which closed in 2009. The market had not yet caught on to the fact that suppressed rates were going to last for over a decade. As a result, the price paid was reasonable by traditional measures. Although acquisitions don’t reprice, a comparison to the $126 billion market cap of Union Pacific (UNP) suggests that the value of BNSF has tripled. Its compounded annualized return is thus about 9%. That’s a number to file away in the back of your head. For a long-term investor, that’s a solid rate of profit growth for a satisfactory long-term investment. Since 2009, investments with the combination of growth and safety provided by BNSF have been few and far between.
Buffett nevertheless felt the same pressure to swing as I did, along with quite a few of you readers, I would guess. Over the course of the next decade, he made three investments of some size which, with the benefit of hindsight, appear to reflect pressure to swing at a less than optimal pitch. They included IBM (IBM), the Kraft acquisition by Heinz to form Kraft Heinz (KHC), and the acquisition of Precision Castparts (PCP). In each case, Buffett acknowledged that he had made a mistake and made no excuses. In his 2020 Annual Shareholder letter, he wrote down the value of the Precision Castparts acquisition by $11 billion and acknowledged that he had overestimated its future profit stream and overpaid. The problem in all three cases was that the market offered nothing better at a reasonable price, and in the few cases of very desirable utility assets, he was ultimately overbid by hedge fund competitors who were willing to pay up in the cheap money they had available. The true underlying reason was the incredible difficulty of keeping your bat on your shoulder while hearing the roar of “Swing, you bum.” Here is what he had to say in this February 27, 2017, interview on CNBC with Becky Quick:
Measured against interest rates, stocks actually are on the cheap side compared to historic valuations. But the risk always is…is that interest rates go up a lot, and that brings stocks down. But I would say this, if the ten-year stays at 2.30, and they would stay there for ten years, you would regret very much not having bought stocks now.”
Here’s an update of that view made during the Q and A portion of the 2017 Annual Meeting focusing specifically on his cash reserve:
At a point, the burden of proof really shifts to us, big time. There’s no way I can come back here three years from now and tell you that we hold US $150 billion or so in cash.”
You can see that Buffett is well aware of the importance of prevailing fixed income rates. In his famous May 1977 Fortune article, Buffett referred to stocks as “equity bonds.” He explained how a rise in price of bonds was accompanied by a fall in the yield, and vice versa. It’s simple math. He then explained that the same principle worked for stocks. When rates fall, prices rise but future returns fall because the interest paid has pulled returns from the future into the present. That’s what happened as rates fell and stayed low after the Great Recession. The general investing landscape became, and remained, less favorable. Only a rise in rates and a decline in market prices could improve things. If you read only one thing written by Buffett, that 1977 Fortune article is it.
Loading Up On Apple And The Buyback Solution
Shortly after the above 2017 comments, Buffett took a closer look at Apple (AAPL), a solid growth company which his lieutenant Todd Combs had brought to his attention in 2016. He recognized that the analysts quibbled over its quarter-to-quarter numbers while missing the big story of Apple’s brand power. Apple was an outlier, a solid growth company which looked cheap and was cheap. He bought it persistently until the middle of 2019 by which time the market had caught on. By the end of 2019, the Berkshire position in Apple had quadrupled in value. At that point, he began an aggressive program of buybacks.
With T Bill rates still near zero repurchasing, Berkshire Hathaway itself made sense. It reduced book value without changing earnings so that Return on Equity, which had been falling because of a large cash position returning nothing, had fallen well below 9%. Large buybacks would lift ROE and improve per share returns on all metrics. Buybacks replaced Apple is the primary way to deploy capital.
The ideal situation for buybacks lasted for two years. Buybacks were around $5 billion in 2019, most the 4th quarter, almost $25 billion in 2020, almost $27 billion in 2021. Then in 2022, buybacks regressed to $5 billion for the first three quarters. In operational terms, Berkshire hadn’t changed. What changed was the rise of Treasury Bill rates from almost zero to 4%. It became a much tougher choice to take cash out of T Bills rising toward 4% in order to continue to reduce Berkshire shares outstanding. As rates began to rise, Berkshire stock itself rose powerfully through the first quarter. Here’s how the period of Apple purchases, Berkshire buybacks, and rising T Bill rates looks on a chart:
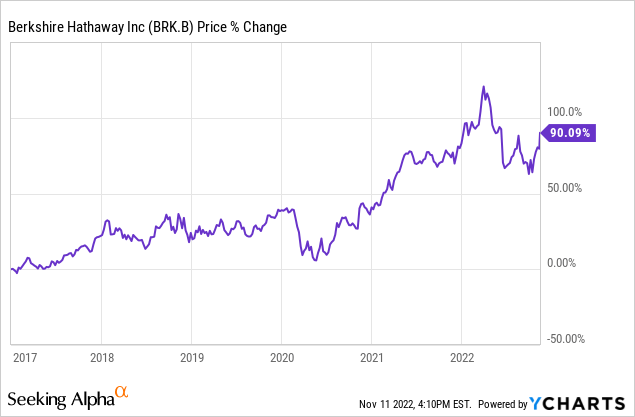
There’s a cool rationality about the shift to heavy buybacks in 2019 as well as the reduction of buybacks in 2022. In 2019, Apple had started to look more expensive at four times what Berkshire had paid for it. Most other solid growing companies were also expensive and Treasury Bills paid next to nothing. Berkshire itself was still cheap. By the first quarter of 2022, Berkshire itself was expensive and the T Bill rate had begun its rise toward current 4%.
Stipulating Three Rates Of Return And Solving For Time
In 2019, I stipulated that with low rates and high stock valuations, which are closely linked, all assets were priced for low return. For the sake of simplification, I further posited that an investor had one of two current options: buy short-term Treasury Bills offering 1.5% (but falling toward zero) or an equity asset offering 6.4% compounding annually. At the prevailing P/E in 2019, that was the expected return of the S&P 500. It was thus the expected return of an average stock. Here’s the key rule: if you choose the 1.5% T Bills, you can switch to that equity asset at any time you choose. If you take the 6.4%, however, it’s a permanent commitment. That was the world that confronted Warren Buffett, me, and you most of the time from 2009 to the end of 2021 – which for Buffett was a period of mainly mediocre investments bookended by the grand slam winners Burlington Northern Railroad and Apple.
There is another option, however. At some point in the future, there may – may – be an opportunity to buy a similar compounding equity asset offering 9%. You know that this 9% compounder is virtually certain to become available at some point less distant than the infinite horizon of the markets. Unfortunately, you have no privileged insight as to the exact moment that the 9% asset will become available. It may or may not appear before the arrival of your own personal deadline. There is no sound basis for attaching a probability of any kind.
Let’s assume that your personal time horizon for investing is 10 years. That’s about as far into the future as most of us can see. It’s also a long enough period that odd conditions in the market generally begin to work themselves out and extreme pricing of assets generally reverts to the long-term average. This time, with help from the Fed, it has taken a little longer.
Given the above stipulations, let’s solve for time in order to work out the elapsed time needed by which the 9% compounding equity asset would need to appear in order to catch up with the 6.4% commitment compounding from day one. The answer is 3.4 years. Holding the 6.4% compounding asset for all ten years produces an 85.96% ten-year gain. Holding the 1.5% T Bills for 3.4 years and then exchanging them for the 9% Equity Asset for the remaining 6.6 years produces a 10-year gain of 85.78%. If the opportunity to buy the equity asset returning 9% comes before that, you made a good decision to wait. If the opportunity comes later than that, you lose.
That’s the conundrum which has bedeviled investors for a good part of the past decade. It bedevils Buffett too. It’s an ongoing situation in an economic world with painfully slow but steady growth and interest rates profoundly suppressed either by the central banks or by abnormally low economic growth – a world which has provided increasingly limited opportunities to invest with the expectation of anything close to historical equity returns.
This has not stopped equity prices from rising, of course. Near zero fixed rates also happen to serve as the benchmark for a rising and highly priced equity market. It’s the flip side of the 1970s when rates provided a high benchmark and equities were depressed. Single digit P/E ratios throughout the 1970 provided a great entry point for stock investors but few realized it at the time. The high valuations of the past decade have created a difficult environment for finding companies with internal compounding sufficient to produce even that low 6.4% return. The result is a very difficult and unusual problem in asset allocation.
The two stock return numbers – 6.4% for the average S&P 500 stock and the 9% for a solid growing large equity asset – are about the same as they were three years ago. The one thing that has changed has been the yield on T Bills which is about two and a half times what it was three years ago. Deducting the current corporate tax rate, the yield of T Bills would be about 3.6%. Running the numbers again produces a very interesting result. Holding the 6.4% compounding asset for all ten years continues to produce that 86% ten-year gain. With that near tripling of T Bill rates, the breakeven point for arrival of the solid 9% opportunity expands to more than 9 years! That increase in time means that the penalty for biding your time and waiting for a fat pitch has decreased enormously.
How Has Buffett Reacted To 4% T Bills? Consider The Case Of Verizon
Verizon (VZ) is a classic TINA stock with little growth, long-term debt that has tripled over the past ten years, erratic free cash flow per share which has declined over that past ten years, a Q2 report which disappointed with both results and future guidance, and a Q3 report which did little to assuage investor concerns. It has lost ground to its chief competitor AT&T (T). It has lost a third of its value over the past six months and its dividend yield has risen to 6.78%. Whether that is a good thing or a bad thing, I will leave to the reader.
Buffett bought more than $8 billion of Verizon in Q1 2021 when the price was in the 50s and just beginning to roll over into a waterfall decline. Its dividend at the time Buffett bought it was around 4.5%. What was Buffett thinking at the time? With Treasury Bills still yielding close to zero (single digits), Verizon had the profile of an investment which would provide a meaningful cash return with acceptable risk. It was a universally recognized brand.
Why did Buffett sell in the most recent quarter and accept a significant loss? Verizon had two quarters with guidance that did not reassure but its basic underlying characteristics had not changed. What changed was the much increased yield of Treasury Bills which now provided a very competitive return without risk. One might guess which positions Buffett might sell next because of competition from 4% in T Bills. I’ll leave readers to speculate on that in comments.
What I will venture is an opinion on stocks he won’t sell because of the competition from Treasury rates. I would hazard a guess that Occidental (OXY) and Chevron (CVX) fall into that category. The size in which he has bought and continued to buy makes it highly likely that he thinks both companies and the energy industry as a whole are likely to do better for longer than the market currently believes. They are cheap and Chevron has a good dividend with OXY likely to have one soon, but the thinking behind his large purchases almost certainly places them in the category of solid large assets with a probable 9% or better future return. Thinking about the 4% hurdle in the above section makes that clear.
The Impact of 4% Fixed Income On You And Me
In important ways, investors in the acquisition phase are in the same position as Warren Buffett. He has a portfolio with the objective of long-term growth with safety. For a decade and a half, he has held much more cash than he prefers to hold. His ideal is to be as close to 100% invested as possible while setting aside cash for emergencies like major insurance losses or the economic lockdown which took place in the course of the pandemic. My own goal is similar.
What the 4% yield on short-term Treasuries does is enable an equity investor to wait. Little is sacrificed by waiting patiently in laddered short-term Treasuries. This article from Morningstar cites several respected sources who believe that stock and bond returns will converge over the next decade as stock valuations rerate to the negative. Here are some numbers:
Definitely, the case for bonds in the portfolio is coming back,” says Aliaga-Diaz of Vanguard. “Higher yields make the case for bonds stronger.”
Over the next 10 years, Vanguard is forecasting annualized nominal returns, that is before adjusting for inflation, on U.S. equities of 4.7%-6.7% and U.S. bonds at 4.1%-5.1%. Research Affiliates projects annualized nominal returns on U.S. equities of 2.3% over the next decade. Its forecast for U.S. bonds is 5.1% on an annualized nominal basis. Morningstar Investment Management projects U.S. stocks will deliver 5.5% in annualized nominal returns and 4.8% for U.S. bonds.”
This accords with my view, and the modestly divergent return estimates, all placing bond returns within one or two percent of stocks returns also are in about the same range dispersion that I see. One quick and easy answer to investors who don’t follow the markets closely is a return to the historically successful 60-40 portfolio which helped many conservative investors do well with annual rebalancing in the past. What makes this possible is the return of the magic fixed income number: 4%.
Conclusion
There is an underlying assumption that the Fed will not abruptly reverse its present policy and return to the extreme low rate policy of the past decade and a half. Their experience with that policy has produced such a difficult situation that they will have great reluctance to repeat it. They will fight recessions as they have in the past with lower rates and monetary expansion but they will resist being so loose for so long or making money quite so cheap. What will the new “new normal” look like? Your guess is as good as mine, but I wouldn’t be surprised if occasional 3% inflation got a pass while rates on Treasuries fluctuated between 3.5 and 5 per cent. If you are old enough, you will recognize those numbers as an “old normal” long-term average for the 20th century.
One day next week Berkshire’s 13F report will reveal what actions he took over the third quarter. What Buffett did or did not do will provide a market tell if considered carefully in terms of the alternative now presented in the markets. Actions taken or not taken in buying back Berkshire stock will provide another tell. Patience is again the name of the game for value investors and there are worse things than sitting in short Treasuries while waiting for risk assets to become more attractive.
Be the first to comment