

BTCUSD: Triple Top Pattern Below $20441
Bitcoin was unable to sustain its bullish momentum and after touching a high of 20441 on 06th Oct, it started to decline touching a low of 18977 today in the early Asian trading session.
The prices of bitcoin continue to decline amid the selling pressure that is seen across the cryptocurrency markets globally.
We can see that the prices are ranging near a new record low of 1 month in the weekly time frame.
We can clearly see a triple top pattern below the $20441 handle which is a bearish reversal pattern because it signifies the end of an uptrend and a shift towards a downtrend.
Bitcoin touched an intraday high of 19282 and an intraday low of 18960 in the Asian trading session today.
Both the STOCH and STOCHRSI are indicating overbought levels which means that in the immediate short term, a decline in the prices is expected.
The relative strength index is at 43 indicating a WEAK demand for bitcoin, and the continuation of the selling pressure in the markets.
Bitcoin is now moving below its 100 hourly simple moving average and above its 200 hourly exponential moving averages.
Some of the major technical indicators are giving a SELL signal, which means that in the immediate short term, we are expecting targets of 18500 and 18000.
The average true range is indicating LESS market volatility with a mild bearish momentum.
- Bitcoin: bearish reversal seen below $20441
- The Williams percent range is indicating an overbought level
- The price is now trading just below its pivot level of $19107
- Some of the moving averages are giving a SELL market signal
Bitcoin: Bearish Reversal Seen Below $20441
The fall in the price of bitcoin is in line with the three failed attempts at breaching the $20500 resistance level. We are now heading towards the important support level of $19000 which if broken will pave the way towards $18000.
We can see the formation of a bearish harami and bearish harami cross pattern in the 15-minute time frame.
The commodity channel index is giving a neutral level and the relative strength index is approaching the 50 level.
The immediate short-term outlook for bitcoin is mildly bearish, the medium-term outlook has turned neutral, and the long-term outlook remains neutral under present market conditions.
Bitcoin’s support zone is located at $18656 and the prices need to remain above this level for a potential bullish reversal in the markets.
The price of BTCUSD is now facing its classic support level of 19028 and Fibonacci support level of 19087 after which the path towards 18500 will get cleared.
In the last 24hrs BTCUSD has decreased by 0.92% by 176$ and has a 24hr trading volume of USD 28.521 billion. We can see an increase of 45.40% in the trading volume compared to yesterday, due to increased selling pressure in the markets.
The Week Ahead
The price of bitcoin is moving in a mildly bearish zone below the $19500 level. Further downsides are projected at $18500 and $18000 as the immediate targets.
After the recent decline, bitcoin is staging for a recovery once it breaches down the important support level of $19000.
The average direction index and MA5, MA10 are indicating a bullish rebound in the price towards the $20000 level.
The daily RSI is printing at 43 which indicates a neutral level and a move towards the consolidation phase in the markets.
The price of BTCUSD will need to remain above the important support level of $18500 this week.
The weekly outlook is projected at $19000 with a consolidation zone of $18800.
Technical Indicators:
The moving averages convergence divergence (12,26): is at -75.50 indicating a SELL
The ultimate oscillator: is at 44.42 indicating a SELL
The rate of price change: is at -0.661 indicating a SELL
Bull/Bear power (13): is at -10.73 indicating a SELL
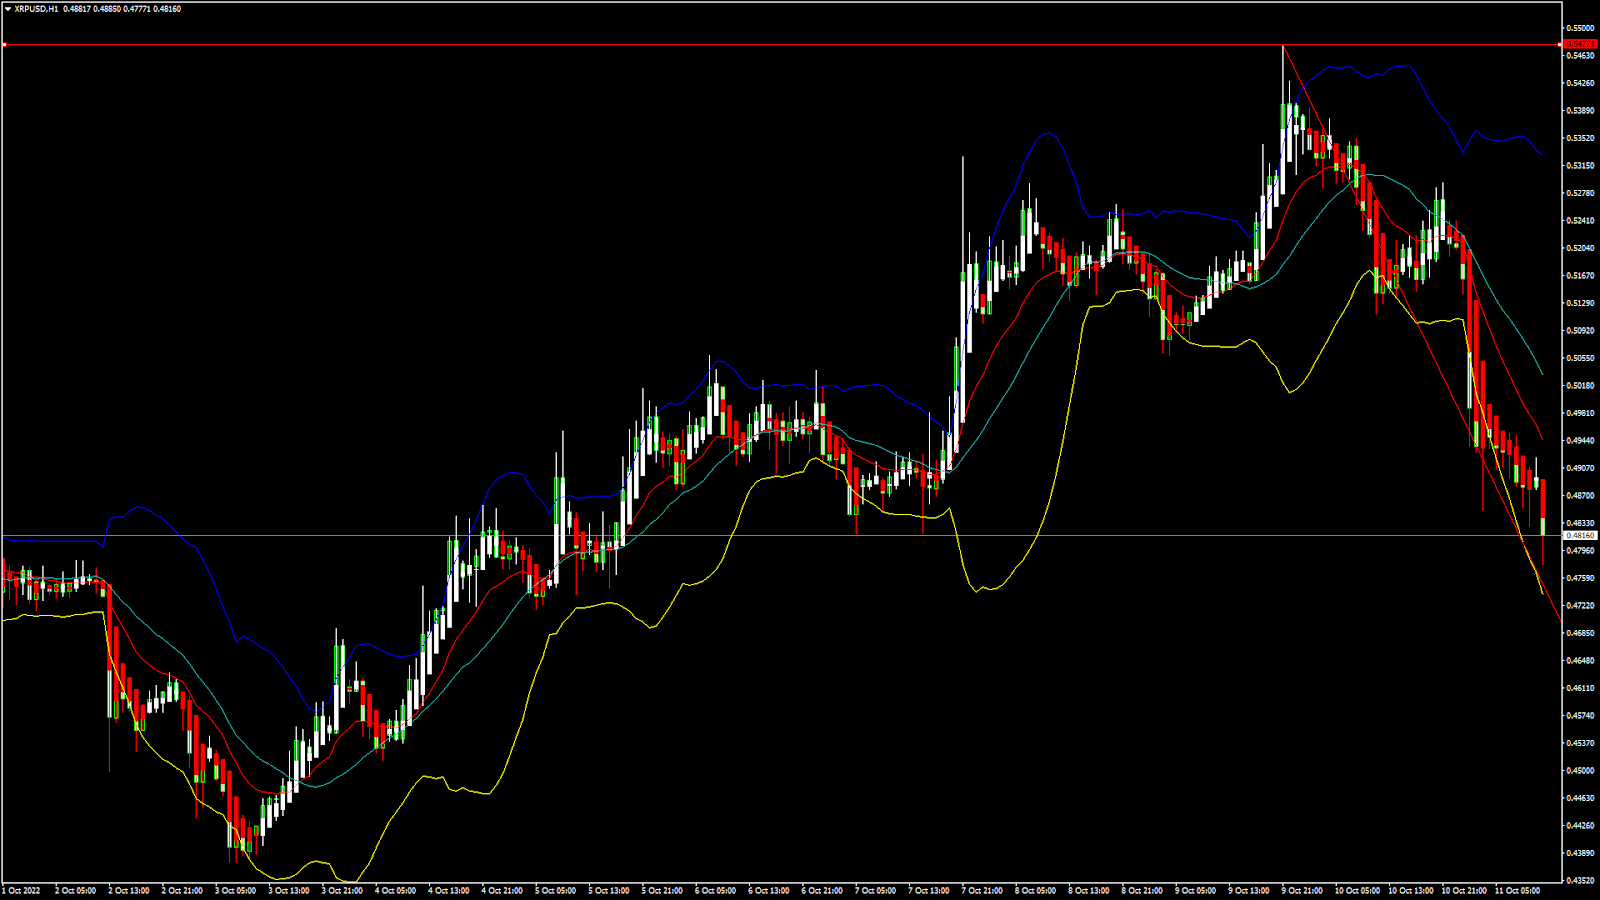
XRPUSD: Hanging Man Pattern Below 0.5477
Ripple was unable to sustain its bullish momentum and after touching a high of 0.5412 on 09th Oct, the prices started to decline touching a low of 0.4821 today in the European trading session.
The parabolic SAR indicator is giving a bearish reversal signal in both the 15-minute and 30-minute time frames.
We can see an opening gap in the markets which is down indicating the bearish nature of the markets.
We can clearly see a hanging man pattern below the 0.5477 handle which is a bearish reversal pattern because it signifies the end of an uptrend and a shift towards a downtrend.
Ripple touched an intraday high of 0.5204 in the Asian trading session and an intraday low of 0.4789 in the European trading session today.
We can see that the momentum indicator is back under zero indicating a bearish scenario in the daily time frame.
The relative strength index is at 25 which signifies a very weak demand for Ripple at the current market prices and the continuation of the selling pressure in the markets.
All of the moving averages are giving a STRONG SELL signal at the current market level of 0.4814.
Ripple is now trading below its pivot level of 0.4894 and is facing its classic support level of 0.4827 and Fibonacci support level of 0.4878 after which the path towards 0.4700 will get cleared.
Most of the major technical indicators are giving a STRONG SELL signal.
- Ripple: bearish reversal seen below the 0.5477 levels
- The Williams percent range is indicating an oversold level
- The average true range indicates LESS volatility
- Ripple gains bearish bias against the US dollar
Ripple: Bearish Reversal Seen Below 0.5477
We can see that the price of Ripple continues to decline against the US dollar and has broken the support level of 0.5000. We are now heading towards the 0.4800 level.
The price of Ripple continues to struggle with the formation of a bearish trendline as the selling pressure continues. As we can see, Ripple was unable to gain a bullish traction last week after its failed attempt at crossing the 0.5600 resistance barrier.
The MACD has crossed down its moving average indicating the bearish trend in the daily time frame.
The price of Ripple is ranging back under the pivot point indicating a bearish scenario.
The short-term outlook for Ripple has turned bearish, the medium-term outlook is neutral, and the long-term outlook is neutral under present market conditions.
The moving average MA20 is giving a bearish trend reversal signal in the 2-hour time frame.
The price of XRPUSD has decreased by 6.83% with a price change of $0.03526 in the past 24hrs and has a trading volume of 2.441 billion USD.
We can see an increase of 8.84% in the trading volume of Ripple compared to yesterday, which appears to be normal.
This Week Ahead
Ripple was unable to gain pace against the US dollar as the selling pressure continues, and we are now heading towards the 0.4700 level.
Some of the technical indicators are also giving a neutral tone which hints that we may be preparing for staging a recovery from these levels.
We can see a continuous progression of a bearish trend line formation from 0.5477 towards the 0.4690 level.
The weekly outlook for Ripple is projected at 0.4700 with a consolidation zone of 0.4600.
Technical Indicators:
The relative strength index (14): is at 25.15 indicating a SELL
The average directional index (14): is at 62.70 indicating a SELL
The ultimate oscillator: is at 39.00 indicating a SELL
The rate of price change: is at -7.16 indicating a SELL
FXOpen offers the world’s most popular cryptocurrency CFDs*, including Bitcoin and Ethereum.
Floating spreads, 1:2 leverage, 30% margin call, 0.01 lot minimum transaction size with no maximum — at your service.
Open your trading account now or learn more about making your money go further with FXOpen.
*Cryptocurrency CFDs are not available to Retail clients in the UK
Be the first to comment