

Vertigo3d/iStock via Getty Images
Editor’s note: Seeking Alpha is proud to welcome Dang Quan Vuong as a new contributor. It’s easy to become a Seeking Alpha contributor and earn money for your best investment ideas. Active contributors also get free access to SA Premium. Click here to find out more »
Sentiment among traders and investors is a key element that drives the market, as euphoria marks the tops and extreme fear arrives at the bottoms. Looking at the total negative sentiment toward Bitcoin (BTC-USD) across various social media platforms, its recent surge has irritated market participants by adding to various instances of FUD (fear, uncertainty, and doubt). It is likely to have an impact on their investment decisions and, in turn, might hurt the entire market sentiment via a snowball effect. (Note: Please open all images below in a new tab for a larger view.)
Total negative sentiment of Bitcoin spikes as bears dominate the conversations on social platforms. (Santiment)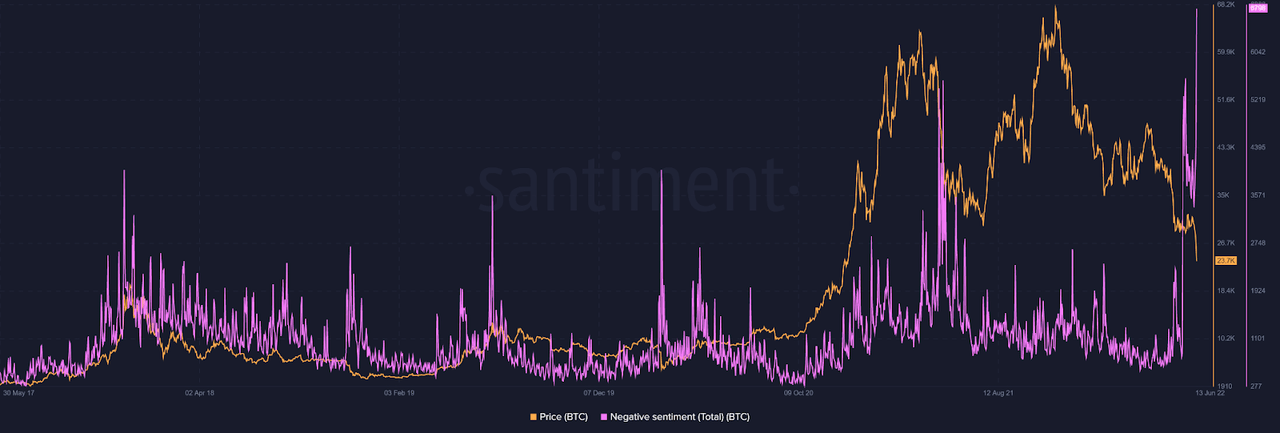
In the meantime, the amount of content that mentioned a Bitcoin “crash” on various social platforms – such as Reddit, Twitter (TWTR), and Telegram – surged in May when bitcoin was trading in a range.
‘Crash’ mentions spiked in face of the prevailing global economic uncertainty. (Santiment)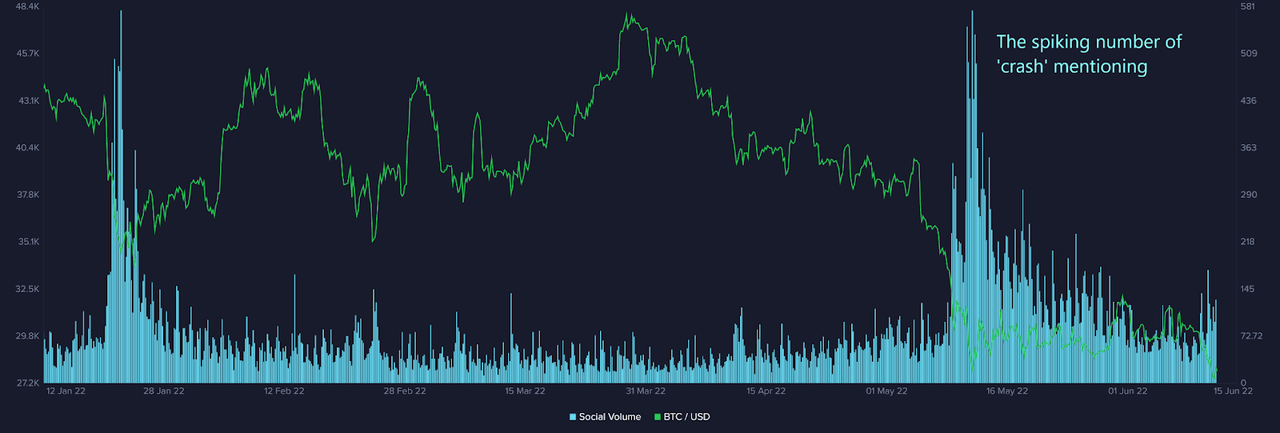
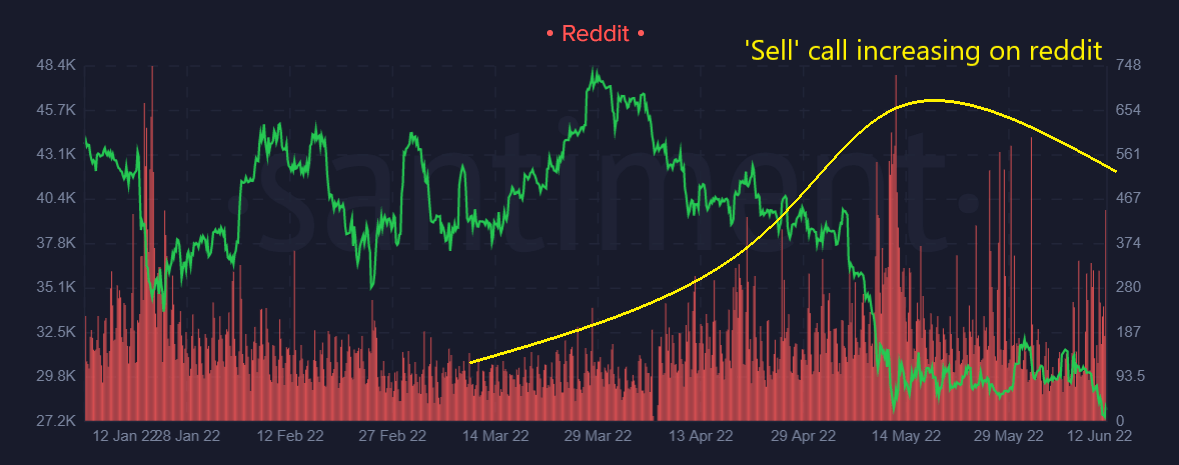
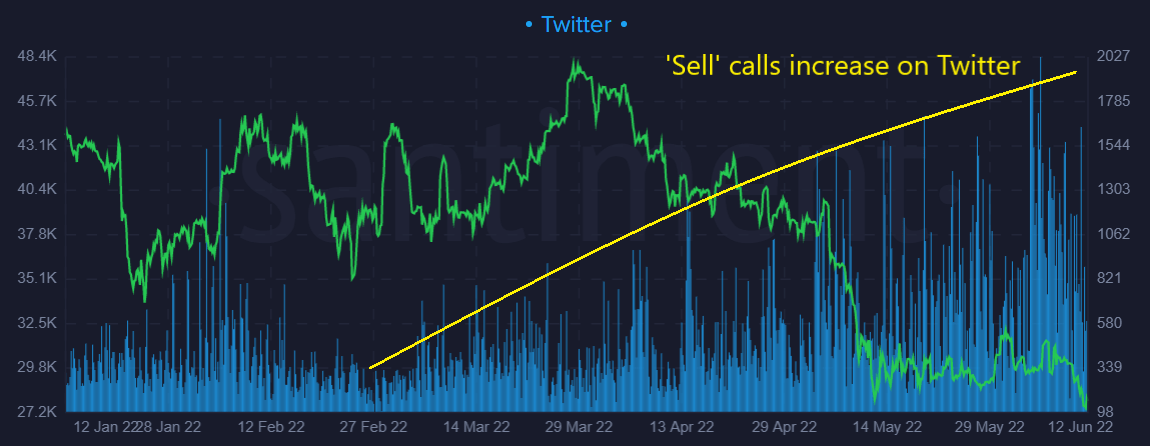
Meanwhile, the number of “sell” calls has increased since then, emphasizing Bitcoin’s negative aspect on various social media platforms. It could have made a substantial contribution to the current market sentiment that favors the breakout down to $20,000.
The increasing ‘sell’ calls are mostly from reddit and twitter. (Santiment) The increase of sell calls signals the bearish sentiment on Reddit. (Santiment) The increase of sell calls indicates the bearish sentiment on Twitter. (Santiment)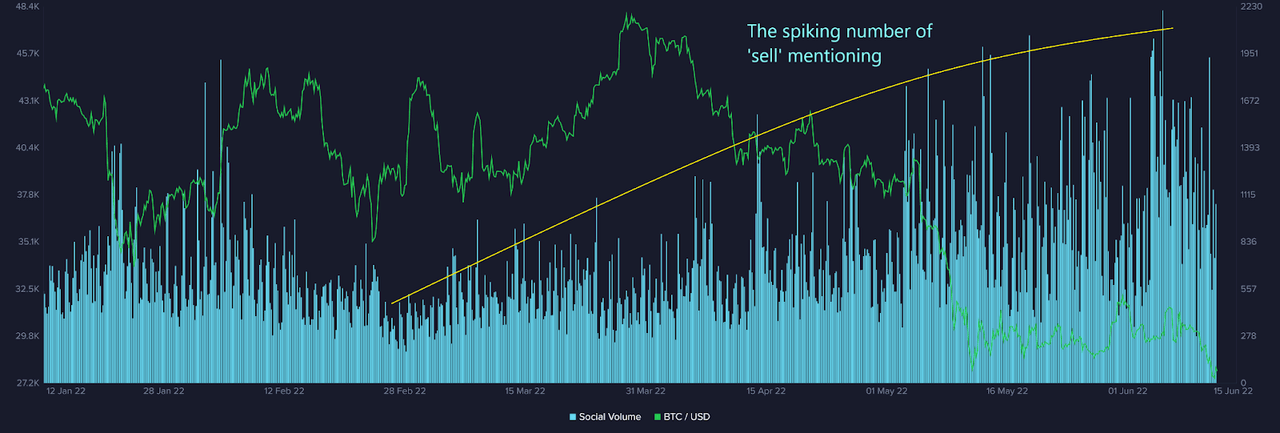
Accordingly, FTX and BitMEX funding rates have fallen below the zero line with the large absolute values. It demonstrates that those who short are more active and aggressive as they add more to their short positions, regardless of the extra funding to pay for the long side.
Shorts become active when the funding rate falls into the negative zone. (Santiment)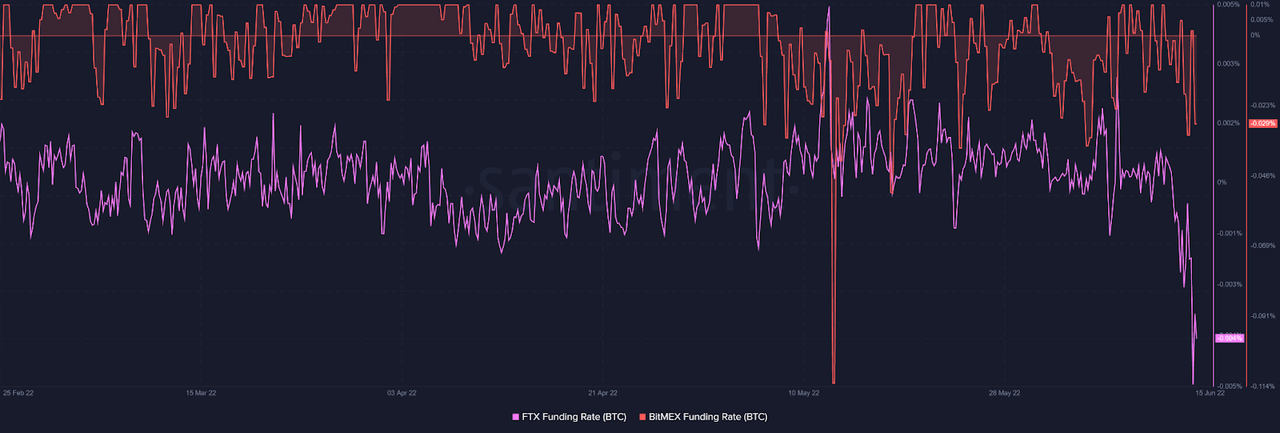
The behavior of long-term holders can be described using realized market capitalization HODL (hold on for dear life) waves, which are an alternative to circulation HODL waves. According to Santiment, this metric represents the proportion of realized cap for a given time-bound interval in total realized cap value. Simply put, when this value becomes excessively high, the network becomes overvalued – and vice versa. At present, this metric is relatively low as the network is undervalued.
Realized Market Capitalization Hodl Waves suggests the network is undervalued. (Santiment)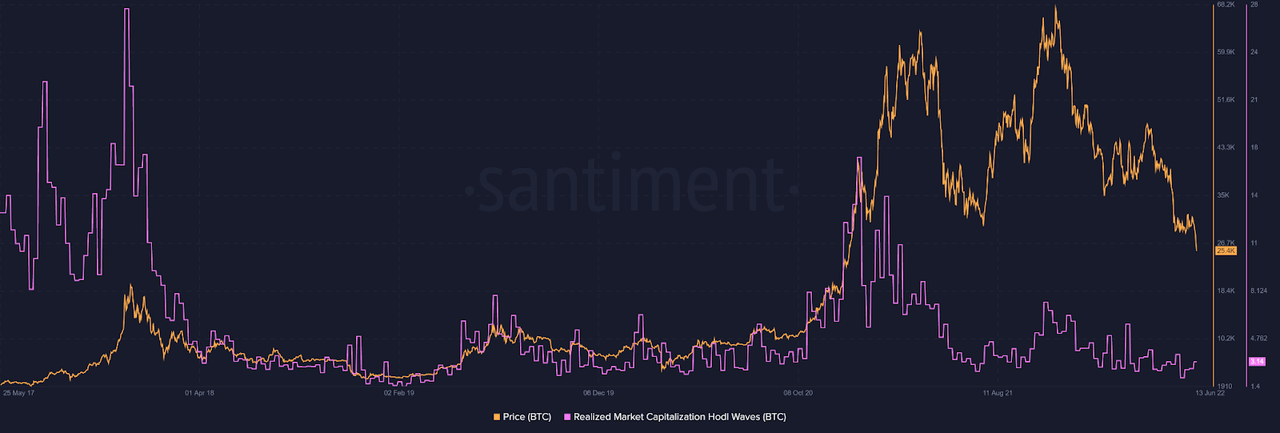
Regarding the network value, the 10-year market value/realized value ratio (or MVRV) is calculated as the market capitalization (market value, or MV) divided by the realized capitalization (realized value, or RV) based on the amount of coins that moved at least once within ten years. It estimates that the network is presently undervalued as all coins circulating within ten years are all at the unrealized loss of nearly 17.48%. This means that if all studied coins were sold, most traders would suffer losses at the current Bitcoin price.
All coins that have circulated at least once in the last ten years are at a loss of nearly 17.48% on average. (Santiment)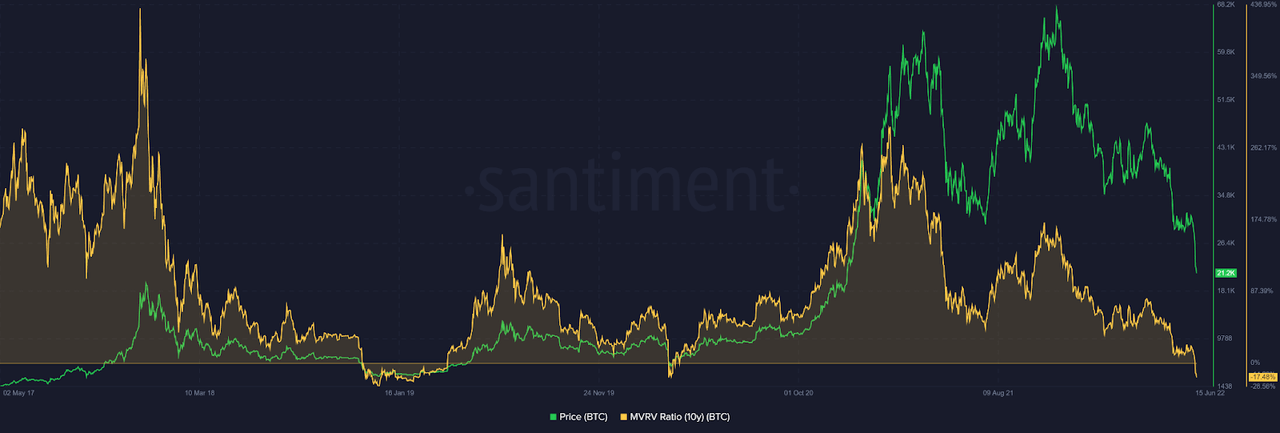
In addition, the MVRV long/short difference is defined as the difference between the MVRV of coins that moved at least once in the past 365 days and the MVRV of coins that moved at least once in the past 60 days. The negative value indicates that long-term holders will realize greater losses than short-term holders if they sell at the current price. This bear market has happened rather quickly, causing one-year holders to incur more losses than 60-day holders.
MVRV Long/Short Difference suggests that long-term holders suffer more losses than short-term holders. (Santiment)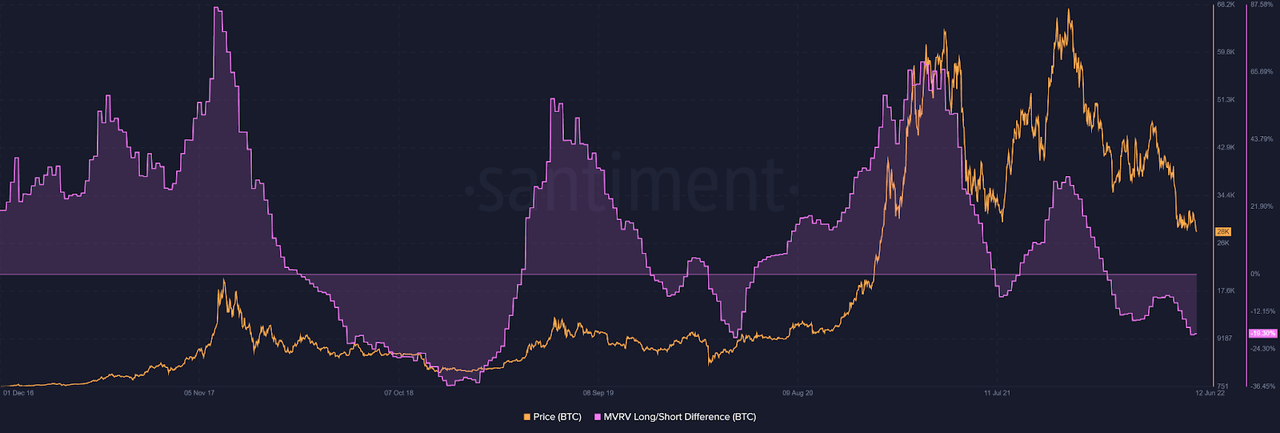
Looking at the daily on-chain transaction volume in loss, it shows the aggregate amount of bitcoins across all transactions on the network that moved in loss in a specific interval of time. This metric has risen quickly as holders are affected by the negative sentiment or a group of people trying to generate FUD. It might result in a panic sell at losses among stakeholders.
Daily on-chain transaction volume in loss rising quickly. (Santiment)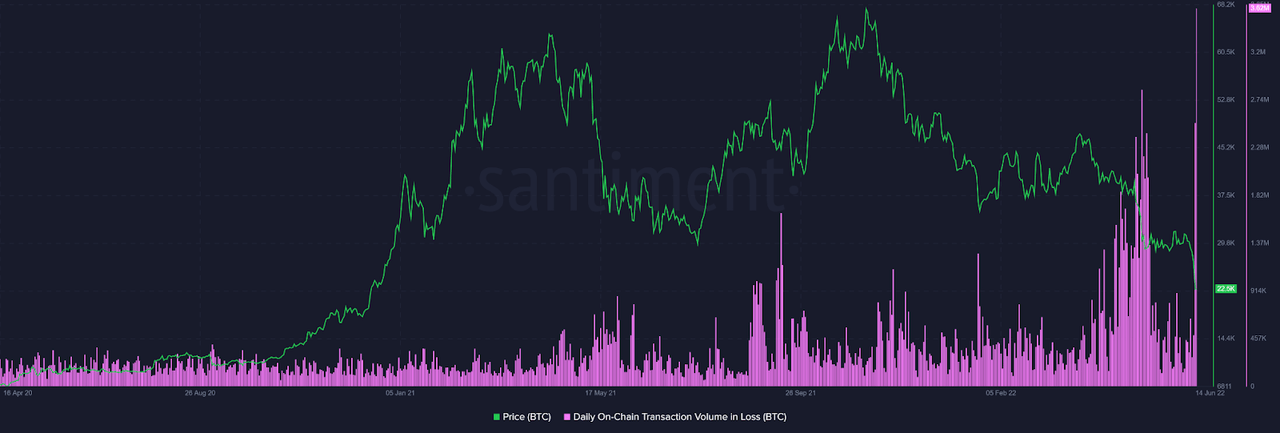
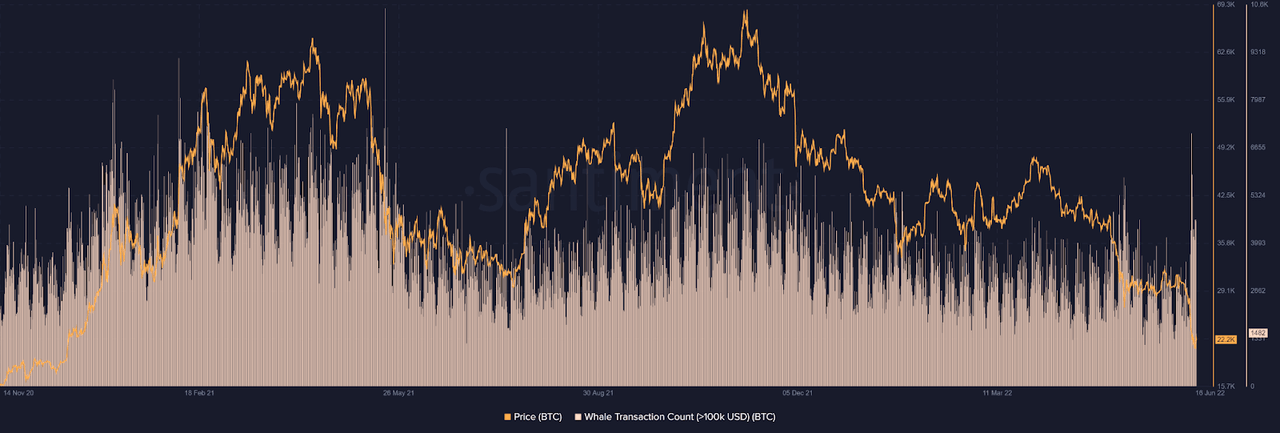
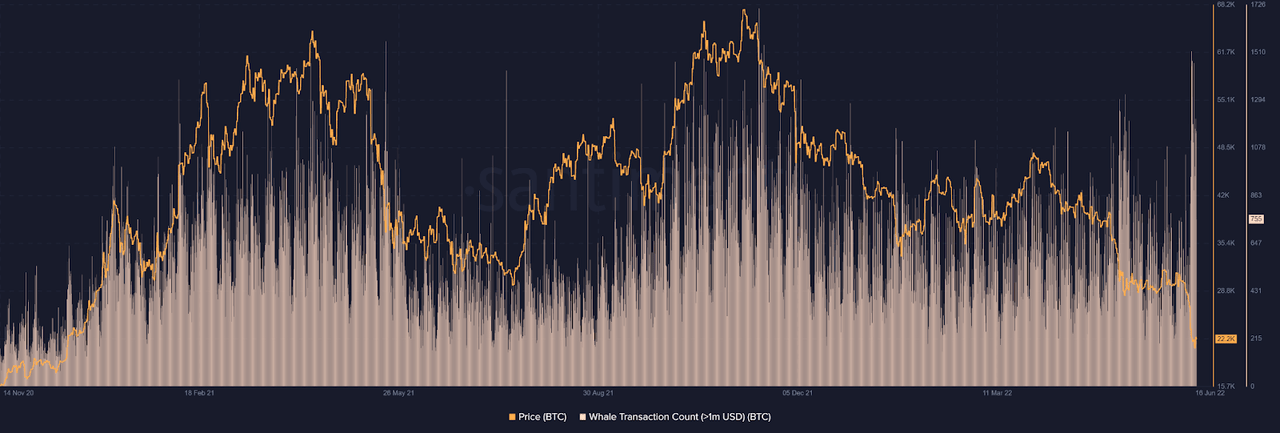
Additionally, as market participants become more hesitant and indecisive due to the prevailing economic conditions, the total volume of Bitcoin in USD sent over the network in a given interval has increased. Whales have been attributed to this rapid movement as evidenced by the number of transactions exceeding $100,000 and $1 million.
Transaction volume in USD has surged since Terra’s collapse. (Santiment) Whales transactions count over $100,000 spikes against the negative sentiment. (Santiment) Whales transactions count over $1 million spikes against the negative sentiment. (Santiment)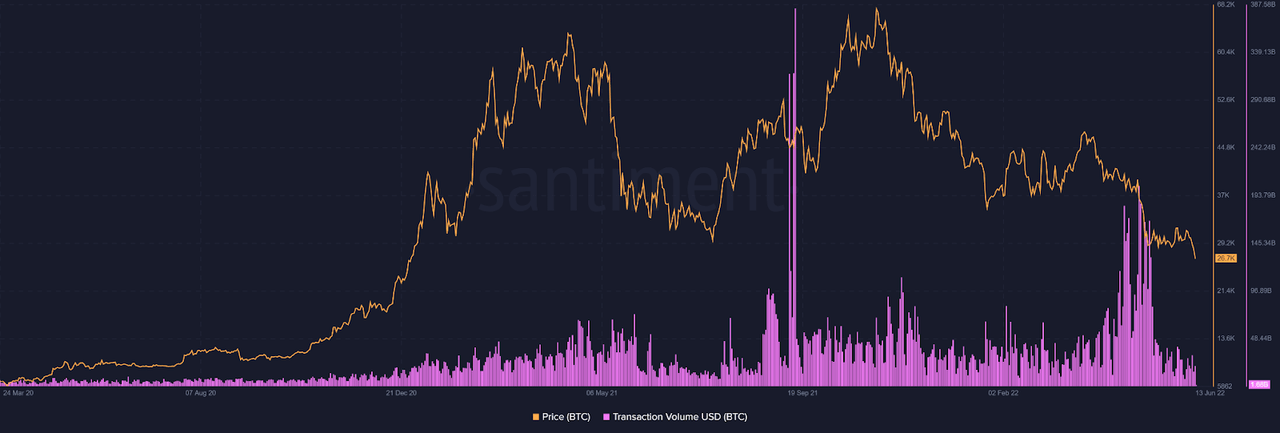
Most importantly, net unrealized profit and loss (NUPL), the difference between market cap and realized cap divided by market cap shows that the capitulation phase has begun as of May 2021. The maximal value of the ratio of investors who are in profit was as of that moment, and a sell-off has ensued. Currently, Bitcoin could be in the final stage of this phase with the possibility of panic selling as the outcome of negative discussions on social media platforms.
The final phase of the capitulation event has happened alongside the spike of negative sentiment. (CryptoQuant)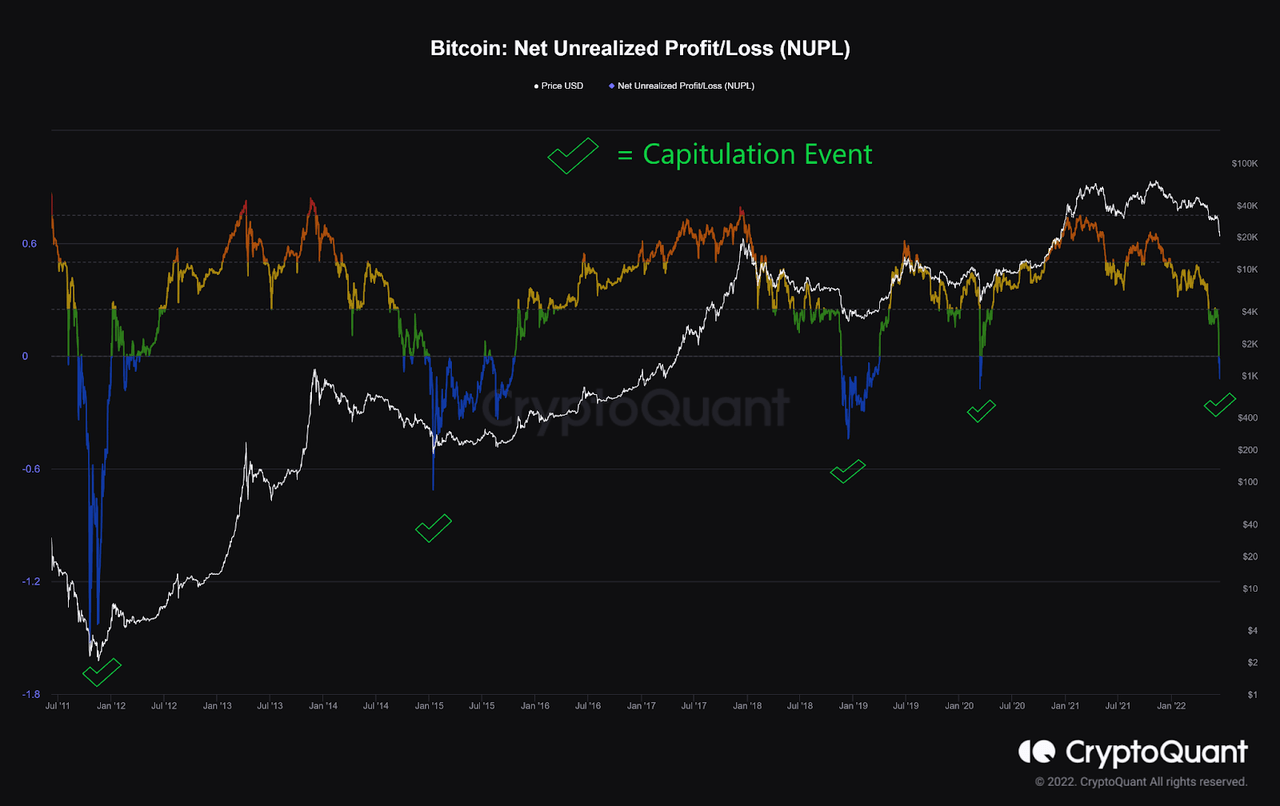
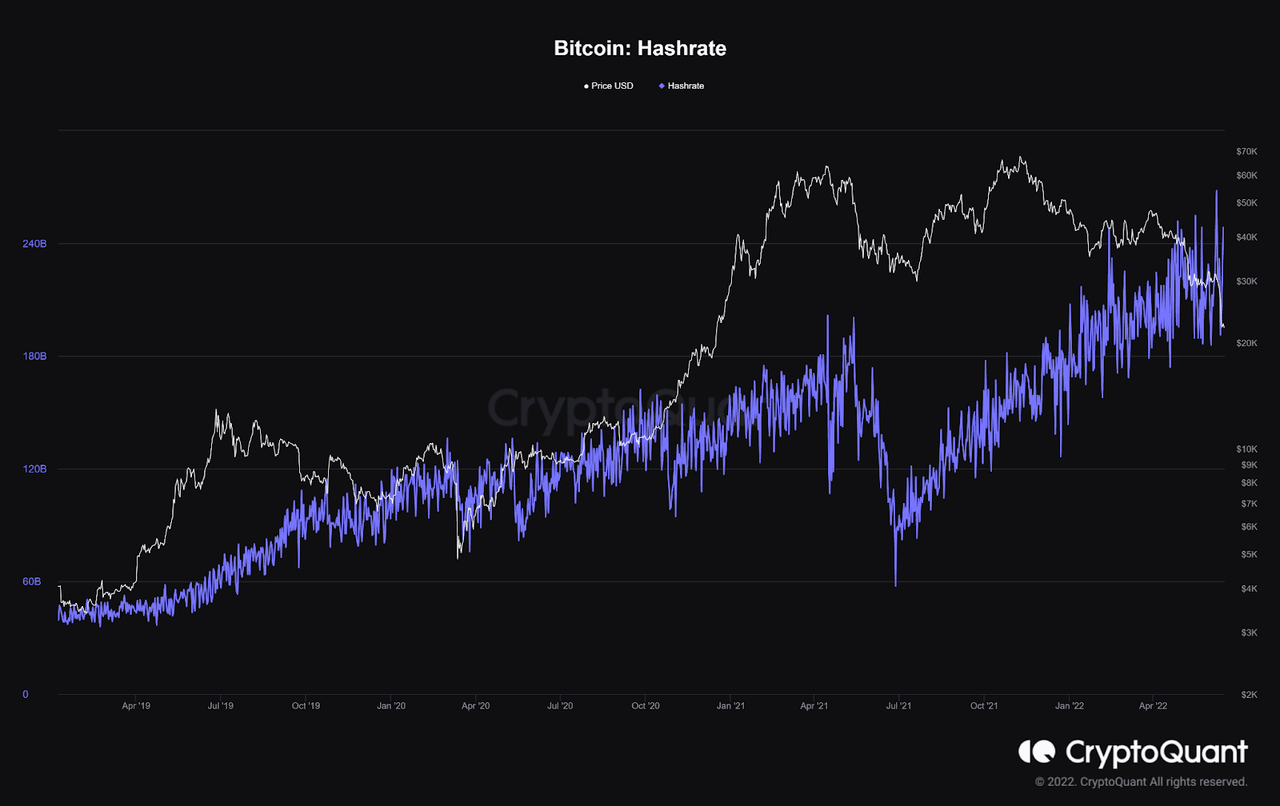
The major concern is that if Bitcoin continues to fall too low, the total mining costs will exceed miners’ revenue. So, they’ll be unable to keep the mining process running smoothly and the hashrate will drop as a result. Indeed, the aggregate amount of bitcoin transferred from all miners to all exchanges has recently spiked. They should probably be required to cover all the costs incurred in carrying out the operation of the mining process. When the price reached the significant level of $20,000, however, the hashrate has maintained the status quo as miners apparently believe in the coming bounce back or the fundamentals of Bitcoin.
The total amount of bitcoin transferred from all miners to all exchanges has surged recently. (CryptoQuant) The Bitcoin hashrate has increased during the bear market. (CryptoQuant)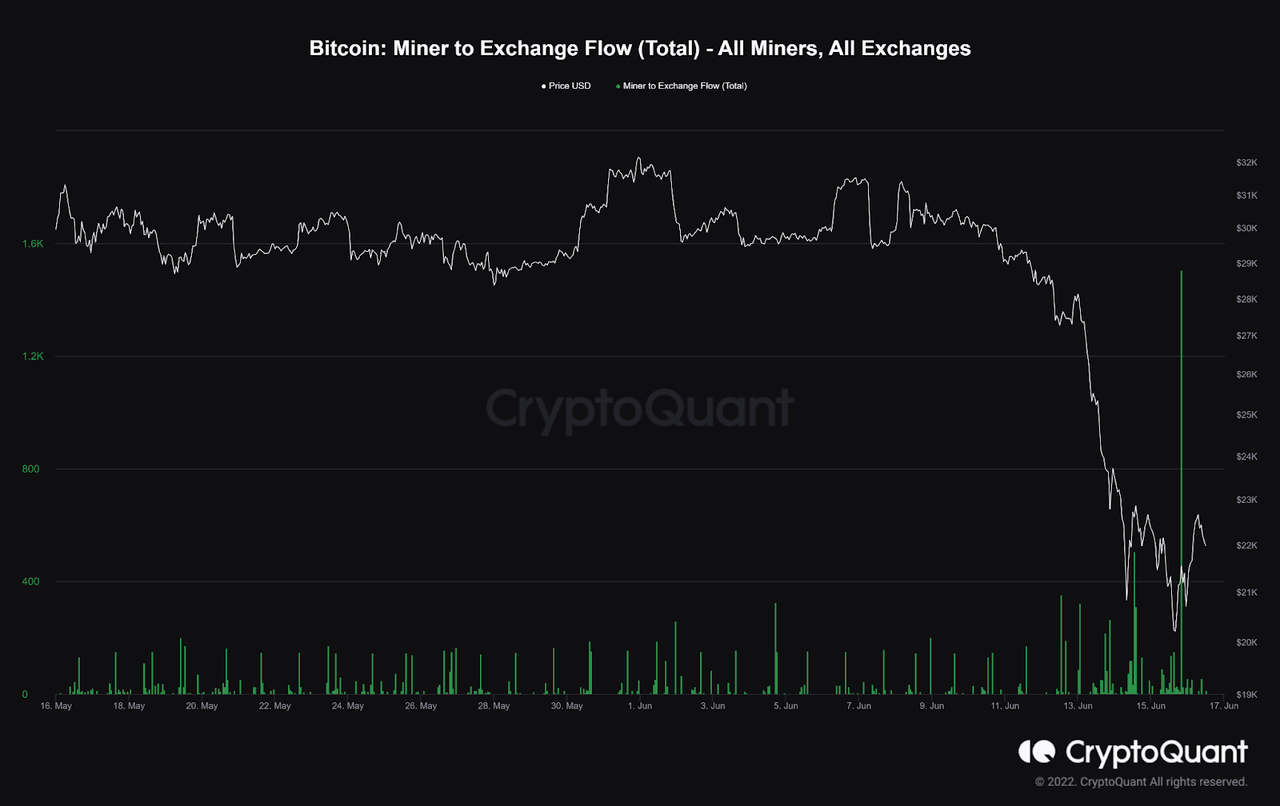
On balance, the level of negative sentiment among stakeholders has currently spiked in contrast to the very fundamentals of the Bitcoin network. It paints a bearish picture across various social media platforms as “Bitcoiners” feel anxious at the moment, potentially causing weak hands to panic sell at losses. Therefore, a final significant capitulation event can unfold that has historically led to bitcoin’s possible macro bottoms, as shown in the above figures. Nonetheless, it doesn’t mean the support of $20,000 is the bottom. The coming bottom will be looming in the near future when people already sell most of their coins at losses, and we should be looking at miners’ action if Bitcoin’s price goes down to under $20,000.
Be the first to comment