

utah778
(This article was co-produced with Hoya Capital Real Estate.)
In my most recent article here on Seeking Alpha, I refer to what I describe as “the world of 4,818.” After first describing the overall environment since the Global Financial Crisis of 2009, here is how I summarized developments over roughly the last 2 years.
In 2020, COVID hit. This sudden shock to the economy caused yet more stimulus to be introduced. In combination, the effect of this was to both increase the money supply, as well as hold down longer-term interest rates.
In time, however, inflation started to raise its ugly head. The pandemic led to a drop in spending on services but a sharp increase in spending on goods, as people found themselves confined to their homes. Then came supply chain issues, followed by the war in Ukraine.
In spite of this, the Fed left monetary stimulus in place through the entirety of 2021, contending that such inflation would be “transitory” in nature. It was not until February 18, 2022 that the Fed approved a 1/4 percent interest rate hike.
Since that time, however, the Fed has moved swiftly and dramatically, following that 1/4 percent hike with a 1/2 percent increase and two 3/4 percent increases, for a total increase of 2.25% YTD in 2022.
Even more recently, in response to stock market behavior appearing to indicate a belief that the Fed would quickly “chicken out” and cut rates, multiple Fed governors and finally Fed Chairman Powell went on public record unequivocally stating their resolve to stay the course until inflation returns to acceptable levels.
The result of all of this? To say the least, 2022 has been a historically bad year for the classic 60/40 portfolio. In the tweet captured below, Charlie Bilello provides an extremely concise visual picture of just how unusual the year has been.
Fortunately for me, with a YTD decline of 12.43%, my portfolio has done slightly better than the 60/40 value shown above. This is despite the fact that I have an allocation to international stocks, down roughly 22% on the year as quickly measured by the performance of iShares Core MSCI Total International Stock ETF (IXUS).
One of the reasons for this is Vanguard Short-Term Bond ETF (NYSEARCA:BSV). For the remainder of the article, I’d like to give you an overview of this excellent fund, as well as why it sits as my largest single holding at this point in time.
Vanguard Short-Term Bond ETF – Digging In
Particularly in this area of your portfolio, where your main goal is to generate income as opposed to capital gains, controlling your expenses is important. With an ultra-low expense ratio of .04%, BSV certainly meets this test.
But even more than that, BSV appears to be a rather unique offering in the world of ETFs. There are other ETFs that focus on bonds with maturities of between 0-5 years. However, from my research, with the exception of BSV, such ETFs feature either government or corporate bonds, but not a blend of the two.
If you want such a blend, offerings such as Vanguard Total Bond Market Index Fund ETF (BND), iShares Core U.S. Aggregate Bond ETF (AGG), and SPDR Portfolio Aggregate Bond ETF (SPAB) are excellent options from which to choose. However, these are “total U.S. bond market” offerings, with average durations in roughly the 6-7 year range. In contrast, BSV sports a duration of 2.7 years.
In short, while generally giving up something to BND, AGG, and SPAB in terms of yield, BSV is far less volatile. On the other side of the coin, while a little more volatile than an excellent treasury bond ETF, such as iShares 1-3 Year Treasury Bond ETF (SHY), BSV offers a fairly significantly higher level of income, due to higher-yielding corporate bonds comprising roughly 1/3 of the portfolio.
From Vanguard’s web page for BSV, here is a little more color concerning the underlying index it tracks.
Product summary
- Seeks to track the performance of the Bloomberg U.S. 1–5 Year Government/Credit Float Adjusted Index, a market-weighted bond index that covers investment-grade bonds with a dollar-weighted average maturity of 1 to 5 years.
- Invests in U.S. government, high-quality (investment-grade) corporate, and investment-grade international dollar-denominated bonds.
- Follows a passively managed, index sampling approach.
From that same Vanguard summary page, here is a more detailed breakdown of BSV’s composition. First, by credit quality.
BSV: Distribution By Credit Quality (Vanguard)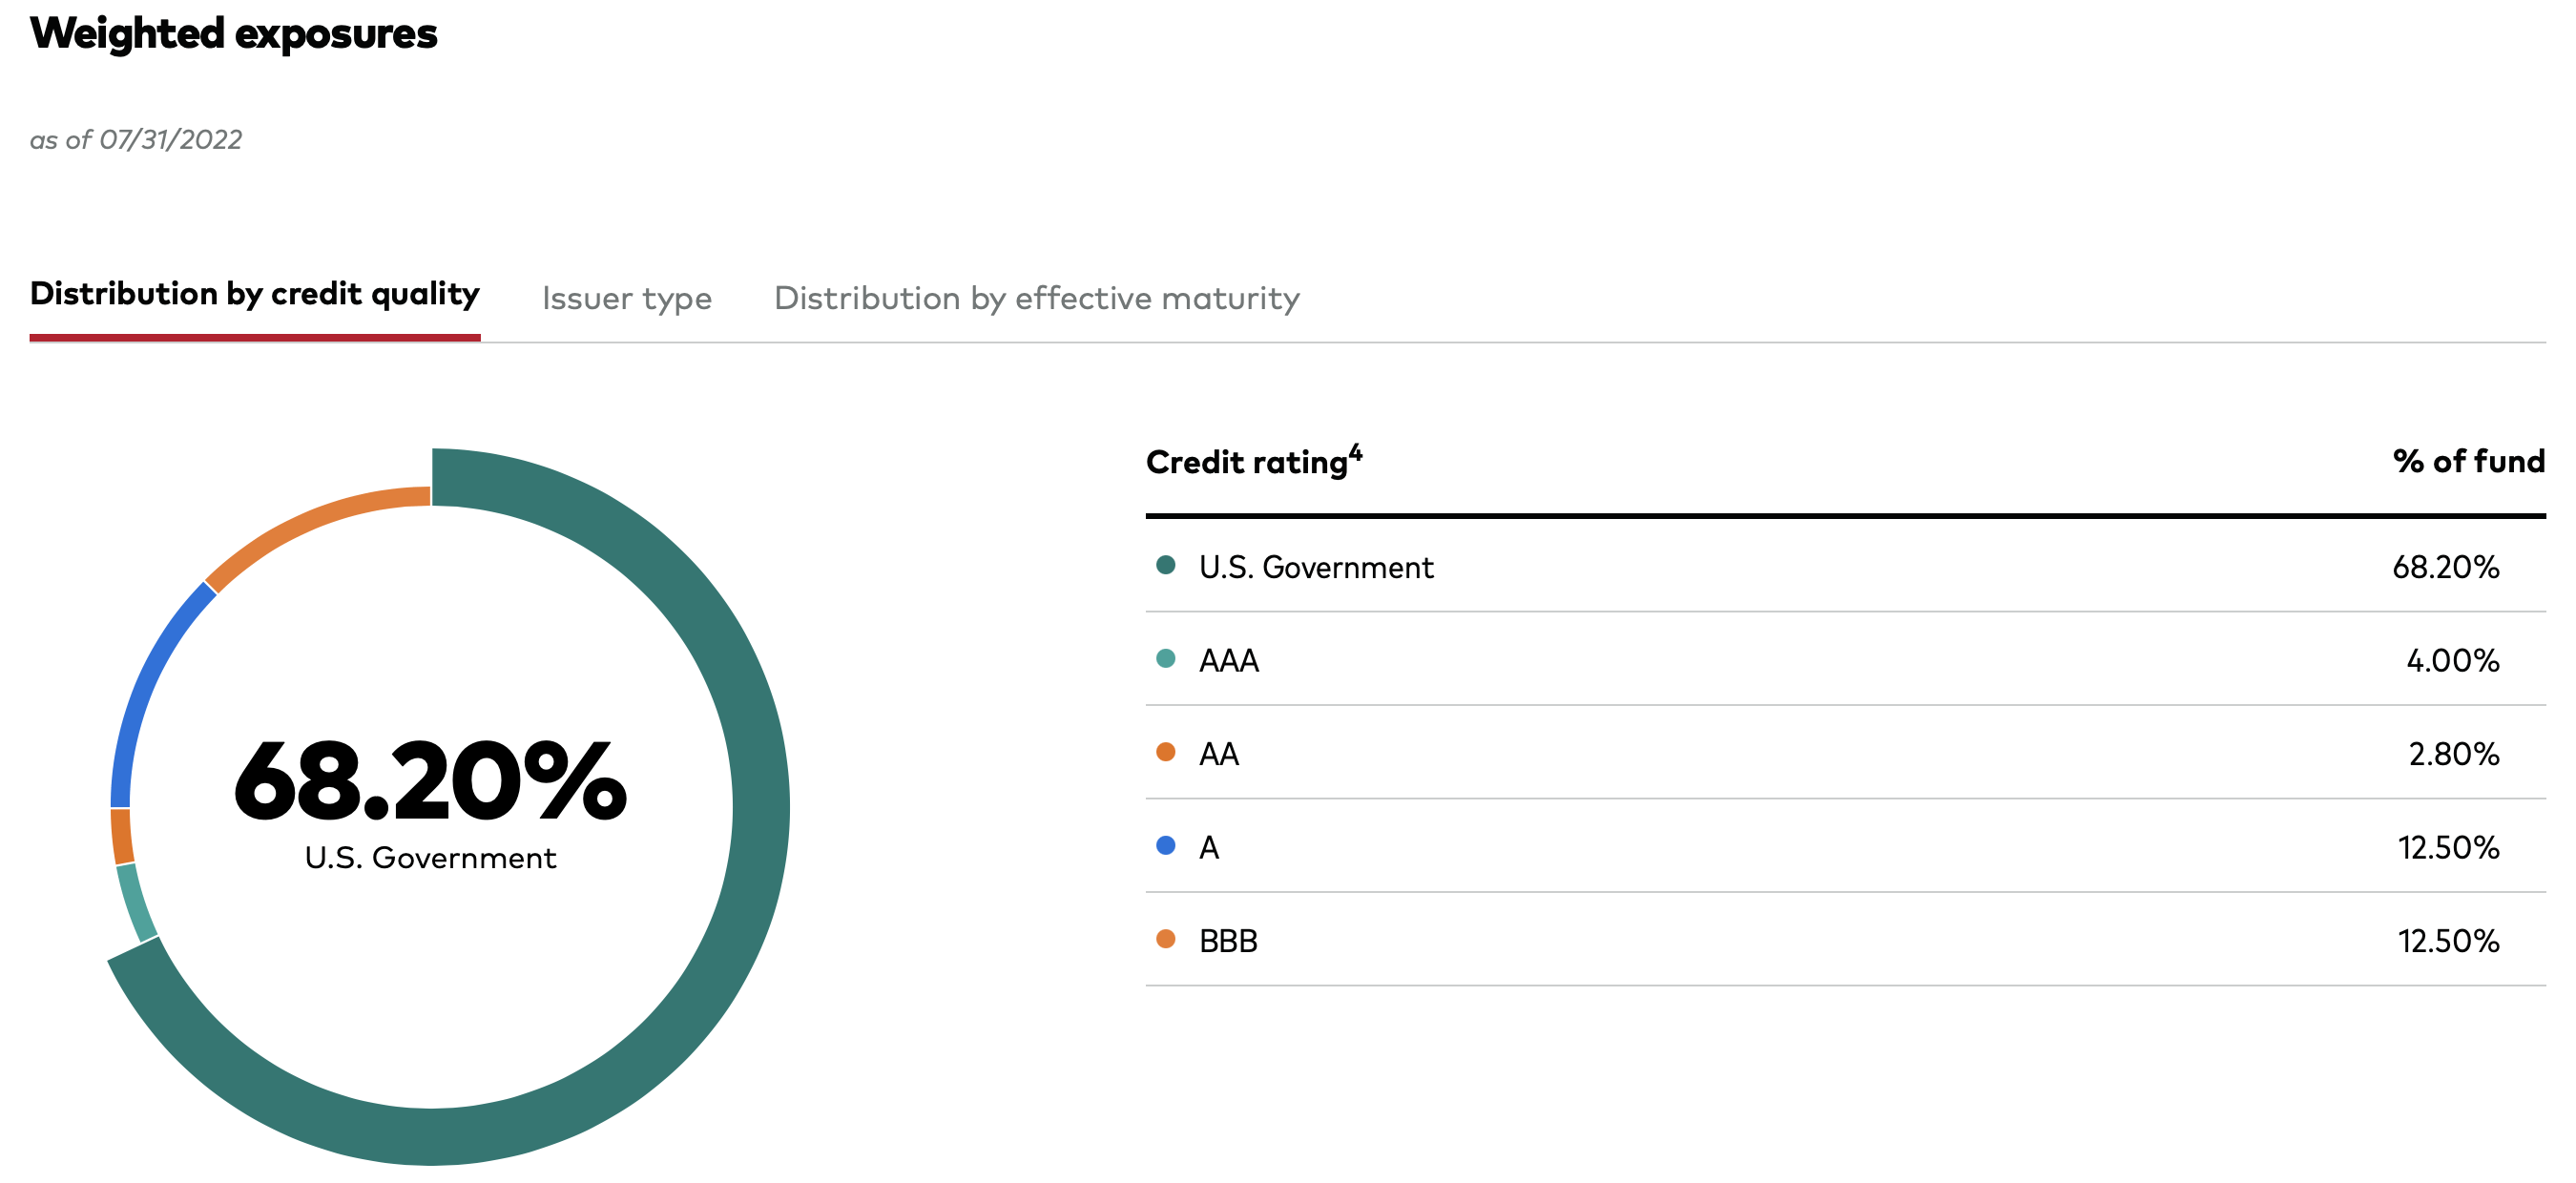
Please note that, in addition to the 68.20% allocation to U.S. government bonds, an additional 4.00% is AAA-rated. This is the highest rating awarded by bond agencies, reserved for the most credit-worthy of companies. Companies currently having this rating include Johnson & Johnson (JNJ) and Microsoft Corporation (MSFT). In total, then, almost 3/4 of the bonds in BSV’s portfolio are AAA-rated or higher.
Second, we turn to effective maturity.
BSV: Distribution By Effective Maturity (Vanguard)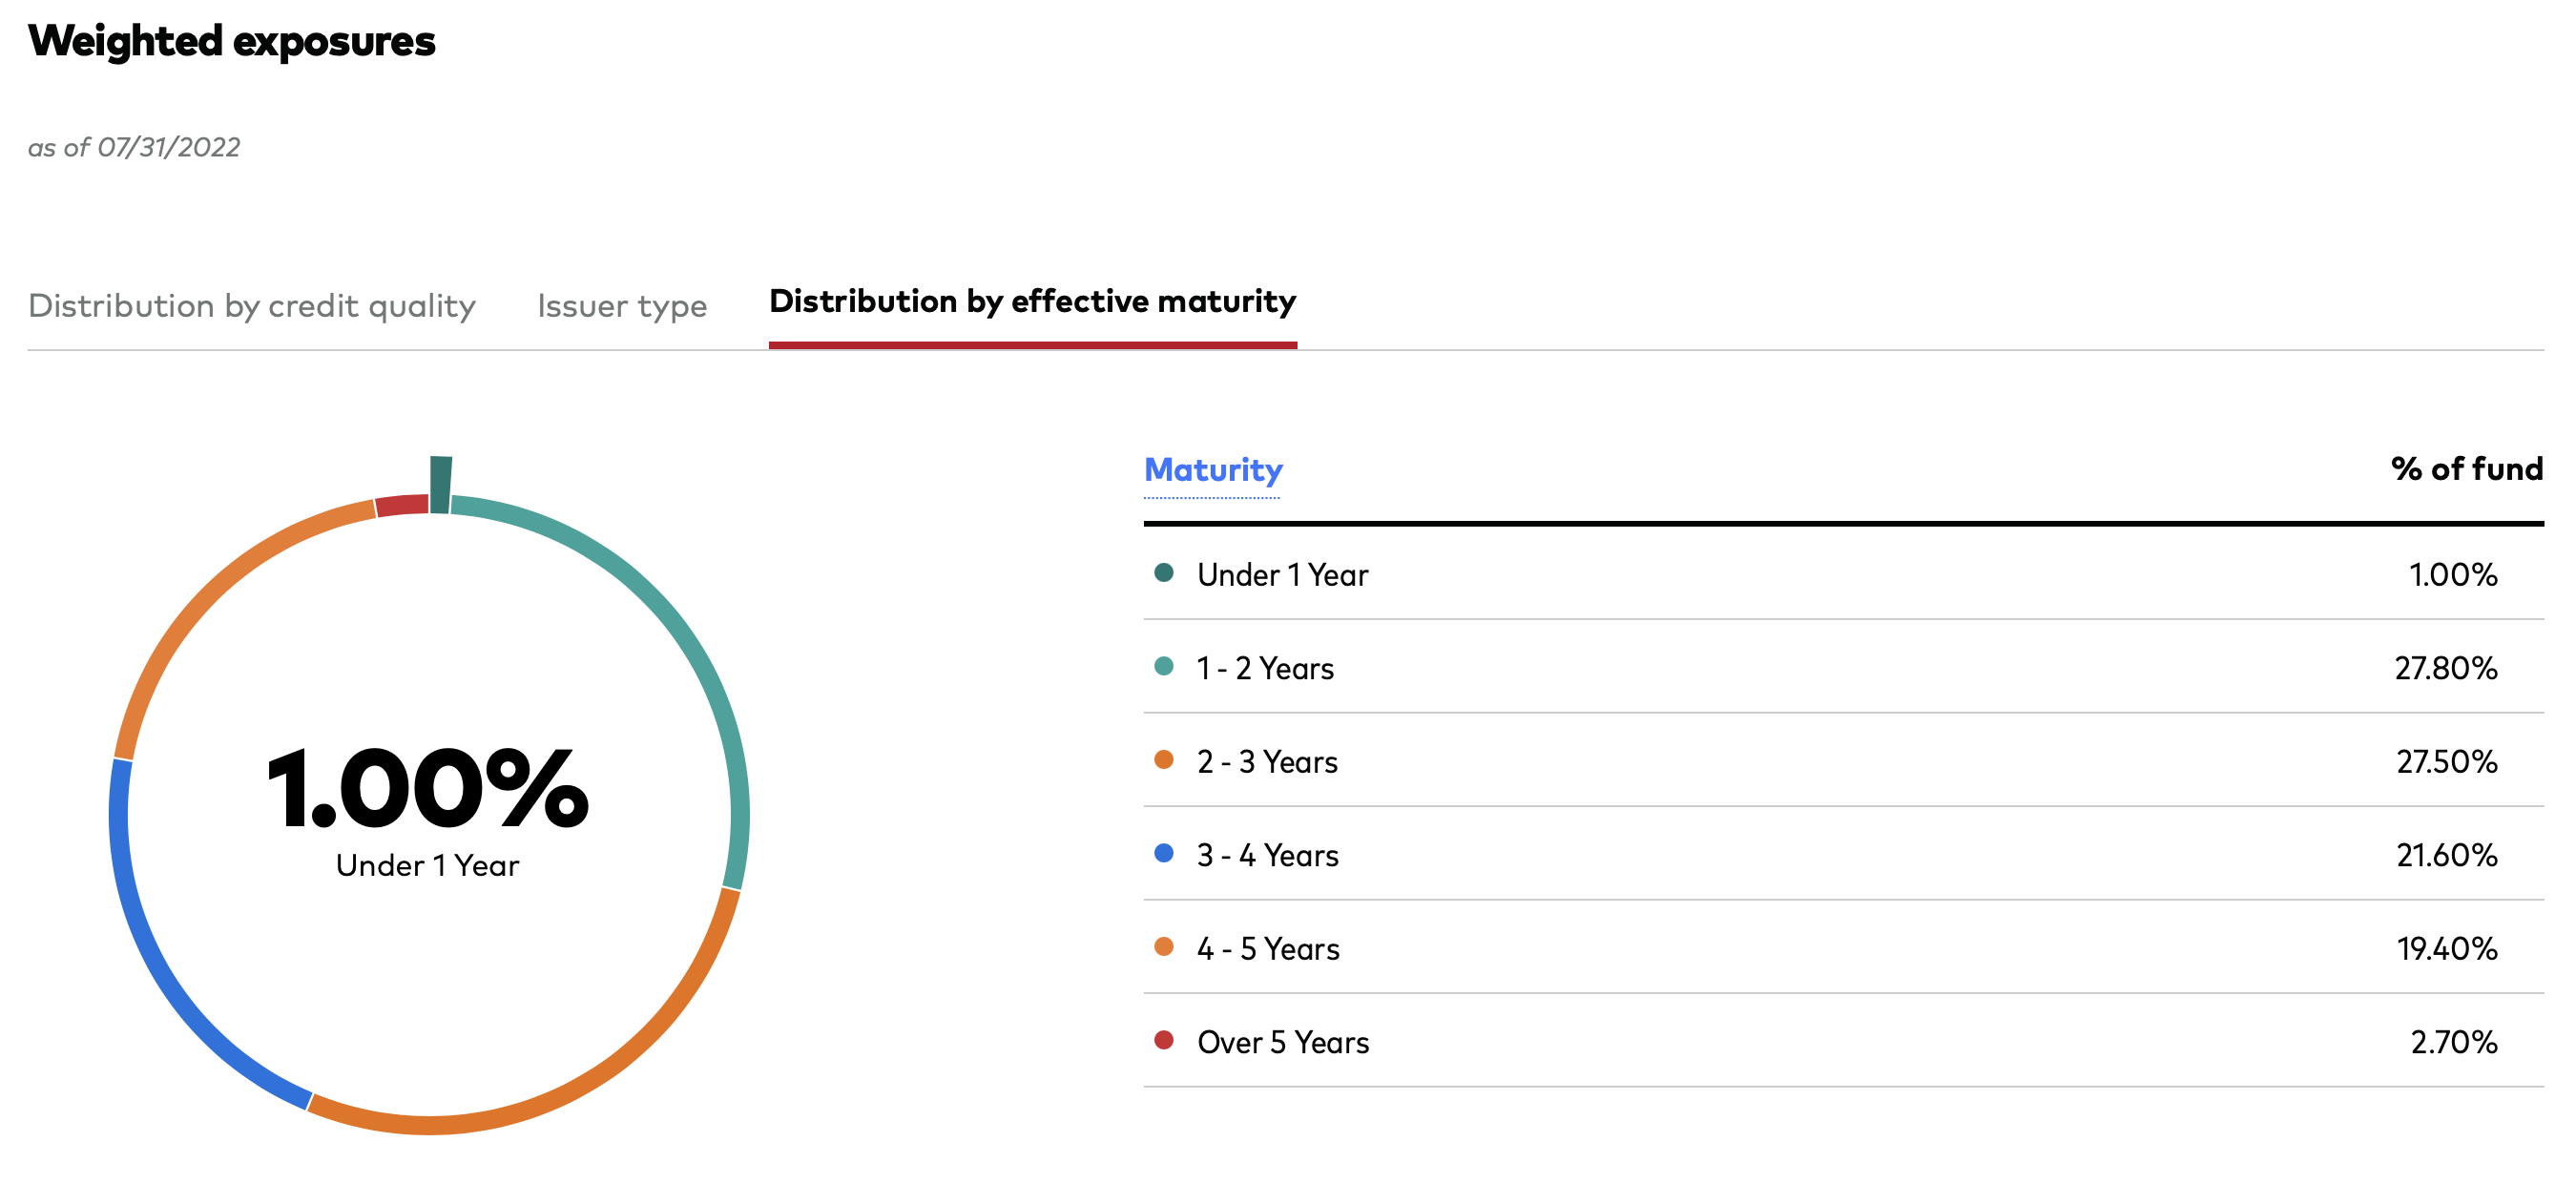
Doing some quick math on the above graphic, we find that over 56% of the fund’s holdings have maturities of less than 3 years or less, increasing to roughly 78% at the 4-year mark.
Why BSV Is The Largest Holding in My Portfolio
As revealed in the title of this article, BSV is not only a core holding but in fact the largest single holding in my personal portfolio. As of my Q2 update, it sat at 14.93% of my portfolio. As of last Friday’s close, it sat even higher, at 15.49%.
Why do I love this particular ETF so much? Simply put, as a recently-retired investor in my early-60s, it fills a very nice spot for me in terms of risk/reward.
Earlier in the article, I featured SHY as an example of a top-flight 1-3 year government bond ETF, and BND as an example of a top-flight total U.S. market bond ETF.
In the graphic below, here is how these 3 ETFs have fared in terms of YTD price change. Please note that this does not include the amount of dividends/interest that has been paid out in cash.
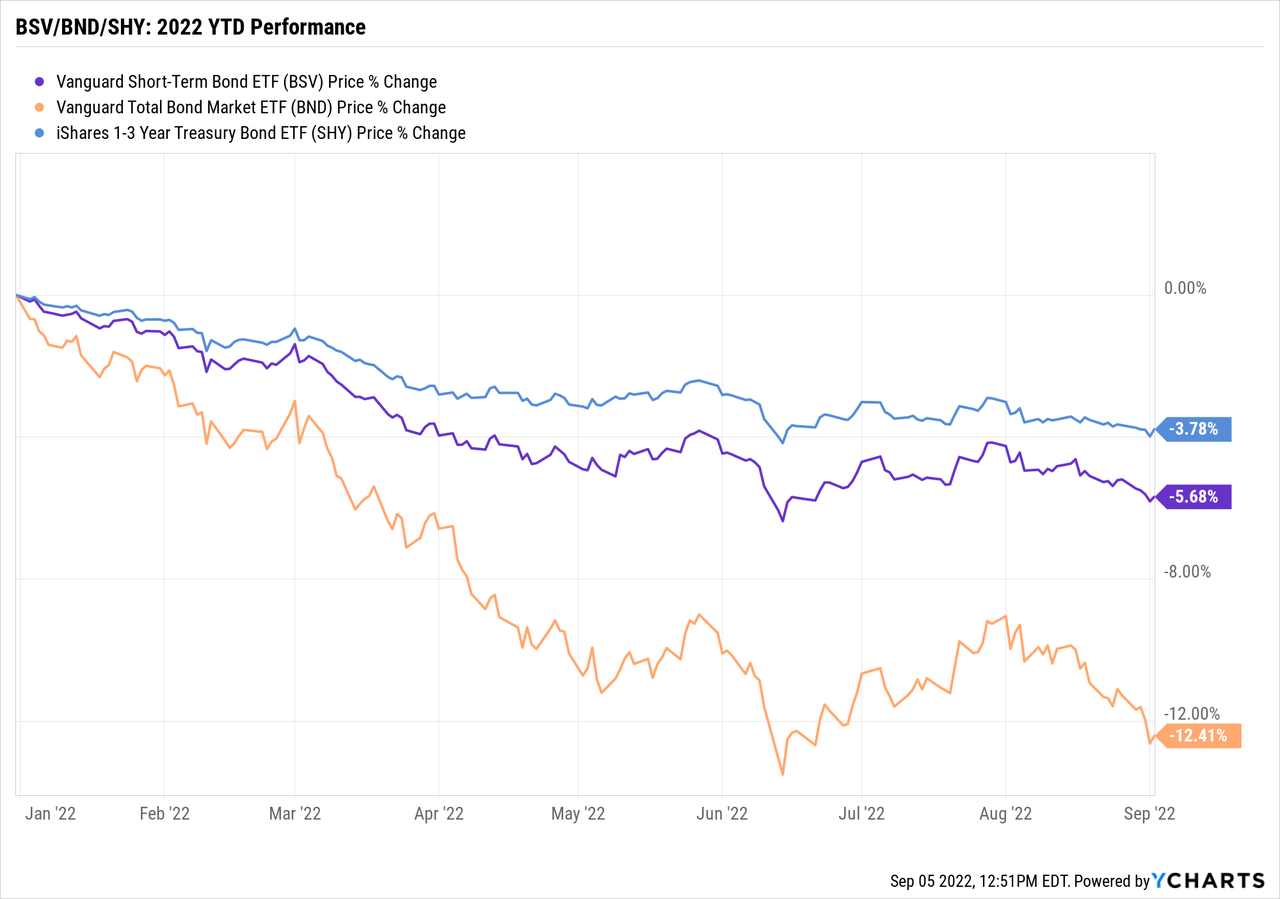
As can quickly be seen, BSV falls in a very interesting place in the risk/reward spectrum. It has experienced roughly 150% of the volatility of SHY year-to-date, but less than half that of BND.
But let’s expand to a much bigger picture. How have these 3 ETFs compared over a much longer term?
For that, let’s look at the results of a roughly 14-year backtest, courtesy of Portfolio Visualizer. In the backtest, all dividends are displayed, and reinvested.
First of all, total returns.
BSV/BND/SHY: 2008-2022 Total Return (PortfolioVisualizer.com)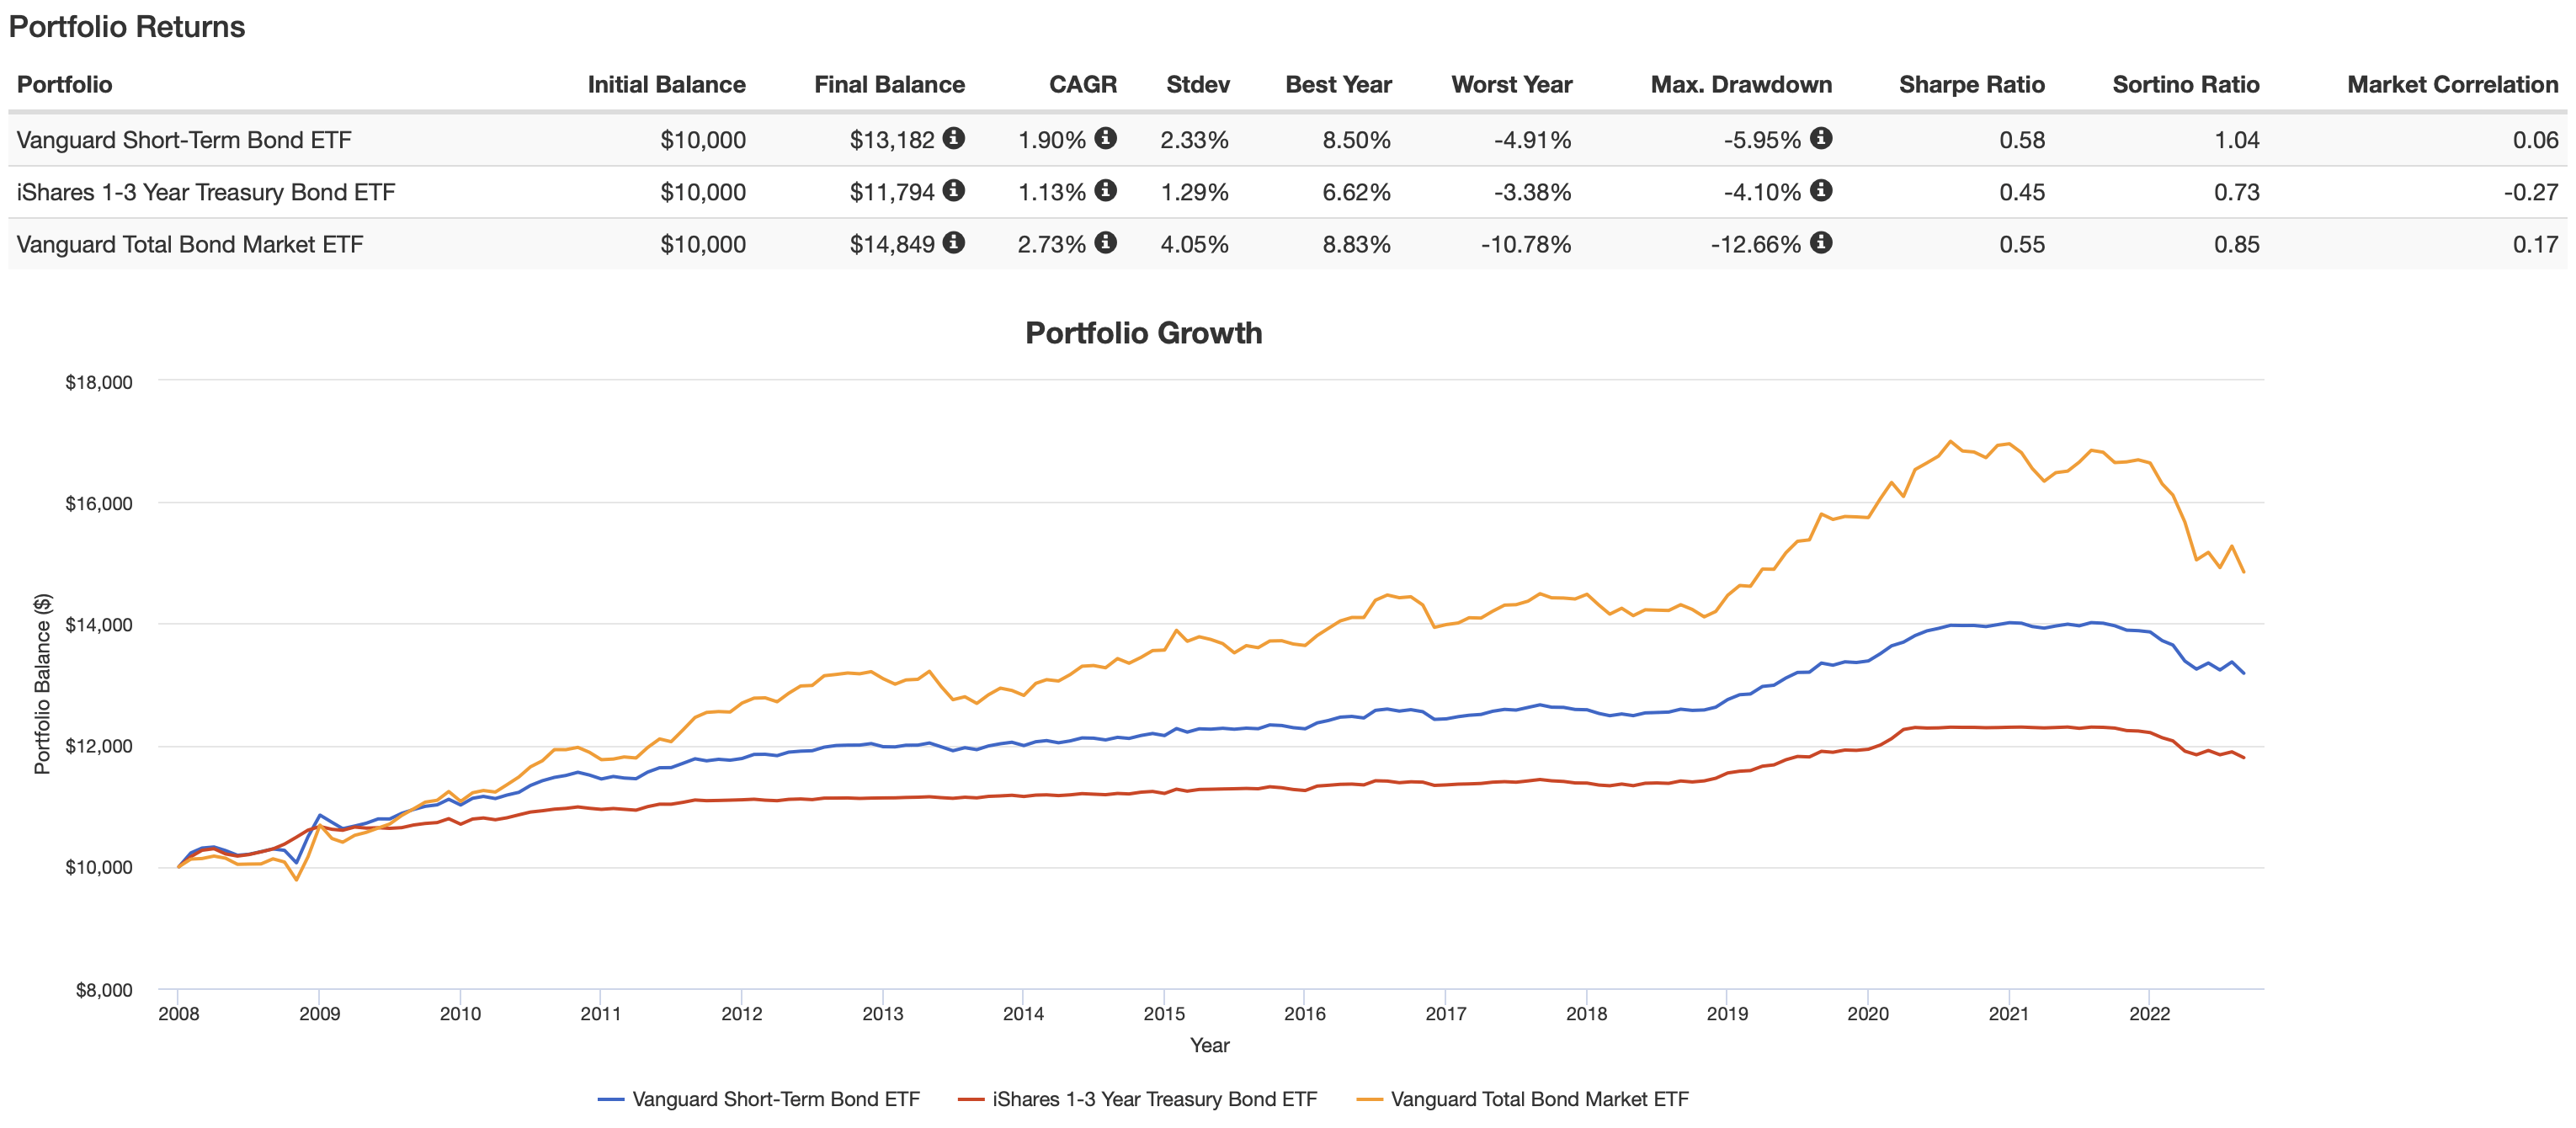
In one quick visual, this reinforces over the longer term where BSV sits in relation to SHY and BND. Interestingly, over this period of time, you might note that BSV has both the highest Sharpe and Sortino ratios. Essentially, the Sharpe ratio represents the overall risk/reward profile, with the Sortino ratio reflecting something similar, but specifically focusing on downside risk.
If I can just feature one data point, it is this. Please notice that BSV’s max drawdown over this 14-year period is only modestly worse than SHY, and far lower than that of BND.
Next, let’s take a quick look at the income generated by all 3 ETFs.
BSV/BND/SHY: 2008-2022 Income (PortfolioVisualizer.com)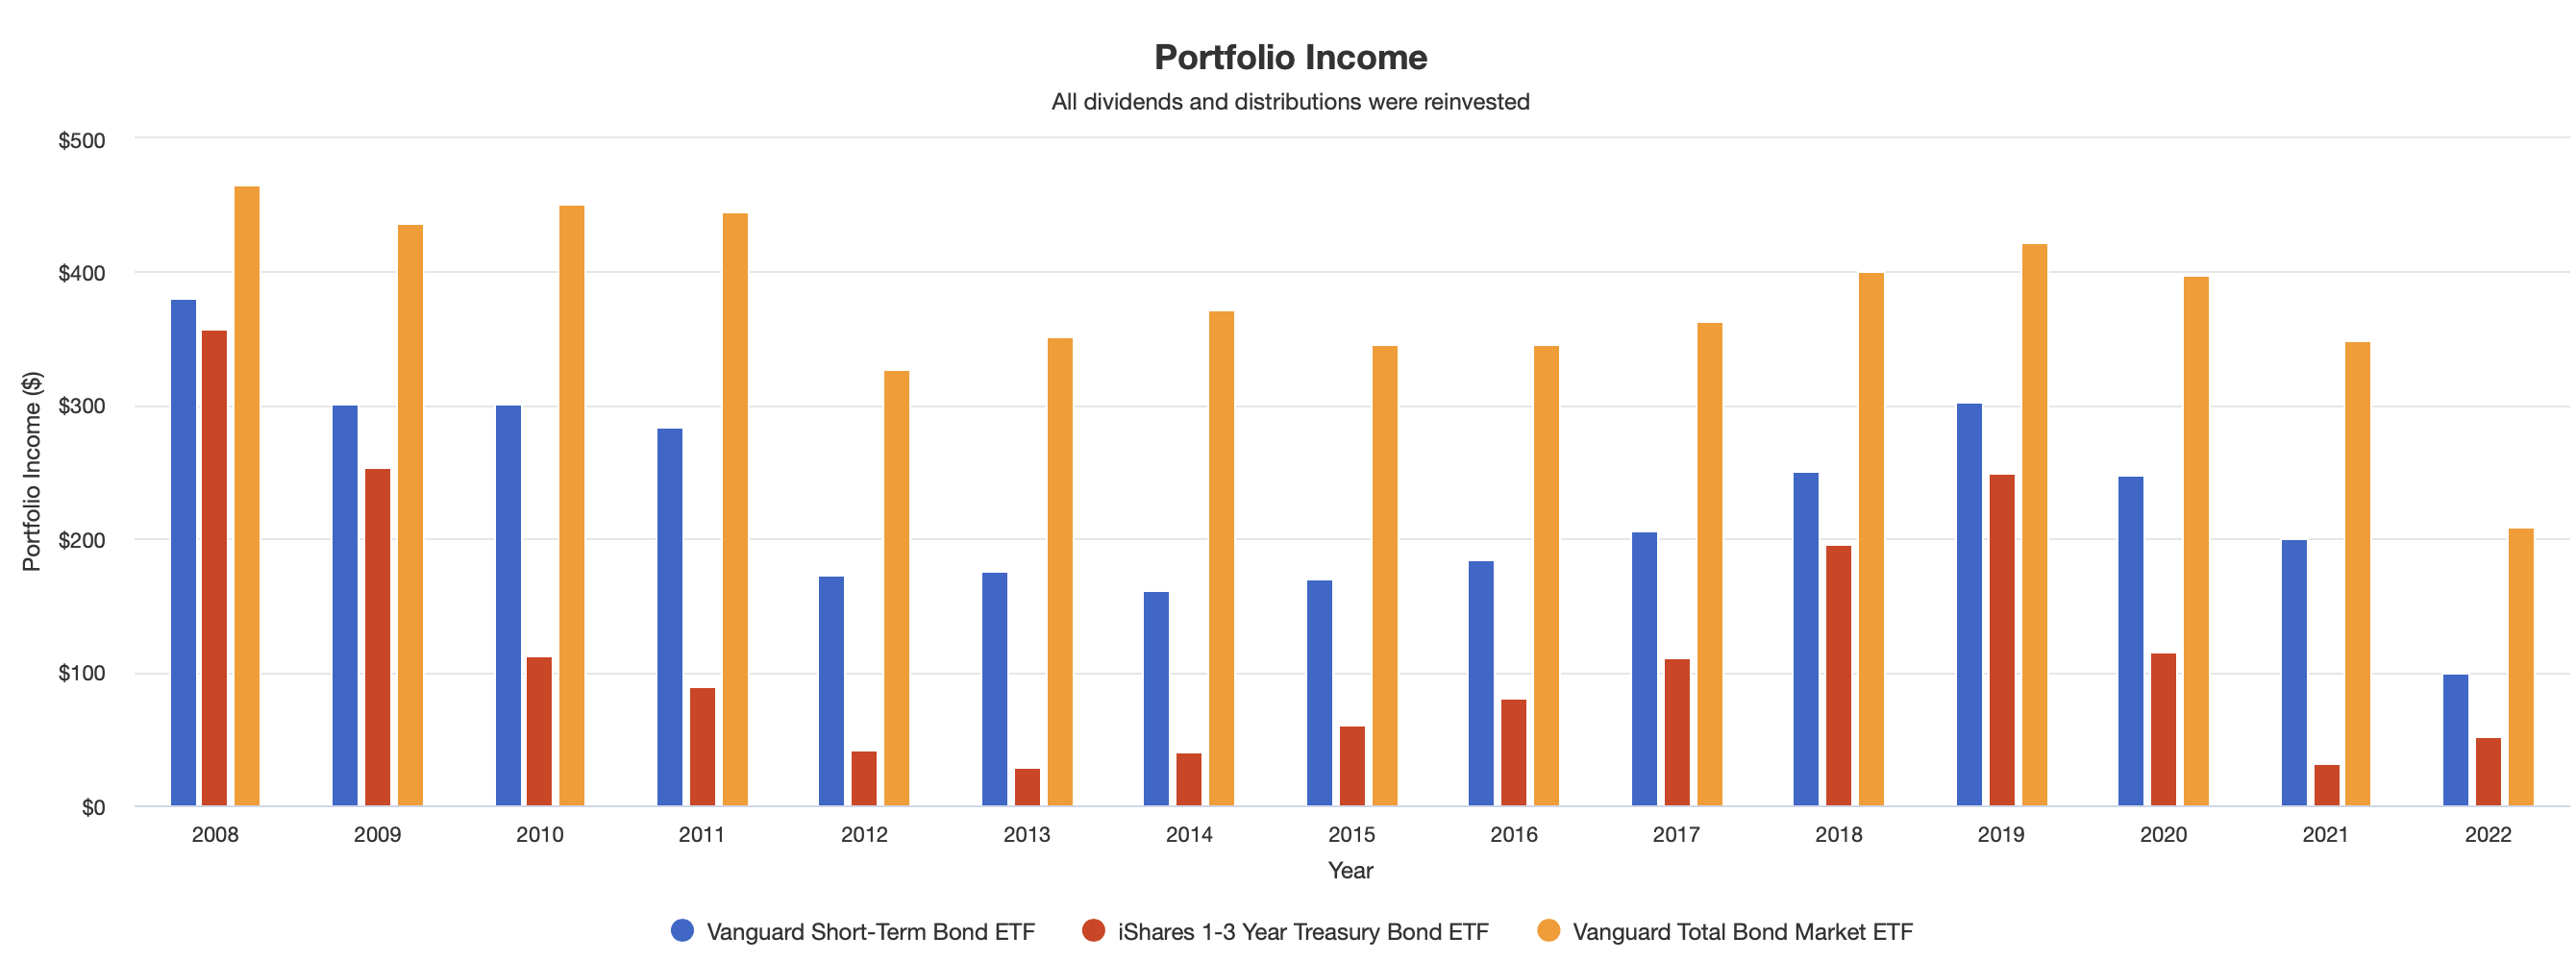
Again, BSV finds, for my money, a very nice “sweet spot.” Yes, there are times where BND is significantly superior, but you will notice that there are others when the two are reasonably close. In contrast, for a slightly elevated level of volatility, the investor is rewarded with a fairly substantial increase in both income and total returns over the more conservative SHY.
Again, for me, that balance falls right about where I like it.
Summary and Outlook
In many of my articles, I call this section “summary and conclusion.” In this case, I decided to include the word “outlook” instead.
Here’s why. At this very interesting time, I am watching very closely the direction of interest rates and the actions of the Fed.
You see, right now my personal weighting is roughly 15% in BSV, 10% in AGG, and 3% in iShares 20+ Year Treasury Bond ETF (TLT). As we get closer to a point where I believe the Fed is done with interest rate increases, I may consider lessening my weighting in BSV in favor of slightly heavier weightings in the other 2 ETFs.
Why? For two reasons. First, to potentially achieve a slightly higher level of income. Second, since the price of bonds moves inversely of interest rates, there might be a point where the potential for capital gains is greater in the longer-term ETFs.
But that’s a discussion for another day. For now, BSV is, and will remain, the largest holding in my portfolio.
Be the first to comment