

Pgiam/iStock via Getty Images
Investment Thesis
This is a comparison-analysis of securities’ prices resulting from investor expectations produced already by careful examinations of economic, competitive, and managerial actions and influences either now under way or yet to come. The focus is on the stock prices, not on the underlying causative minutia well evaluated by those informed and capable of dealing with that level of inputs.
We look to see how actual market price outcomes have followed prior appraisals of the balance between price risks and price reward where that balance in daily comparisons during the past 5 years has been like it is seen now specifically for Bruker Corporation (NASDAQ:BRKR). Issues of forecast credibility, frequency, balance and size in each direction all may have significance in the comparisons with alternative investment candidates having similar competitive circumstances and frequent investor references.
Company description
“Bruker Corporation develops, manufactures, and distributes scientific instruments, and analytical and diagnostic solutions in the United States, Europe, the Asia Pacific, and internationally. It offers life science tools based on magnetic resonance technology; life science mass spectrometry and ion mobility spectrometry solutions; analytical and process analysis instruments and solutions and radiological/nuclear detectors for chemical, biological, radiological, nuclear, and explosive detection. It markets through direct sales forces, distributors, independent sales representatives, and other representatives. Bruker Corporation was incorporated in 1991 and is headquartered in Billerica, Massachusetts.”
Source: Yahoo Finance, Morningstar
The Risk~Reward Balances of Investment Candidates
Figure 1
Yahoo Finance
(used with permission)
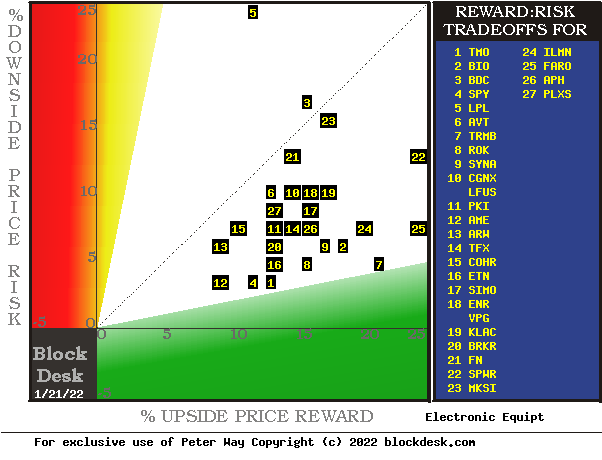
The tradeoffs here are between near-term upside price gains (green horizontal scale) seen worth protecting against by Market-makers with short positions in each of the stocks, and the prior actual price drawdowns experienced during holdings of those stocks (red vertical scale). Both scales are of percent change from zero to 25%.
The intersection of those coordinates by the numbered positions is identified by the stock symbols in the blue field to the right.
The dotted diagonal line marks the points of equal upside price change forecasts derived from Market-Maker [MM] hedging actions and the actual worst-case price drawdowns from positions that could have been taken following prior MM forecasts like today’s.
Our principal interest is in BRKR at location [20]. A “market index” norm of reward~risk tradeoffs is offered by SPDR S&P 500 Trust ETF (SPY) also at [4].
Those forecasts are implied by the self-protective behaviors of MMs who must usually put firm capital at temporary risk to balance buyer and seller interests in helping big-money portfolio managers make volume adjustments to multi-billion-dollar portfolios. Their protective actions define daily the extent of likely expected price changes for thousands of stocks and ETFs.
This map is a good starting point, but it can only cover some of the investment characteristics that often should influence an investor’s choice of where to put his/her capital to work. The table in Figure 2 covers the above considerations and several others.
Comparing Alternative Investments
Figure 2
blockdesk.com
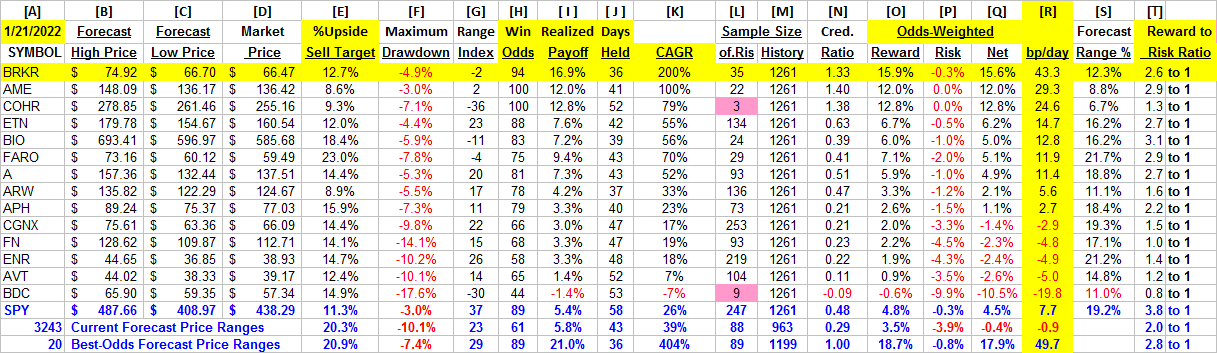
The price-range forecast limits of columns [B] and [C] get defined by MM hedging actions to protect firm capital required to be put at risk of price changes from volume trade orders placed by big-$ “institutional” clients.
[E] measures potential upside risks for MM short positions created to fill such orders, and reward potentials for the buy-side positions so created. Prior forecasts like the present provide a history of relevant price draw-down risks for buyers. The most severe ones actually encountered are in [F], during holding periods in effort to reach [E] gains. Those are where buyers are most likely to accept losses.
[H] tells what proportion of the [L] sample of prior like forecasts have earned gains by either having price reach its [B] target or be above its [D] entry cost at the end of a 3-month max-patience holding period limit. [ I ] gives the net gains-losses of those [L] experiences and [N] suggests how credible [E] may be compared to [ I ].
The historical samples are specific to each stock, at forecast dates of each one’s balance between upside and downside being like that seen today. A minimum number of prior experiences out of the past 5 years’ possible daily forecasts for significance is set at 20. The pink backgrounds of [L] for COHR and BDC warn of their failure now at today’s RI levels.
Further Reward~Risk tradeoffs involve using the [H] odds for gains with the 100 – H loss odds as weights for N-conditioned [E] and for [F], for a combined-return score [Q]. The typical position holding period [J] on [Q] provides a figure of merit [fom] ranking measure [R] useful in portfolio position preferencing. Figure 2 is row-ranked on R among candidate securities, with BRKR in top rank.
Along with the candidate-specific stocks these selection considerations are provided for the averages of near 3500 stocks for which MM price-range forecasts are available today, and 20 of the best-ranked (by fom) of those forecasts, as well as the forecast for S&P500 Index ETF as an equity market proxy.
What makes BRKR most attractive in the group at this point in time is its ability to produce greater than currently forecasted price gains (+12.7%) demonstrated by +12.9% averages 36 times in the past 5 years from prior expected outcomes with the same Range Index balance between upside and downside prospects (RI of -2) of this day. And to achieve those returns on average in only 36 market days, about seven calendar weeks. Done 7+ times in a year, that rate is a CAGR of almost +100%.
The 35 forecasts held 36 market days would be 1260 days, or just 5 years of capital investment commitment at 252 market days per year. At that consistent rate of return the four years would turn $1,000 of capital into over $31,000. Which makes rather powerful history.
Recent Trends in MM Price-Range Forecasts for BRKR
Figure 3
blockdesk.com
(used with permission)
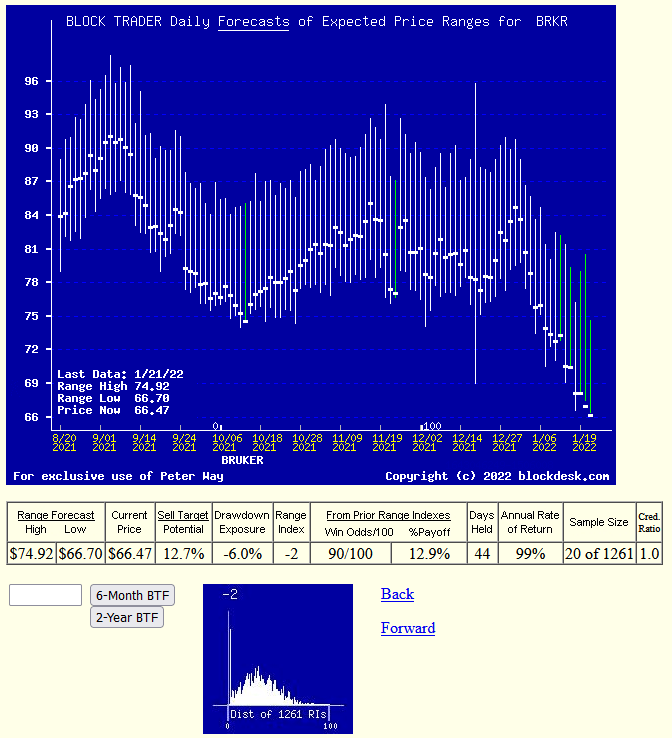
This picture is not a “technical chart” of past prices for BRKR. Instead, it is the past 6 months of daily price range forecasts of market actions yet to come in the next few months. The only past information there is the closing stock price dot on the day of each forecast.
That data splits the price range’s opposite forecasts into upside and downside prospects. Their trends over time provide additional insights into coming potentials, and helps keep perspective on what may be coming.
The small picture at the bottom of Figure 3 is a frequency distribution of the Range Index’s appearance daily during the past 5 years of daily forecasts. The Range Index [RI] tells how much the downside of the forecast range occupies that percentage of the entire range each day, and its frequency suggests what may seem “normal” for that stock, in the expectations of its evaluators’ eyes.
Here the present RI level is at an extremely low level, indicating higher levels (and prices) might realistically be expected. Should that begin to happen, its progress might eventually reach a point where BRKR price is starting to “swim upstream” as a more frequent future event.
Past Prior Profitability of Investment Candidates in Prospect
Figure 4
Yahoo Finance
(used with permission)
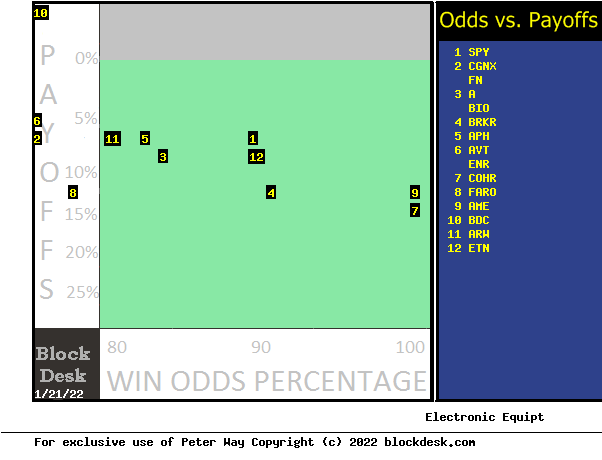
This comparison map uses an orientation similar to that of Figure 1, where the more desirable locations are down and to the right. Instead of price direction, the questions are more qualitative: “how big” and “how likely” are price change expectations now?
Our primary interest is in BRKR’s qualitative performance, particularly relative to alternative investment candidate choices. Here BRKR is at location [4], the intersection of horizontal and vertical scales of +13% gain and +90% assurance (odds of a “win”).
As a market norm, SPY is at location [1] with a +5% payoff and an 89% assurance of profitability. BRKR tends to dominate all the qualified others in this comparison.
Conclusion
Among these alternative investments explicitly compared, Bruker Corporation appears to be a logical buy preference for investors seeking near-term capital gain.
Be the first to comment