

BRENT CRUDE OIL (LCOc1) TALKING POINTS
- Greenback and demand-side factors weigh on crude oil.
- Biden visits Middle East.
- Possible bull flag emerging on daily chart.
BRENT CRUDE OIL FUNDAMENTAL BACKDROP
Brent crude oil remains depressed after yesterdays hot U.S. inflation print and an increase in stockpiles via the weekly EIA inventory report. The inflation print deepened the spread between the 2-year and 10-year U.S. Treasury yields thus increasing the curve inversion and heightening recessionary risks. Chinese trade data also highlighted a slump in oil imports averaging 8.75MMbbls/d and augmenting the demand destruction narrative plaguing global markets. The COVID-19 situation in China does not show signs of improvement and should extend this narrative despite OPEC’s monthly report suggesting an increase in demand as we head into the end of 2022 and early 2023. The IEA shares similar sentiments with the increased demand however they have revised their previous outlook slightly lower.
Supply fundamentals do provide some support for crude oil prices with Libyan politics in turmoil and the inability from OPEC+ to meet current quotas let alone the revised higher projected output levels. President Joe Biden will also visit the Middle East to discuss an increase in supply from OPEC and ease inflationary pressures on consumers. His last visit was ineffective so I do not foresee much change this time around. The U.S. dollar continues to be a thorn in the side of crude oil as we look forward to PMI data later today for further guidance but with the 100bps Fed rate hike gaining traction, it is unlikely the dollar will let up anytime soon.
ECONOMIC CALENDAR
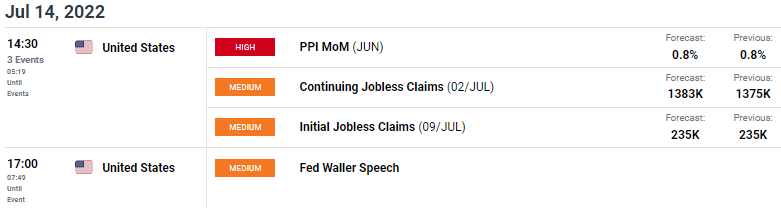
Source: DailyFX Economic Calendar
Learn more about Crude Oil Trading Strategies and Tips in our newly revamped Commodities Module!
TECHNICAL ANALYSIS
BRENT CRUDE (LCOc1) DAILY CHART
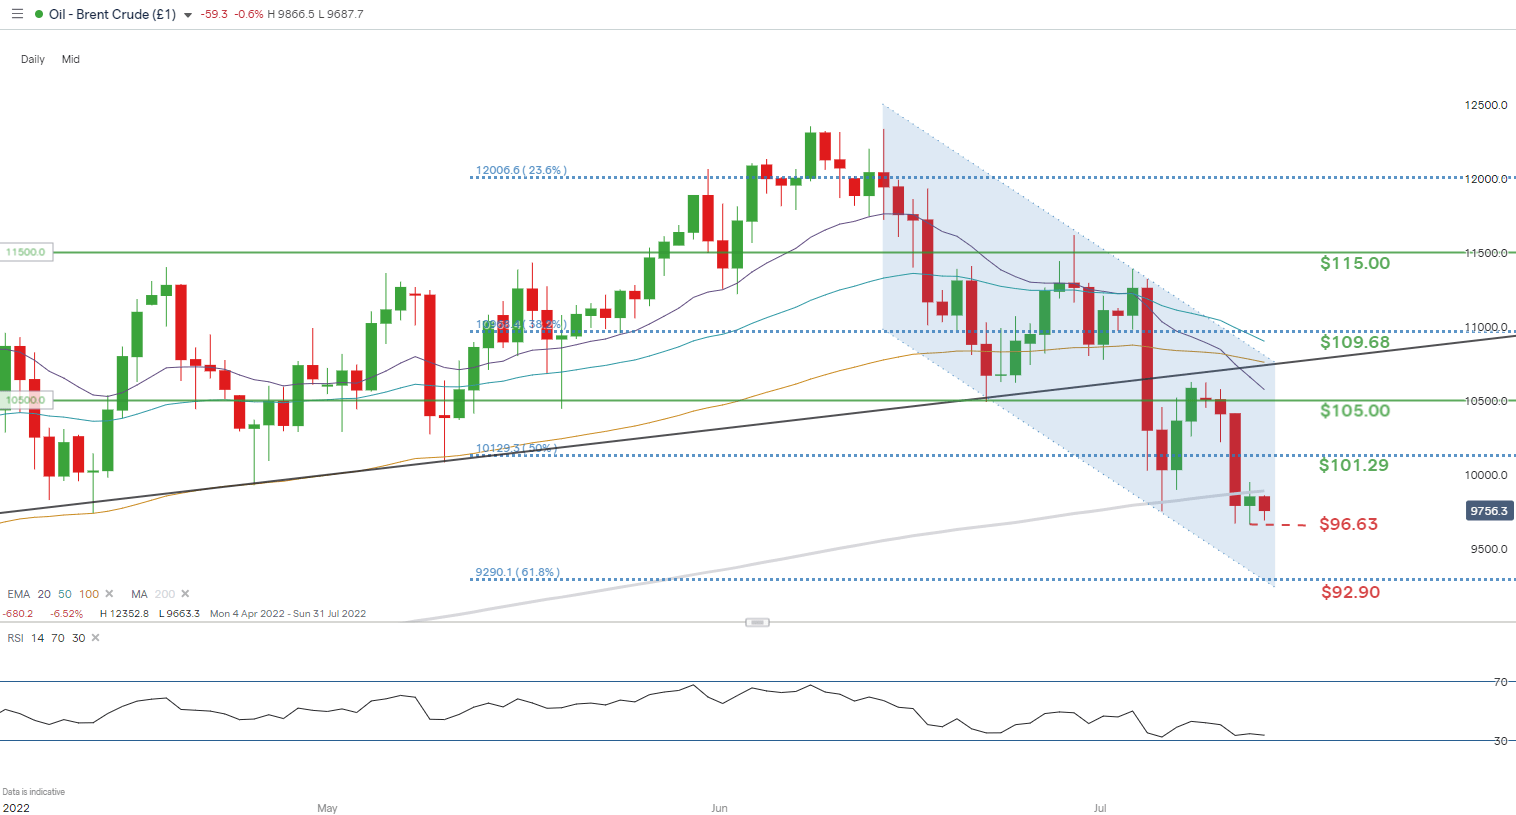
Chart prepared by Warren Venketas, IG
Price action on the daily brent crude chart shows prices trading within what may be a bull flag (blue) chart pattern. Traditionally, the bull flag points to a pullback before an upside continuation but this will only be confirmed should prices break above flag resistance.
The Relative Strength Index (RSI), is nearing oversold territory which may expand on the aforementioned bull flag implication but a push below flag support will invalidate this move short-term.
Key resistance levels:
Key support levels:
IG CLIENT SENTIMENT: MIXED
IGCS shows retail traders are NET LONG onCrude Oil, with 65% of traders currently holding long positions (as of this writing). At DailyFX we typically take a contrarian view to crowd sentiment however, after recent changes in positioning we settle on a short-term cautious bias.
Contact and follow Warren on Twitter: @WVenketas
Be the first to comment