

DNY59
It is natural for investors to think a bottom will be formed every time there is a rebound in a bear market. These expectations are fueled by wishful thinking after one of the worst years in the equity and fixed-income markets.
The S&P 500 (SPX) index is down 20.6% year-to-date and 21.1% off all-time highs.
Daily S&P 500 Chart With Year-to-Date Return and Drawdown Profile (Price Action Lab Blog – Norgate Data)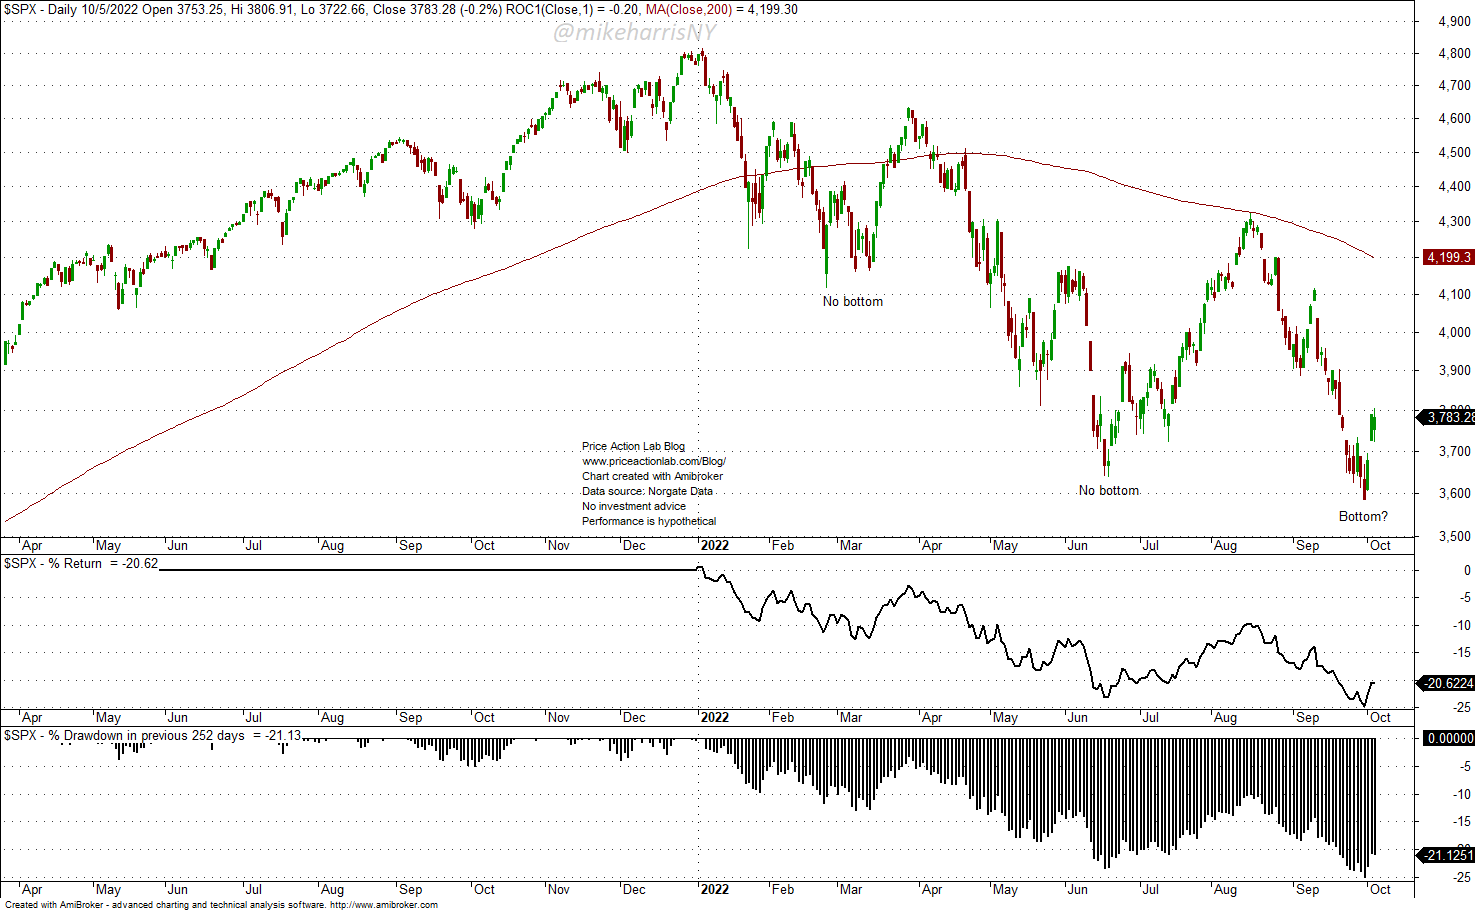
Investors were hoping for a bottom as early as March and then in June. A rebound started this week after the new lows of last week. The 60/40 portfolio in SPY (SPY) and AGG (AGG) ETFs is down 17.4% year-to-date, and this is the worst performance since a 19% loss in 2008.
Yearly Returns of 60/40 Portfolio in SPY and AGG ETFs with Annual Rebalancing (Price Action Lab Blog – Norgate Data)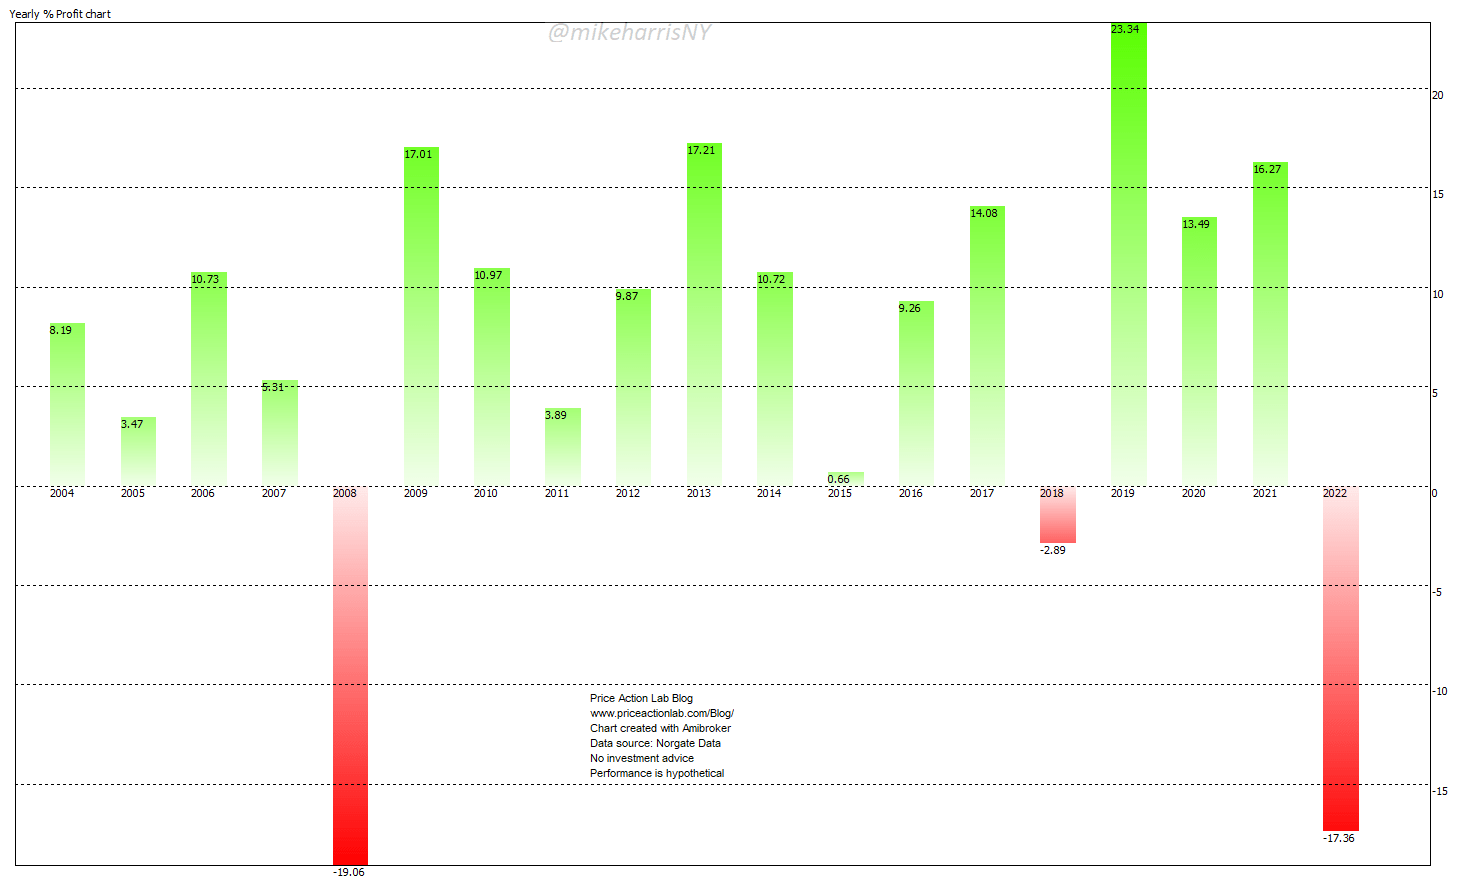
Is a bottom possible after the rebound this week? Let us take a look at the main drivers of this rally. Below is a table of the performance of 11-sector ETFs.
Performance of 11 Sector ETFs (Price Action Lab Blog – Norgate Data)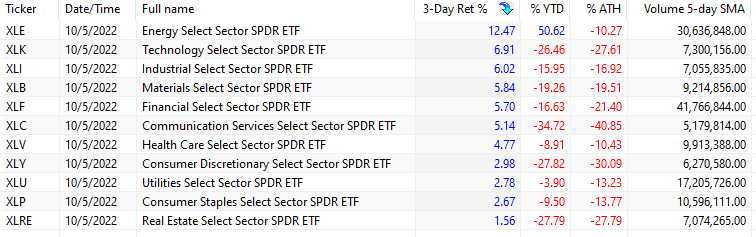
The major beneficiary amid the rebound was the energy sector, with the XLE ETF (XLE) up 12.5% in the first three days of the week (Oct. 3-Oct. 5). The second highest return was for the technology ETF (XLK) at 6.9%.
We could claim that the rebound was driven by the energy sector after rumors of pending OPEC+ cuts that materialized this week. These rumors, combined with minor rate hikes by some central banks, created a euphoric environment for US equities, resulting in a 5.6% gain for the S&P 500 in the first three days of the week.
With crude oil rising, the chances of a material drop in CPI are small. The US administration announced additional releases from the Strategic Petroleum Reserve a few days after declaring the end in reaction to the decision of OPEC+ to cut production.
The CRB index is heavily weighted in energy. As may be seen from the composition below, energy has 39% weight.
Composition of CRB Index (Refinitiv.com)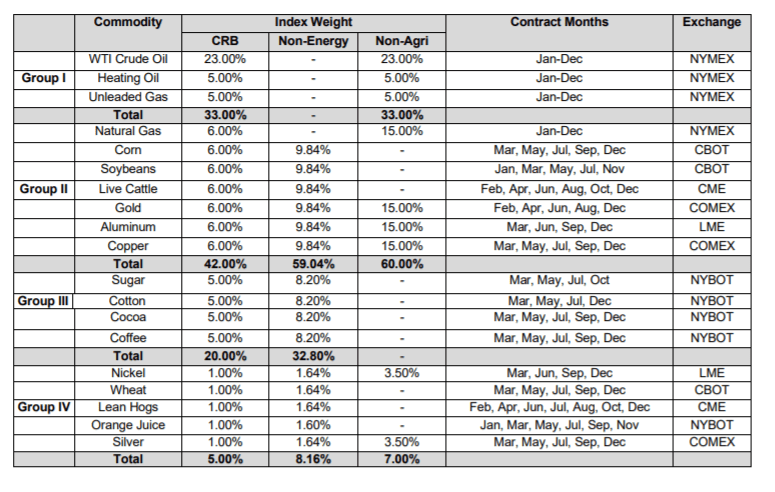
Group I has a 33% weight in the CRB index. The weight of natural gas is 6%, for a total of 39% for energy. The weight of crude oil is 23%, while no other commodity has a weight greater than 6%.
The 0-lag, 252-day correlation of the CRB index with crude oil (West Texas Intermediate) has been high, with an average value of 0.77.
0-Lag, 252-Correlation of CRB Index and Spot Crude Oil (Price Action Lab Blog – Norgate Data)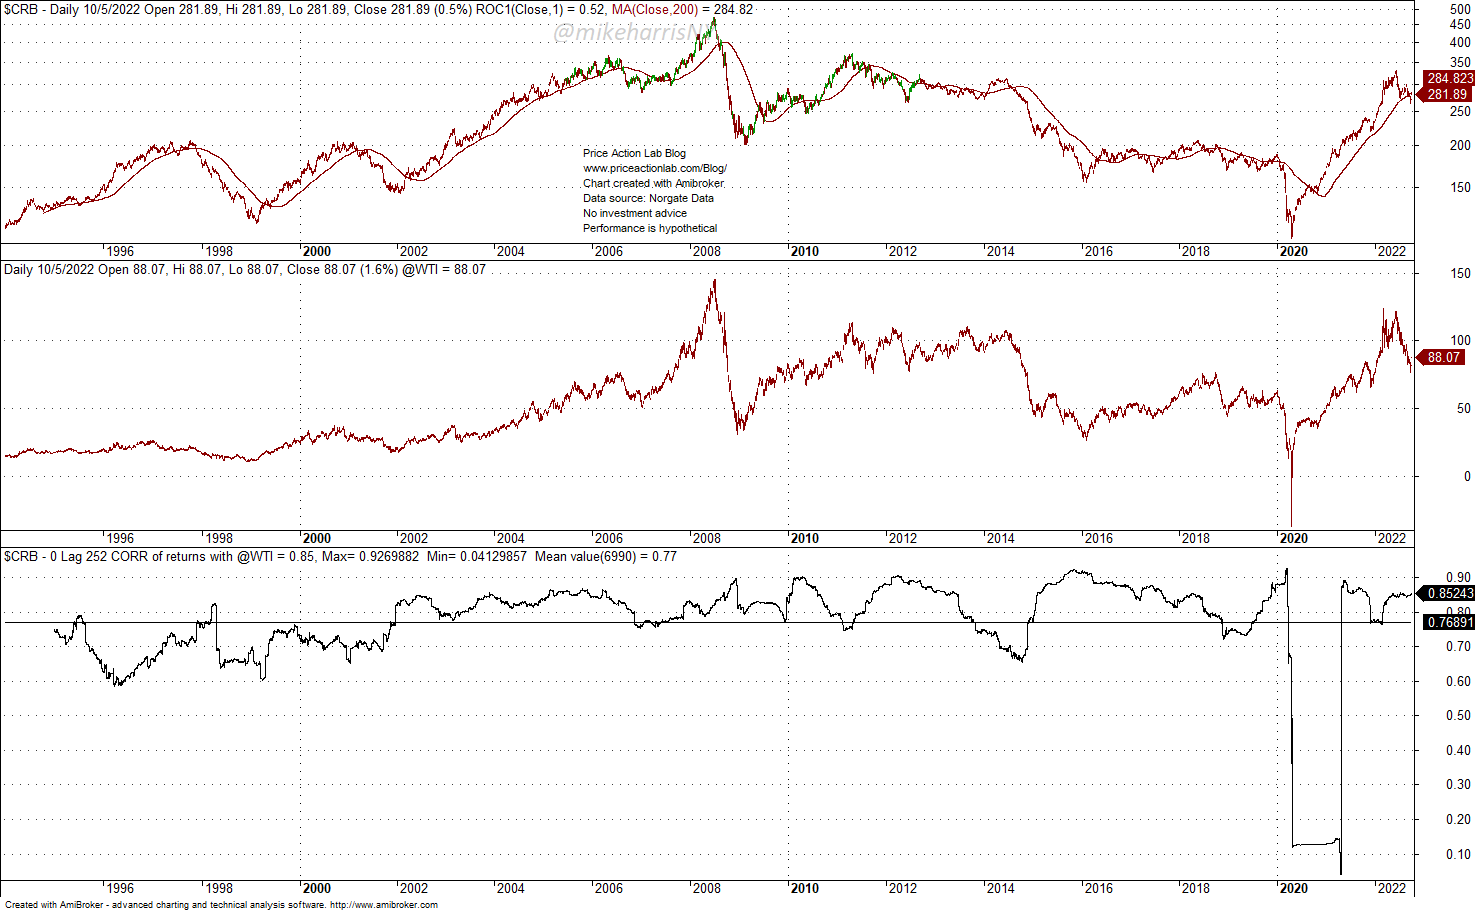
The above correlation is the reason the Administration is concentrating on crude oil prices and reserve releases. The other commodities have a minor impact on the CRB index.
Yet, in the last three days of the US stock market rebound, we saw gasoline jump 12% and crude oil surge 10%. Below is a table of the four top-performing commodities ETFs in the first three days of this week.
Top Four Performing Commodity ETFs Oct. 3 – Oct. 5, 2022 (Price Action Lab Blog – Norgate Data)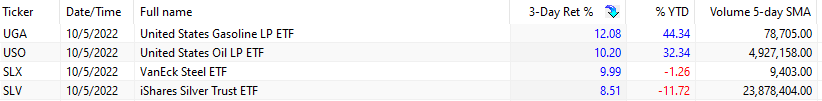
As a result of the energy-driven rebound, the top-performing stocks in S&P 500 index were mostly from the energy sector. Below is a list of the top 12.
Top 12 Performing S&P 500 Stocks, Oct. 3 to Oct 5, 2022 (Price Action Lab Blog – Norgate Data)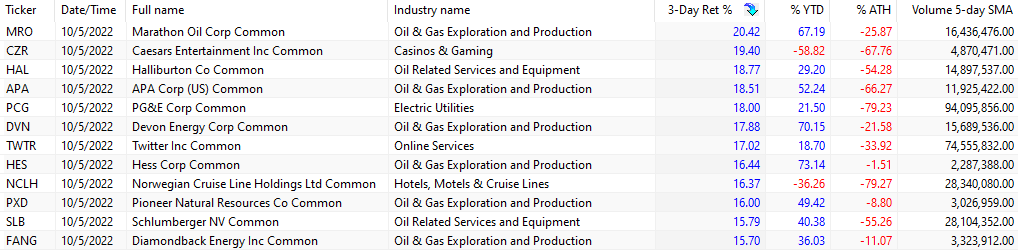
Of the 12 top S&P 500 stocks, 9 were from the energy sector. Under these conditions, a bottom should not be expected at this time. We need to see a broad-based rally with top-performing stocks from several other sectors, especially technology.
Conclusion
There are no conditions for a bear market bottom yet since the main drivers of the rally this week have been the energy sector and the decision of some central banks to slow rate hikes that do not affect the Fed’s decisions.
The top-performing stocks in the S&P 500 were mostly from the energy sector, and major commodity ETFs surged at the same time.
Major bottoms usually do not occur when everyone is expecting them. This year we have heard repeated calls for a bottom in March and then in June, only to be followed by new lows.
At some point, there will be a bottom and some analysts will be correct, but most bulls will have turned to bears before that happens.
Energy prices will probably be the major factor that impacts monetary policy and inflation. In my opinion, even GDP growth and employment do not influence rate decisions much. Even in a recession, the Fed may continue to raise rates if inflation persists. Calls for a bottom are premature.
Be the first to comment