

JHVEPhoto/iStock Editorial via Getty Images
Introduction
You may recall that I previously wrote on the Boston Pizza Royalties Income Fund (TSX:BPF.UN:CA) in July 2022. One of my arguments for holding the stock was as an inflation hedge as follows:
One of the most enticing aspects of BPF from an inflation standpoint is that royalty and distribution income are not directly impacted by the underlying profitability of BPI, as the income is entirely based on the licensing fees paid by the franchisees and incurs very low administrative expenses. As inflation reaches its highest levels in decades, we should expect franchises to charge higher prices, which will mean more off the top for the fund.
Source: Boston Pizza: The Time Is Now
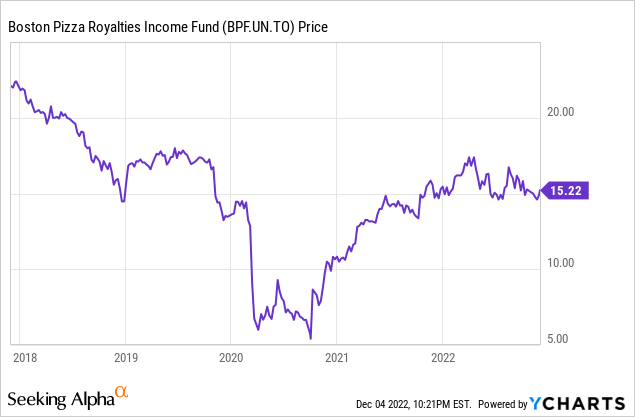
The royalty fund still has to trade at its 2019 levels. The market has never been too happy with the fund being a little ambitious with its distribution, which pre-pandemic was often more than 100% of its distributable cash. The likely reason for this is because the portion of the royalties from the gross restaurant sales are designated as distribution income on the fund’s financial statements and gross sales are driven by the amount of restaurants in the “pool” as of January 1 of the fiscal year. Therefore, any additional store opening would be included in the royalty pool the following year and cash available for distribution should catch up to distributable income the following year, especially with 5-11 stores opening annually.

Financial Highlights (Q4 2019 MD&A)
This strategy fell apart when COVID hit. Not only did were franchisees granted deferral of the royalty payments owed for sales but 8 stores actually closed in 2020 which put expected cash available for distribution well below the $0.102/monthly distribution per share. BPF suspended the distribution at the onset of COVID, but the suspension of the distribution was short-lived and the fund reimplemented the distribution in September 2020 with a $0.065/share monthly distribution which tested the limits of what their distributable cash and liquidity could handle from that point on.
Until now.
You may recall from my previous article that I argued the amendments to the credit agreements should put their payout ratio below 100%.
BPF and BPI announced as of June 28, 2022 that they had entered into a second supplemental credit agreement to amend and extend the credit facility to July 1st, 2026. BPF also entered into an agreement with its operating bank to amend and extend the credit facility to July 1st, 2022. The terms and conditions are similar to the agreement in place prior to COVID. BPF will only have to repay $0.5MM per quarter to BPI instead of $1MM and will repay $0.3MM per quarter less on its bank facilities.
As a result of the decreases in debt repayment associated with the credit facilities, same-store sales do not have to rise by much for BPF to easily cover the monthly distribution at $0.085/share.
Source: Boston Pizza: The Time Is Now
Q3-2022 Results
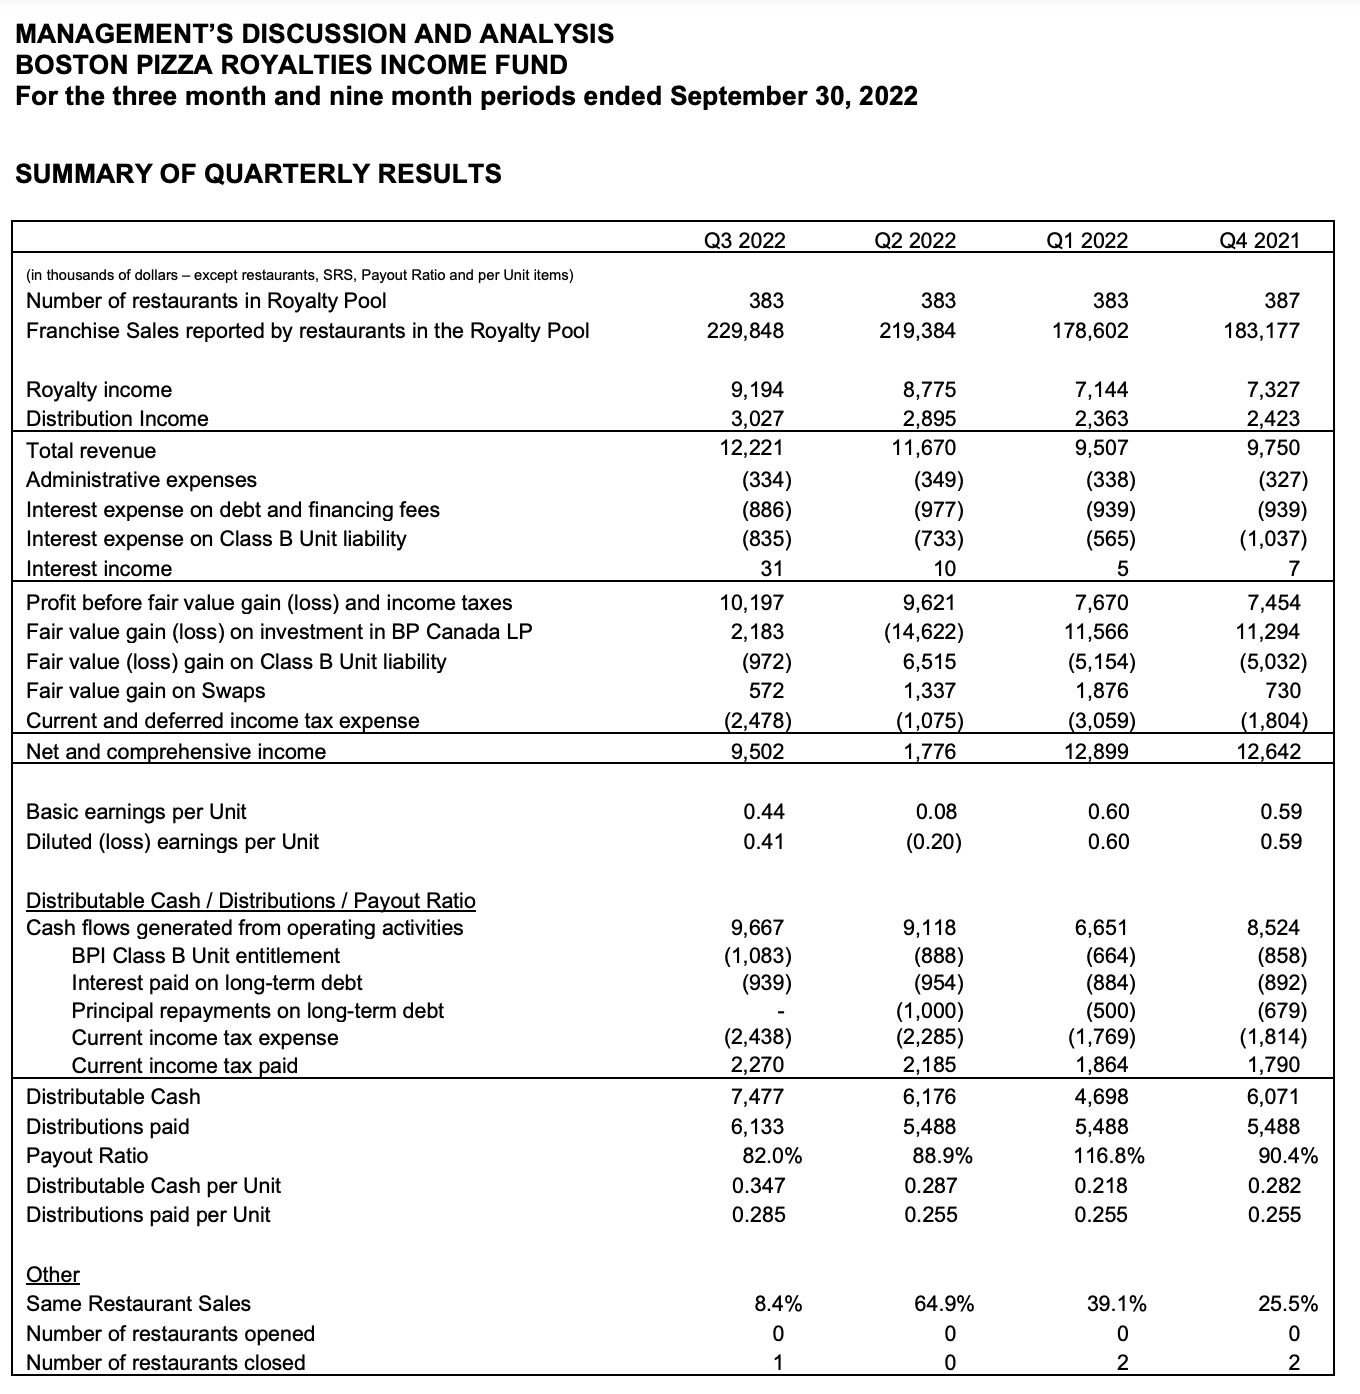
The Q3-2022 results delivered exactly as expected with same restaurant sales (SRS) being up ~8% from Q3-2021, which is in line with inflation. This is despite operating with three less stores, which goes to show price increases have not come at the cost of additional sales. The Fund believes that it is also useful to calculate and report SRS comparing 2022 Franchise Sales to 2019 Franchise Sales. If SRS were calculated comparing Franchise Sales in the Period and YTD to Franchise Sales in the same periods in 2019, SRS would be up 7.4% and 0.7%, respectively.
More importantly we see the payout ratio came in at 82% for the quarter and the fund is on pace to have distributable cash actually exceed distributions paid for fiscal 2022. This is inclusive of a 17% increase to the monthly distribution which is now at $0.10/share and just 2% shy of its pre-covid level. This has also been aided by the reduction in long-term debt repayable for the rest of the year which saves $1 Million per quarter.
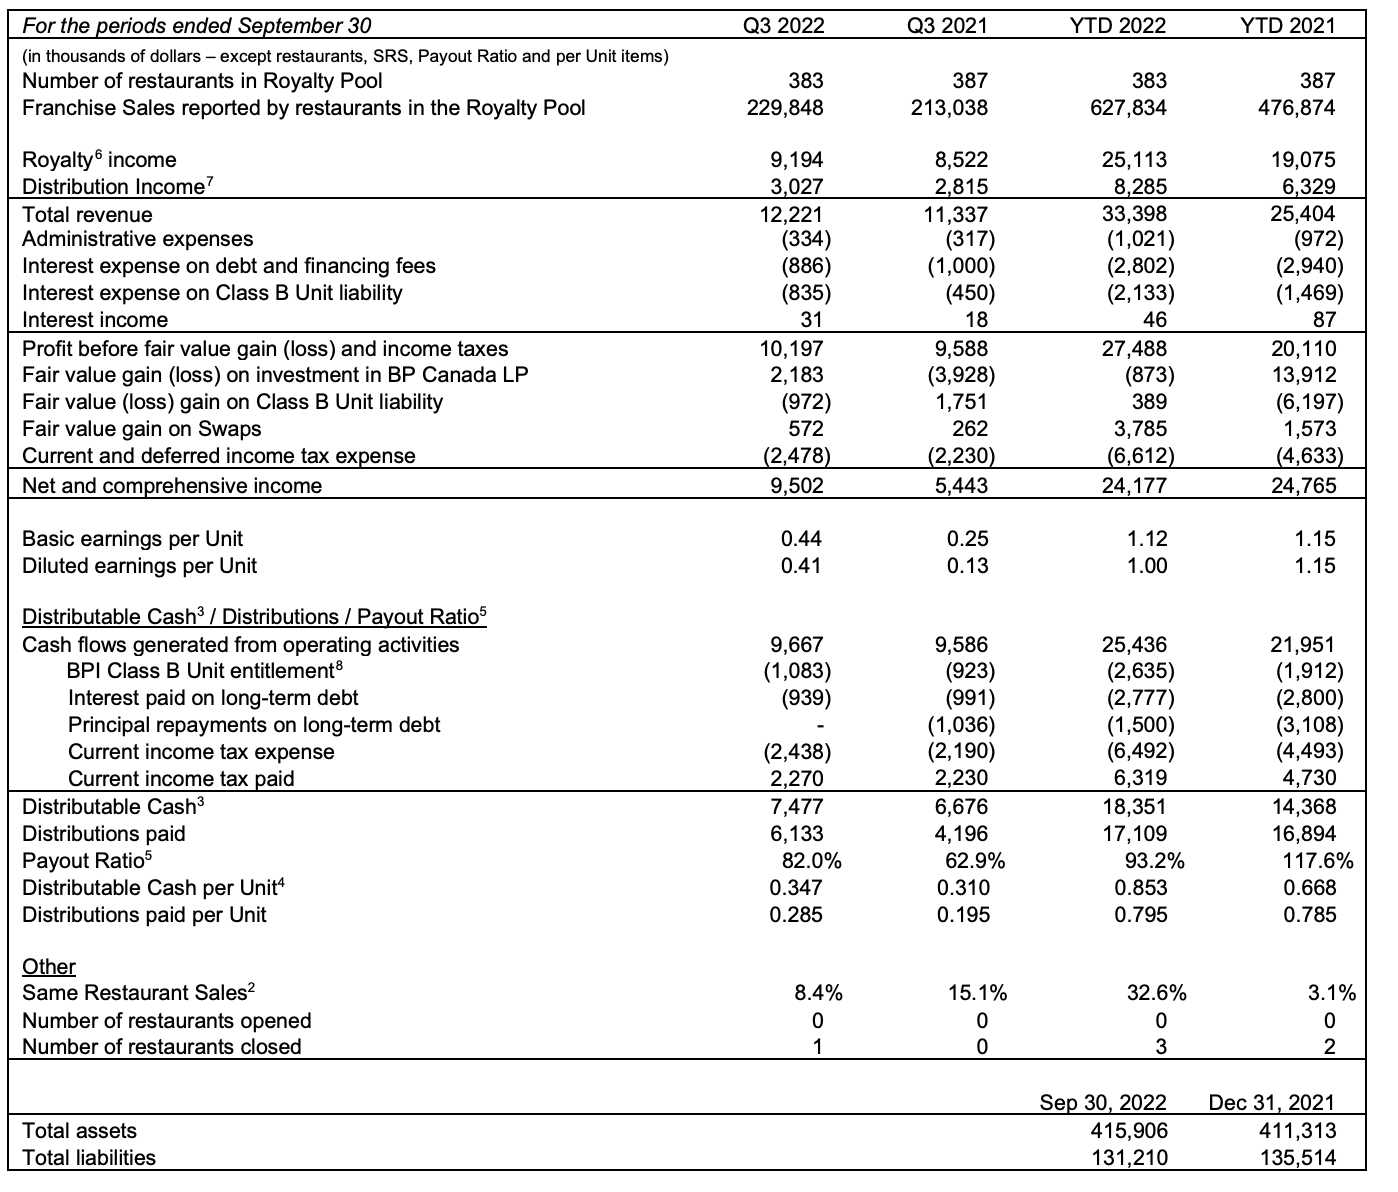
Financial Highlights (Q3 2022 MD&A)
Valuation
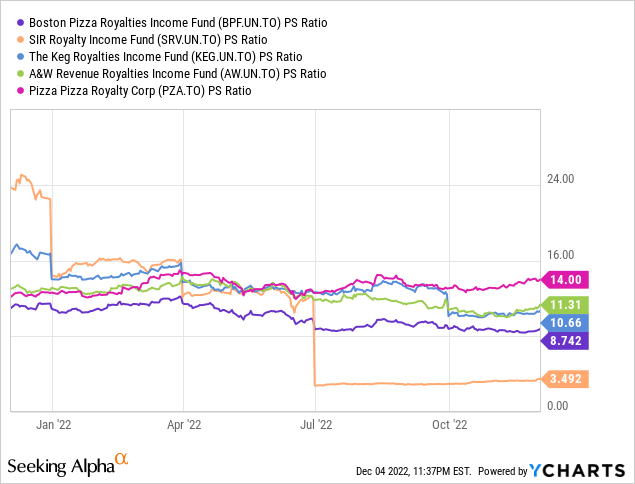
When the fund is compared to other Canadian franchise royalty funds on a dividend yield and P/S basis it is still among the cheapest and well below its median. This is a bit staggering as it is considered “fast casual” much like the SIR concept restaurant brands which includes Jack Astor’s Bar and Grill and Scaddabush Italian Kitchen & Bar and is no more recession prone. Yet BPF’s yield is ~100 bps higher than SRV. The Keg restaurants are closer to “full service” or “fine dining” which tends to be even more recession prone and has a lower yield and a higher P/S ratio.
| Royalty Fund | Ticker | Yield |
| Keg Royalties Income Fund | (KEG.UN:CA) | 7.10% |
| Pizza Pizza Royalty Corp. | (PZA:CA) | 6.22% |
| A&W Revenue Royalties Income Fund | (AW.UN:CA) | 5.20% |
| SIR Royalty Income Fund | (SRV.UN:CA) | 6.91% |
| Boston Pizza Royalties Income Fund | (BPF.UN:CA) | 7.88% |
| Median | 6.22% |
You may recall in my last article that I projected a run-rate of $2.35 Million in same-store sales which was prior to the release of the Q2 2022 results.
- We note that gross sales have been on a steady decline the last two fiscal years, but given that restaurants can now operate country wide with little to no restrictions and with increases in prices to be expected as a result of inflation, annual gross sales per store should be at least $2.35MM.
I was almost on the money with Q2 and Q3 results showing average annualized gross sales per store of $2.33 Million. Q1 and Q4 of very fiscal year tend to be a little slower but even in Q1 2019 which was the slowest quarter, gross sales per store were $2.68 Million relative to $2.84 Million which was the gross sales per store at YE.
Average gross sales per store over the previous three quarters when there were only 383 stores was $2.19MM. Using annualized sales over the past three quarters as a conservative run-rate would imply ~$45MM in annual distribution and royalty income. A P/S ratio of even 10x would imply a fair value of ~$20/unit.
Financial Highlights (Q3 2022 MD&A)
I used P/S because as little as 70% and as much as 85% of royalty and distribution income goes right to cash available for distribution with the largest expenses being interest expense and entitlements paid to Boston Pizza International (BPI). BPI licences the rights to the Boston Pizza concept from BPF in exchange for royalty and distribution income that is based on a fixed percentage of sales (12.9%).
Conclusion
The stock price has gone sideways since my last writing, which does not make sense as cash available for distribution has caught up to distributions and franchise sales are showing the greatest stability in two years. This is as safe an 8% yield you will find in the market and has plenty of upside potential. I expect the stock to deliver double digit returns over the next few years through dividend growth and capital gains and should be a staple in an income portfolio.
Be the first to comment