

BrianAJackson
Just over two months ago, I wrote on Boot Barn (NYSE:BOOT), noting that much of the negativity was priced into the stock and that pullbacks below $54.50 would offer a low-risk buying opportunity. The stock pulled back within 0.50% of this buy zone last week and has rallied sharply since then, even though we have a more challenging macro backdrop. This is evidenced by the Federal Reserve stepping on the gas and not letting its foot off when it comes to aggressive rate hikes, hoping to stamp out inflation once and for all.
Unfortunately, their efforts haven’t succeeded to date. Core inflation remains above 8.0%, and we’ve seen several casualties, with Nike (NKE), American Eagle (AEO), and Target (TGT) reporting disappointing results. While Boot Barn is not immune from the hit to discretionary budgets, its guidance looks achievable and potentially conservative, suggesting any earnings surprise could light a fire under the stock. Given Boot Barn’s industry-leading unit growth and attractive valuation, I expect any re-tests of its recent low at $55.10 to provide buying opportunities.
Boot Barn Store (Company Presentation)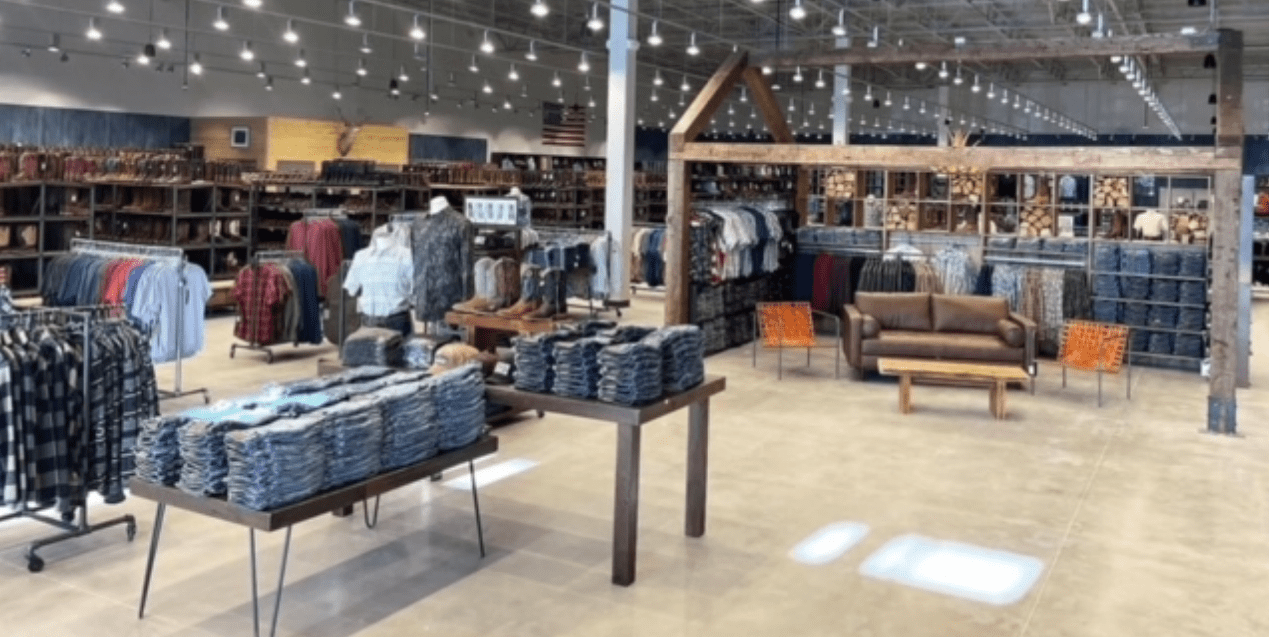
Industry-Wide Trends
It was a rough Q2 and start to Q3 for the Retail/Apparel group, with Target and Nike reporting weaker than expected margins due to clearing out excess inventory and promotional activity among other retailers. This discounting industry-wide led to extremely disappointing results for off-price retailer Burlington Stores (BURL). The reason is that the promotional activity was so prevalent that it temporarily eroded the company’s value spread. Finally, in the footwear/apparel space, Foot Locker (FL) reported a 10.3% decline in comparable store sales, with much softer margins due to higher markdowns and supply chain headwinds.
The pullback in spending within discretionary categories is not surprising, with consumers’ discretionary budgets being hit by rising grocery prices, rising utility costs, higher mortgage costs, and rising rents, which soared 11.3% in 2021 and have remained elevated this year. Combined with an unusually favorable environment last year due to government stimulus and consumers being anxious to refresh their wardrobes and use some of their accumulated savings, we’ve seen carnage in the Retail Sector (XRT), with the ETF 45% from its highs, attributed to sharp year-over-year declines in earnings. In the case of Abercrombie (ANF), annual EPS is expected to drop 95% based on current estimates ($0.19 vs. $4.35).
Personal Savings Rate (St. Louis Fed)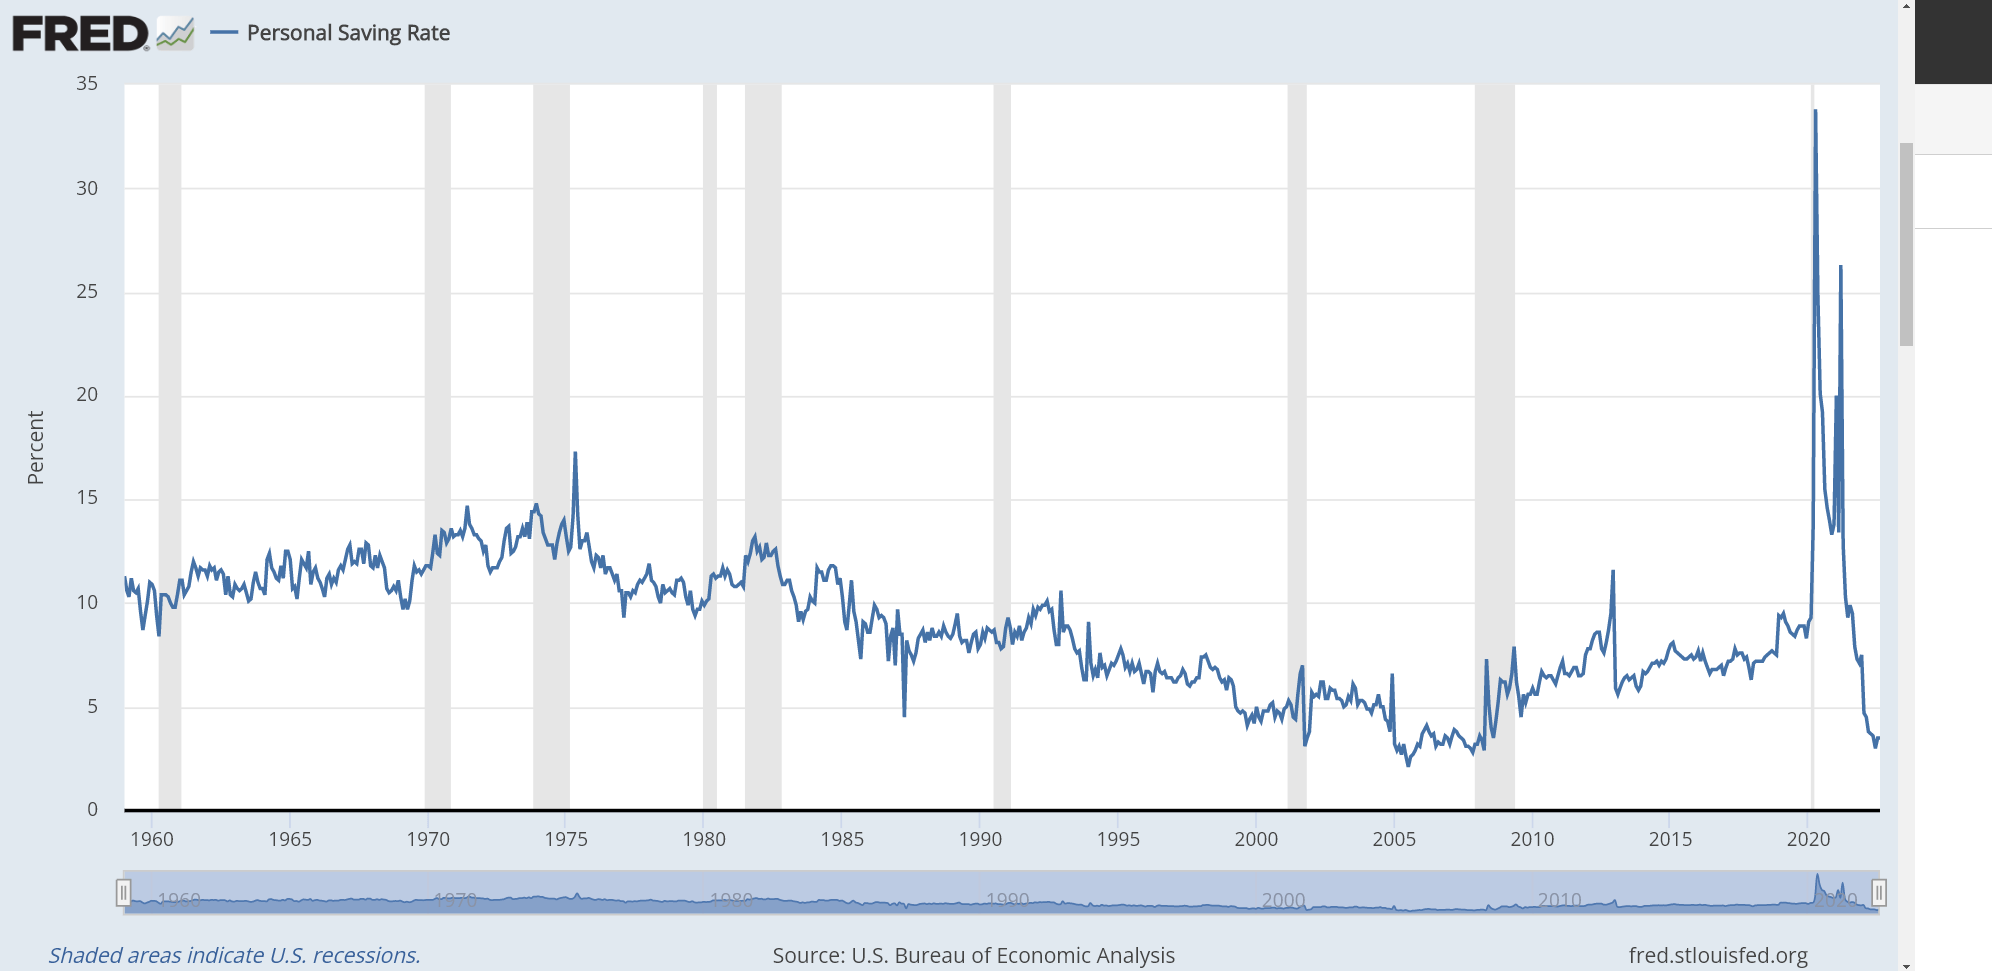
Fortunately, we did see a slight pick-up in sales in August, with retail sales improving by 70 basis points sequentially to 0.3% from July 2022’s 0.40% decline. Assuming this was somewhat attributed to the sharp decline in gas prices nationwide, we could see another better-than-expected report this month. The issue is that personal savings rates (August 2022: 3.5%) have plunged, and credit card debt remains high. Plus, while lower gas prices are providing some relief, the bigger piece that doesn’t seem to be discussed as much is the complete reversal of the wealth effect.
US Retail Sales (TradingEconomics.com, US Census Bureau)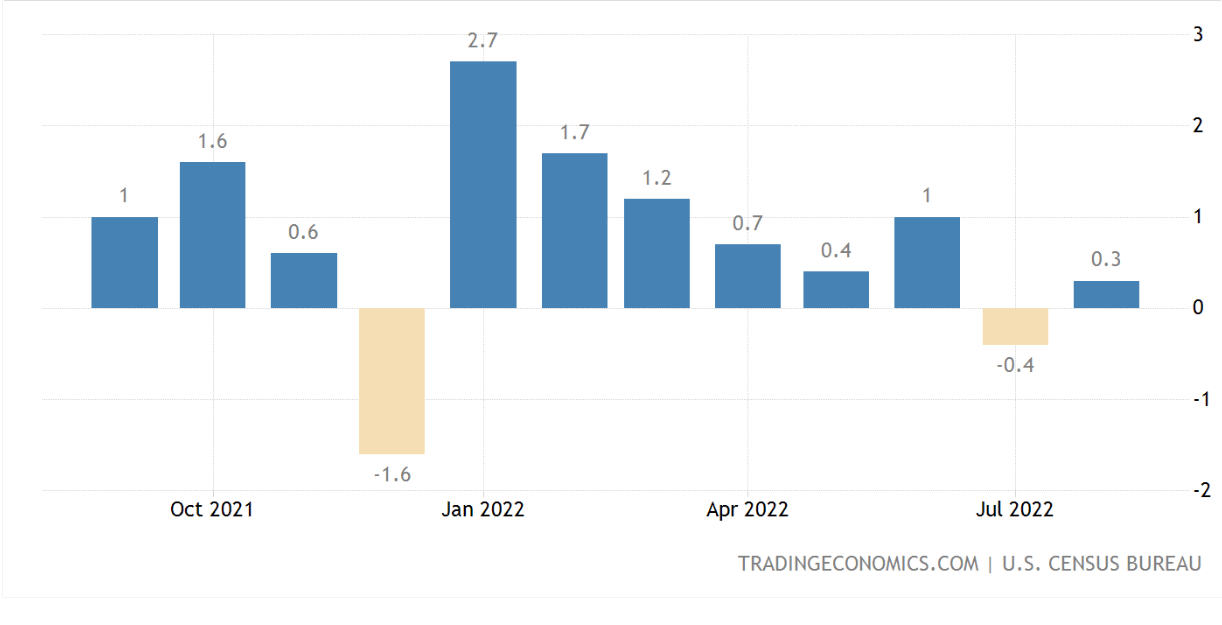
The wealth effect posits that when people feel richer due to higher home prices, black ink in their investment accounts, and, more recently, crypto accounts, they’re more likely to spend, benefiting the economy. This means more dining out, more discretionary purchases like clothing, more vacations, and more spending on home improvement or decor. Unfortunately, with cryptocurrencies demolished (which impacts Gen Z/Millennials especially), most investors staring down red ink in their investment accounts, and housing prices rolling over, this massive tailwind has reversed, making it less likely for consumers to splurge, especially in a year of rising costs in nearly every category.
Unfortunately, this has led to a much uglier backdrop for the retail sector, and we could be in for another disappointing earnings season. However, although many retail/apparel companies are expected to see violent declines in annual EPS this year, including Abercrombie (96%), Target (39%), Kohl’s (59%), American Eagle (69%), and Nike (21%), there are a few that are bucking this trend, or seeing much less significant declines. A couple of names that stand out are Capri Holdings (CPRI) and Boot Barn, with the former expected to grow earnings by 9% year-over-year and the latter expected to see only a low single-digit dip in annual EPS.
Despite these much stronger earnings trends, their share prices have been killed like their peers. In Capri’s case, the stock fell nearly 50% from its highs, and in Boot Barn’s case, the stock has shed nearly 55%. However, as discussed in Boot Barn’s calendar year Q2 (fiscal Q1 2023) results in July, the company’s functional categories continue to perform well (work boots, work apparel, men’s Western apparel), and its exclusive brand penetration continues to grow, providing a tailwind for margins. So, while sales did slow in fiscal Q2 2023 for Boot Barn, it appears more insulated than its peers because much of its business is functional in nature.
Boot Barn Same-Store Sales – April vs. July (Company News Release)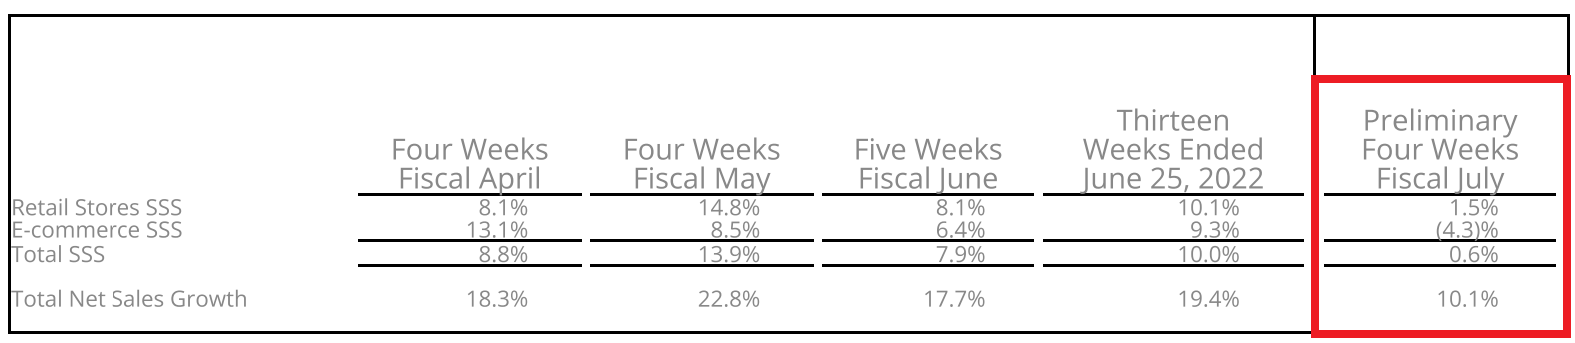
FY2023 Outlook & Margins
Digging into Boot Barn’s FY2023 outlook, the company is now expecting total sales of $1.68 billion to $1.70 billion, translating to ~13.5% sales growth year-over-year at the mid-point. The growth is being driven by the opening of 40 new stores (~13% unit growth) and 1.0% same-store sales growth at the mid-point. This is a major differentiator vs. several retailers, with some expecting negative comp sales growth and not benefiting from nearly the same unit growth figures. It’s also important to note that this growth isn’t just for the sake of growth. Instead, this is accelerated growth driven by phenomenal sales performance and confidence that the new average unit volumes [AUV] are sustainable.
For those unfamiliar, Boot Barn’s AUV performance has been nothing short of incredible, increasing 56% from FY2020 to FY2022 ($4.2 million vs. $2.7 million), and its exclusive brand sales continue to grow at a rapid pace, with the potential to hit the $500 million mark this year. Importantly, exclusive brands are accretive to margins and have increased nearly 1000 basis points vs. FY2020 levels, which is what’s helping Boot Barn sidestep the margin takeover we’re seeing elsewhere in the retail space, given that Boot Barn’s merchandise margin expansion is offsetting higher freight costs while it also benefits from strong full-priced selling across its assortments.
The result of this margin expansion and strong growth in AUVs is that Boot Barn’s FY2023 class of store payback could improve from three years to 1.4 years, with a 73% cash on cash return. This certainly justifies maintaining an industry-leading unit growth rate, which should allow annual EPS to hit a new all-time high in FY2024 and FY2025, with estimates sitting at $6.39 and $7.40, respectively, despite the challenging macro environment. To summarize, while Boot Barn is not recession-resistant nor inflation-resistant, it’s one of the best houses in a bad neighborhood. So, while its underperformance vs. the Retail ETF makes sense due to its parabolic 2021 rally, the negativity now looks largely priced into the stock.
Earnings Trend & Valuation
Looking at Boot Barn’s earnings trend below, the company has one of the best growth rates among small-cap companies, with a compound annual EPS growth rate of ~30.7% from FY2015 to FY2022 assuming earnings come in below company guidance. This is driven by continued margin expansion, industry-leading sales growth, and strong unit growth, making this much more attractive growth than the earnings growth in say, the restaurant sector, which is driven primarily by raising menu prices, which is not sustainable long-term.
Boot Barn – Earnings Trend (YCharts.com, Author’s Chart, FactSet)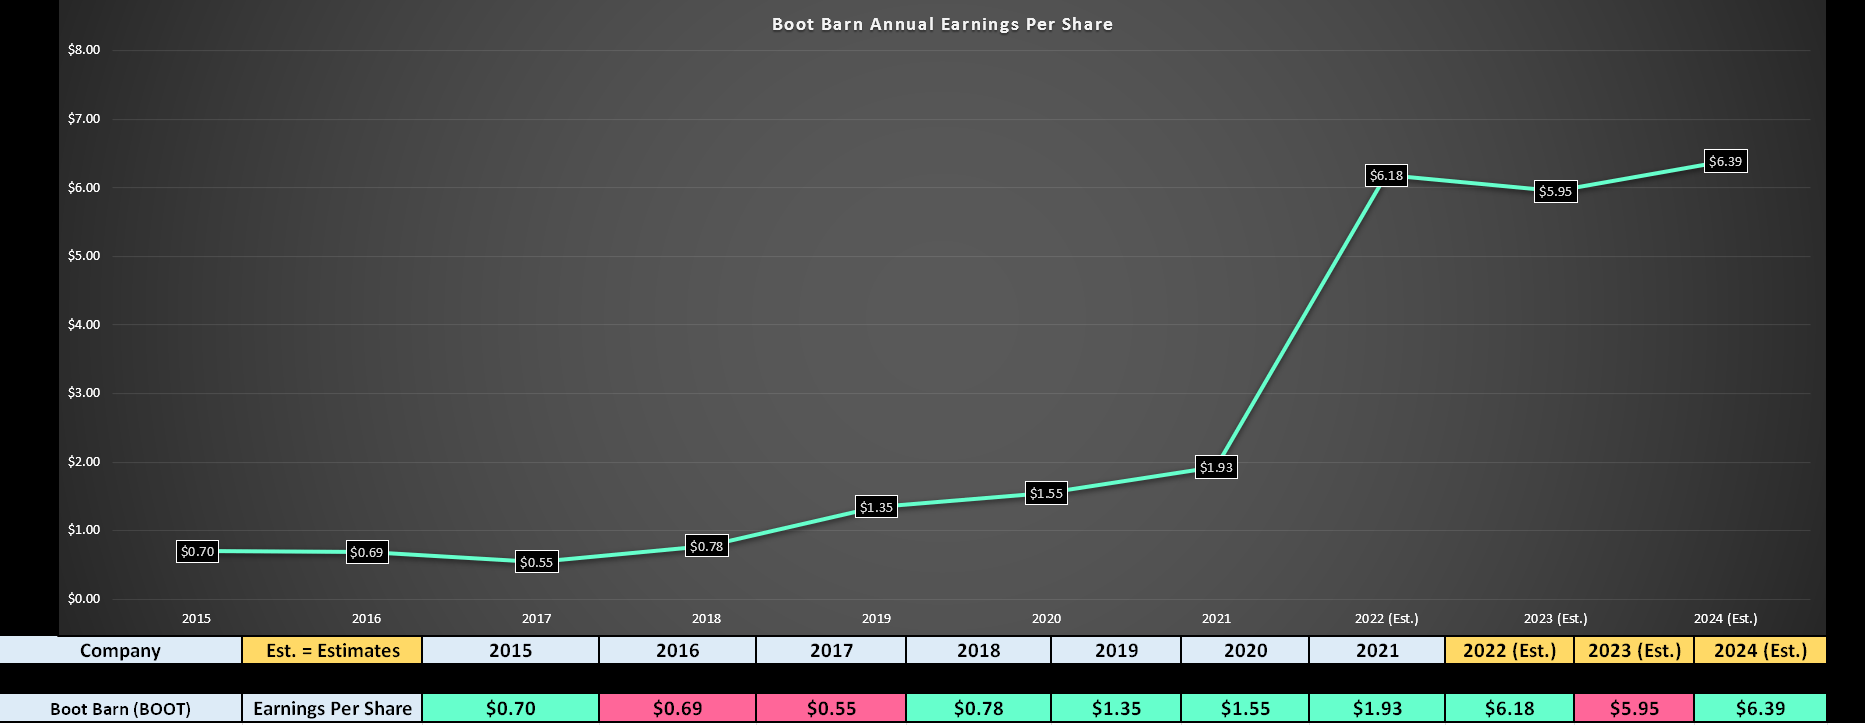
Unfortunately, Boot Barn is expecting to see a decline in annual EPS this year, and when earnings peaks after a parabolic run, we often see considerable margin compression. However, in Boot Barn’s case, this looks to be merely a short-term peak and a minor aberration in the long-term trend. This is because FY2024 annual EPS is projected to come in above $7.40, representing ~20% growth from FY2022 levels. Based on the fact that the company will maintain a high double-digit compound annual EPS growth rate and is more recession-resistant than peers due to its functional segments, I see the multiple compression as completely unjustified.
Boot Barn – Historical Earnings Multiple (FASTGraphs.com)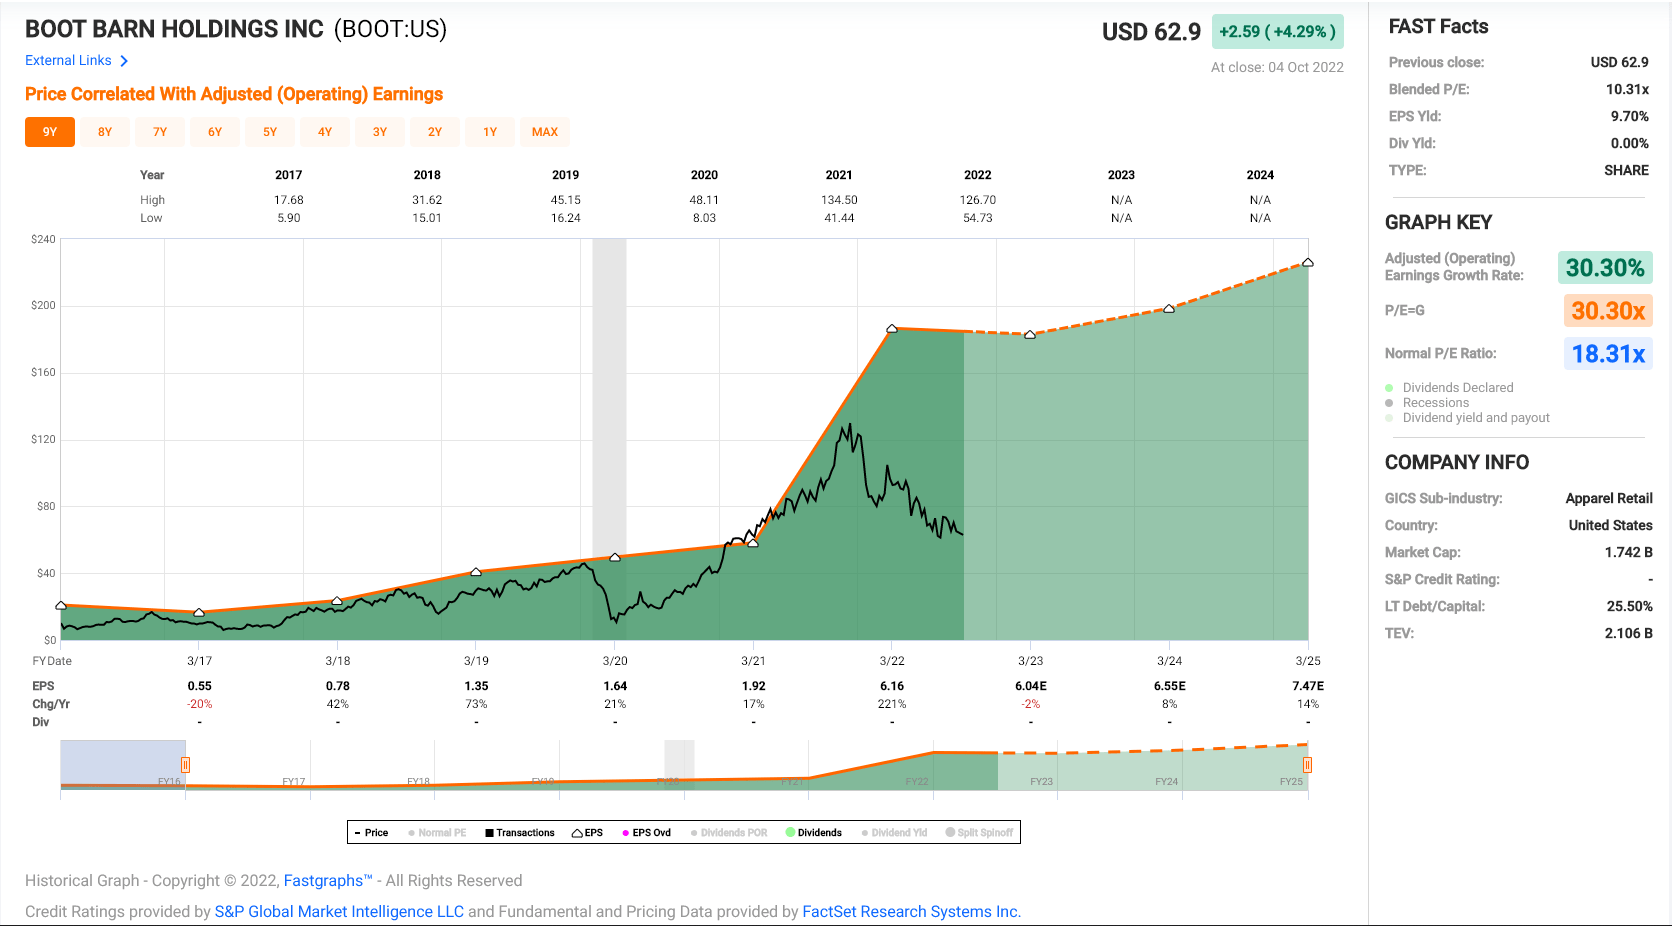
Based on what I believe to be a conservative earnings multiple of 15.0 and based on conservative annual EPS estimates of $5.95 (2% below guidance), I see a fair value for Boot Barn of $89.25. This represents a 43% upside from current levels, which makes for an attractive upside case, especially given that annual EPS should rocket higher in FY2024. That said, I prefer a minimum 35% discount to fair value to justify entering new positions in small-cap names, and after applying this discount, this places the low-risk buy zone for BOOT at $58.00. It’s worth noting that this lines up with BOOT’s new support level at $55.10, where the stock found strong support last week.
Summary
While the Retail Sector has been rightly punished this year due to a sharp reversal in earnings, a more challenging macro backdrop, and due to most names heading into the year at expensive valuations, the difficult comps are now mostly behind the group. That said, the backdrop remains challenging, which is why I believe it’s a stock-picker’s market in retail, and investors must be careful to buy the best names vs. chasing old leaders like Target just because they’re off sharply from their highs. So, given Boot Barn’s industry-leading unit growth and that lots of negativity appears priced in, I would view any pullbacks below support at $55.10 as buying opportunities.
Be the first to comment