


Nudphon Phuengsuwan
Written by Nick Ackerman, co-produced by Stanford Chemist. A version of this article was originally published to members of the CEF/ETF Income Laboratory on November 17th, 2022.
BlackRock Health Sciences (NYSE:BME) tends to trade at an elevated level, usually pushing into a premium. Recently, the premium was even higher than usual, and that pushed the 1-year z-score to nearly 3.0. Things have come down since to a more usual level, but for more patient investors, waiting until a discount could provide a more opportune time to initiate a position.
This could be due to the defensiveness that healthcare can provide during recessions. Most economists believe we will see a recession in 2023 with the Fed aggressively raising rates. That should leave BME as a relatively more attractive place to put capital to work. The fund also utilizes an options writing strategy and does not use any leverage. This can also make it more attractive during a more volatile environment. Finally, the fund’s long history of providing a steady distribution since its launch can also be beneficial in this environment.
Since our previous update, shares of BME have performed well. The S&P 500 isn’t an appropriate benchmark, but it can give us some context of the performance.
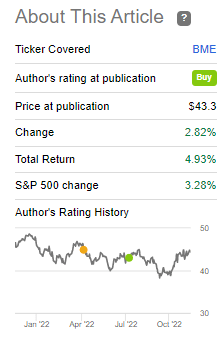
BME Performance Since Previous Update (Seeking Alpha)
We’ve seen the healthcare sector perform relatively well this year compared to other areas of the market. That could also indicate that other investors are taking advantage of moving into healthcare as a defensive play.
The Basics
- 1-Year Z-score: 0.13
- Premium: 1.09%
- Distribution Yield: 5.74%
- Expense Ratio: 1.08%
- Leverage: N/A
- Managed Assets: $584 million
- Structure: Perpetual
BME’s investment objective is “total return through a combination of income, current gains, and long-term capital appreciation.” They will attempt to achieve this by a pretty simple investment policy – “under normal market conditions, at least 80% of its assets in equity securities of companies engaged in the health sciences and related industries and equity derivatives with exposure to the health sciences industry.” They will then implement a covered call writing strategy against positions in their portfolio.
The fund’s lack of leverage means that we don’t have to worry about interest rates. At least not have to worry about them having a direct impact on the fund by increased leverage expenses.
Instead, the fund employs an option writing strategy. Writing calls on the underlying portfolio can be a slightly defensive strategy as it can produce gains, even when the market is declining. As of the last update, the fund was overwritten by 35.51%.
At an expense ratio of 1.08%, this is on the lower side of most closed-end funds. That’s a common feature of BlackRock funds; as the world’s largest asset managers, they tend to provide relatively lower expense ratios.
Performance – Pesky Premium Continues
Over time, the fund has provided generally favorable total returns on both an NAV and share price basis.
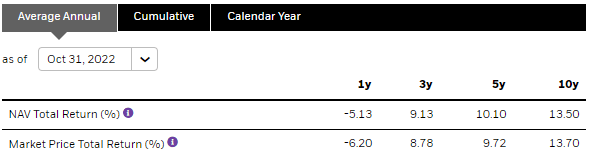
BME Annualized Returns (BlackRock)
Since the fund’s launch, the performance of BME has even been better than that of the Healthcare Select Sector SPDR (XLV).
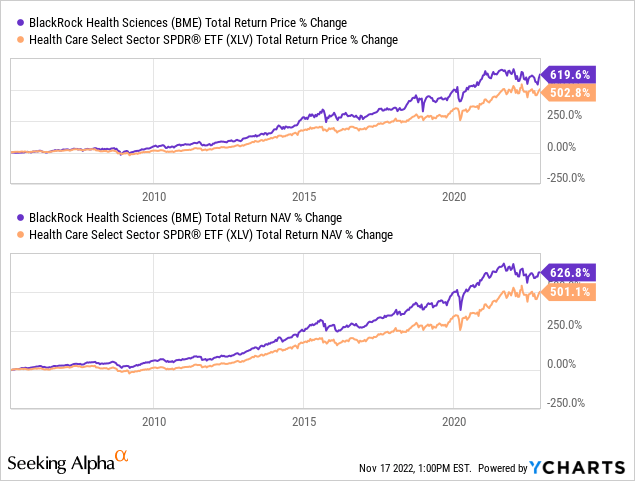
Ycharts
However, that’s a rather arbitrary starting point. If we look at the last ten years, XLV has outperformed. Most of this outperformance seems to have been over the last year. BME has outperformed at various periods over the last decade.
There are several different reasons for underperformance in BME compared to XLV. For one, XLV doesn’t utilize an option writing strategy. In a bull market, that can be beneficial because positions can be called away in BME or generate losses due to options contracts being closed for losses.
Of course, a higher expense ratio will mean BME would have to perform better to keep up with XLV. Additionally, different holdings lead to different performances as well. At times, BME might be holding lagging positions relative to the passive ETF.
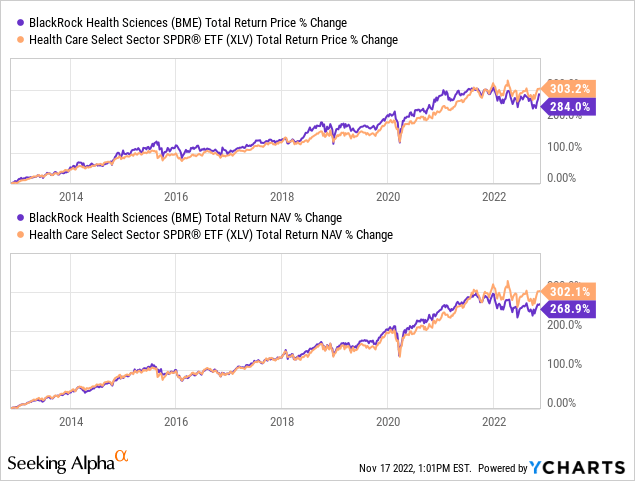
Ycharts
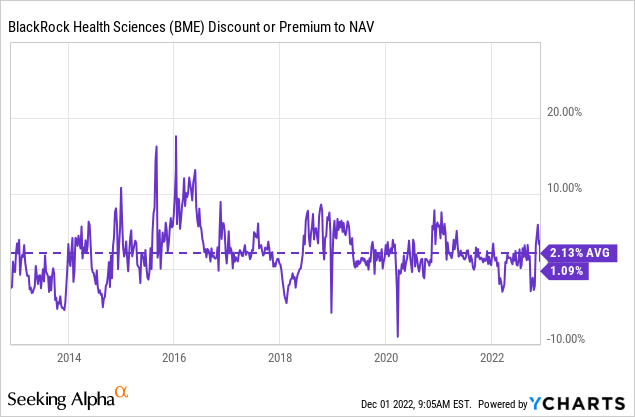
With that, here is a look at the latest premium of BME. We can see that over time the fund has typically traded at premiums. On average, this premium was around 2%. There have been several periods where the fund has pushed towards a 6%+ premium – even touching over a 10% premium at times – but it hasn’t sustained that level for an extended period of time. After a recent spike, the premium has come down below its decade average, but that only makes it more of a neutral view rather than a buy.
Distribution – Attractive And Reasonable
At this time, the fund’s distribution yield comes out to 5.74%. Compared to other closed-end funds, that could be seen as quite low. However, if we look at XLV’s dividend yield, it comes to 1.48%. Again, that’s where BME is going to be selling shares to realize capital gains or pay out gains it realizes from selling covered calls.
BME is one of only a few CEFs that launched before 2008 and have maintained or raised its distribution (i.e., never cut their distribution since launch.) At the end of 2021, they raised their monthly distribution from $0.20 to the $0.213 it currently pays.
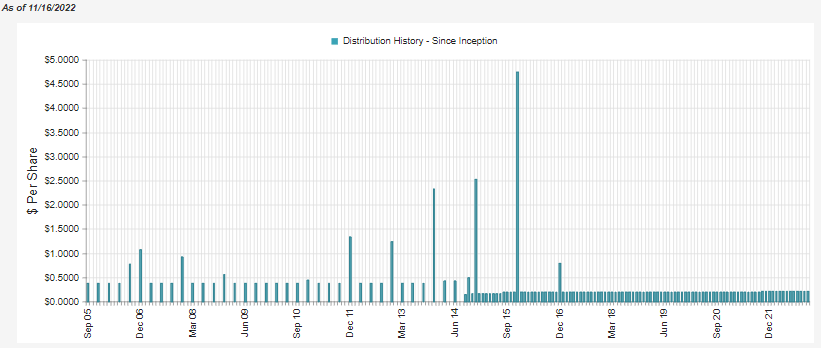
BME Distribution History (CEFConnect)
On an NAV basis, the fund has a distribution rate of 5.80%. This is a reasonable level, but it also highlights another problem with a CEF premium. Investors receive less than what the fund has to earn to maintain the payout. In this case, it’s quite minor at the moment, but something worth watching.
In terms of coverage, the fund has net investment income coverage of 4.35% as of the last semi-annual report. That’s really low, which highlights why generating capital gains is incredibly important for the fund. Additionally, this NII was actually significantly higher than what the fund generated in the entirety of 2021.
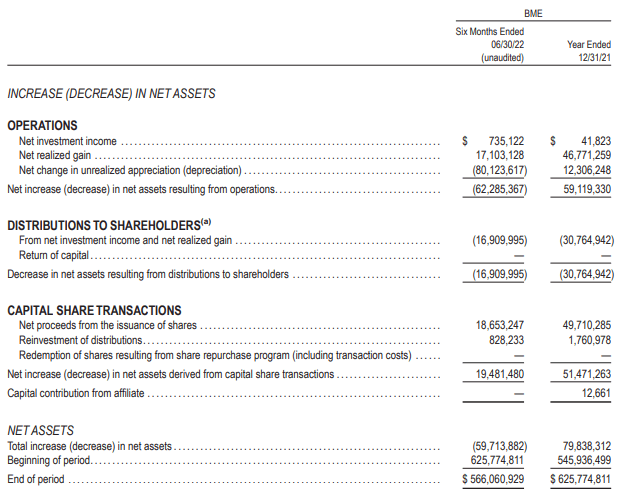
BME Semi-Annual Report (BlackRock)
We can see that realizing gains in this year and last were no problem. However, this year did show quite a substantial portion of unrealized depreciation. Considering the fund’s performance in the first six months of the year – as well as the entire year thus far – it isn’t too surprising. Helping to generate those realized capital gains was over $6 million generated by written options.
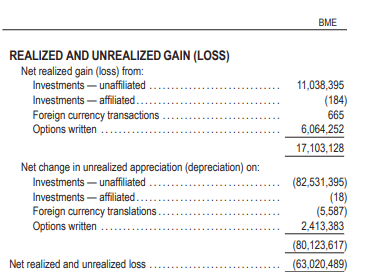
BME Semi-Annual Report (BlackRock)
Those are capital gains that can be generated in an up, down or flat market.
BME’s Portfolio
BME’s portfolio turnover has varied over the years, some years being more active than others. The latest report showed a portfolio turnover rate of 27%. If that continued, it would make it the busiest buying and selling of underlying positions in the last five years, though not overwhelmingly so, as 2021 saw a turnover of 49%, and 2019 saw a portfolio turnover of 47%.
The fund is primarily invested in U.S.-based investments, at around 90% of its assets. However, they also have some limited exposure to the U.K. and Switzerland. The remainder is in “cash and/or derivatives” and “other.”
Within the healthcare sector, there are several different industries or sub-sectors. BME is invested in a fairly diversified manner within these industries, but they don’t get very granular on their breakdown.
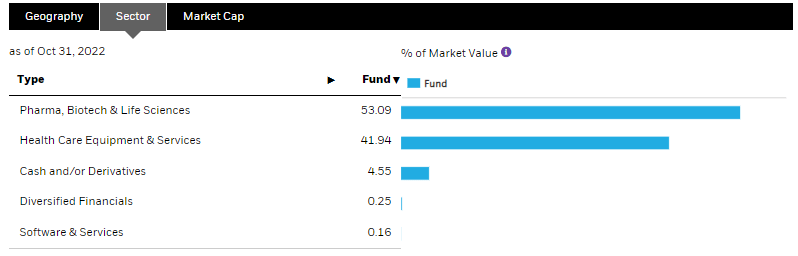
BME Sector Exposure (BlackRock)
For the most part, the fund is invested in the largest and generally the most stable healthcare names. Biotech is naturally more volatile, but even in that category, they are invested in the more stable names.
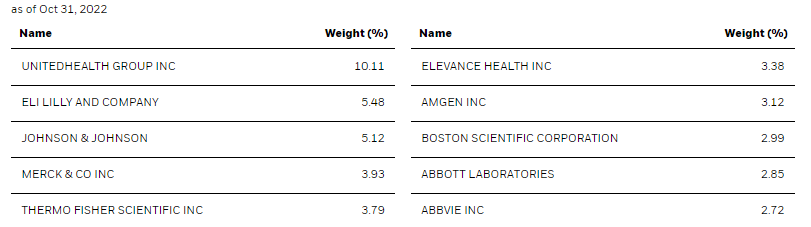
BME Top Ten (BlackRock)
Amgen (AMGN) is an example of biotech exposure in a more mature name. They’ve generated positive earnings for years and are expected to continue growing those earnings over the coming years as well.
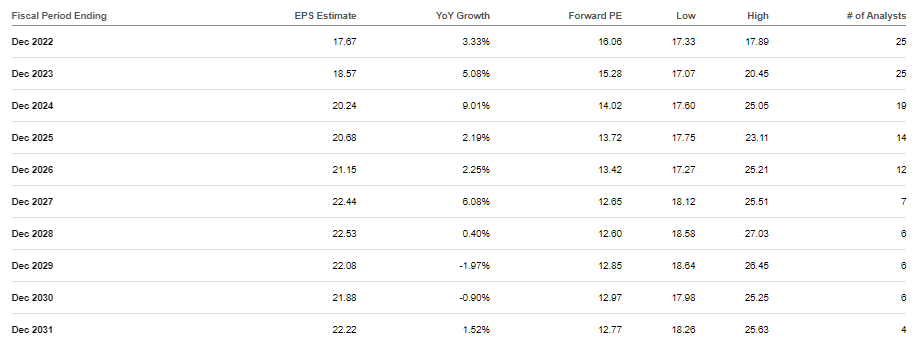
AMGN Earnings Estimates (Seeking Alpha)
UnitedHealth Group (UNH) is a significantly overweight position for BME. In fact, it is nearly double the size of the next largest position. This is also a larger weighting than we had seen in our last update. One of the reasons for this is that UNH continues to perform incredibly well, with a “beat and raise” becoming a common occurrence in their earnings. That’s exactly what they announced in October with their Q3 results.
The funds’ top ten positions comprise a sizeable ~43.5% weight. That’s considerable, but investing in some of the highest-quality healthcare names should still produce attractive results. CEFConnect shows that BME had 128 holdings at the end of June.
For comparison, XLV runs a portfolio with even more concentration by 55% in its top ten with only 66 different names.
Conclusion
BME has been a consistent payer and is in a defensive area of the market, being focused on healthcare. However, the premium on the fund can be off-putting. This would generally mean that being more patient for a pullback could be appropriate going forward.
Be the first to comment