

jetcityimage
Block, Inc. (NYSE:SQ) is a payment facilitator with revenue mainly categorized into two main segments, Square and Cash App. It has a high revenue growth with a 3-year CAGR of 66.50% and a 5-year CAGR of 56%. However, despite its high revenue growth, the company’s stock price had fallen by 73.52% in the past 1 year. To understand one of the potential reasons the company has high revenue growth but a declining share price, we analyzed its P/S as compared to its competitors to determine the intrinsic value of the company.
Low P/S Ratio Despite High 5-Year Revenue CAGR of 56%
Seeking Alpha, Khaveen Investments
|
Average P/S |
3-year |
5-year |
|
<20% |
5.63x |
6.42x |
|
20%-40% |
4.21x |
3.98x |
|
>40% |
6.60x |
6.95x |
Source: Seeking Alpha, Khaveen Investments
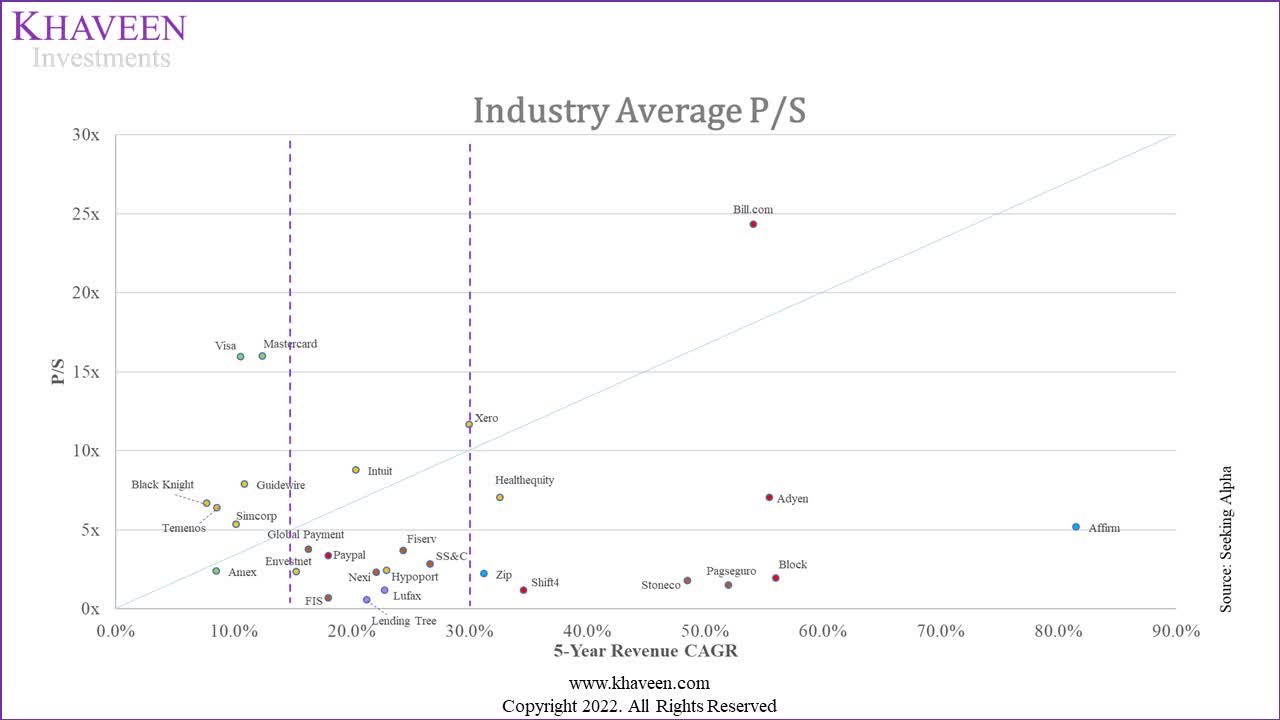
The above chart compares the companies in the fintech industries based on their 5-year revenue CAGR and P/S.
We colored some of the companies based on their sub-industries:
- Red: Payment Facilitators (Bill.com (BILL), Block, Adyen (OTCPK:ADYEY), Shift4 (FOUR), PayPal (PYPL))
- Green: Card Networks (Visa (V), Mastercard (MA), American Express (AXP))
- Yellow: Financial & Accounting Software Providers (HealthEquity (HQY), Xerox (XRX), SS&C (SSNC), Intuit (INTU), Envestnet (ENV), Guidewire (GWRE), SimCorp (OTCPK:SICRF), Temenos (OTCPK:TMNSF), Black Knight (BKI))
- Brown: Merchant Acquiring (Fiserv (FISV), FIS (FIS), Global Payments (GPN), StoneCo (STNE), PagSeguro (PAGS))
- Blue: BNPL (Affirm (AFRM), Zip (OTCPK:ZIZTF))
- Purple: Online Lending (Lufax (LU), LendingTree (TREE))
Based on our observations, 13/28 companies are in the low revenue growth (<20%) segment.
Bill.com has the highest P/S 24.32x, which corresponds to its having the highest growth rate among all fintech companies. After Bill.com, the company with the next highest growth rate is Affirm (81.79%).
While all 3 companies in the card networks sub-industry are in the low growth segment (<20%), Visa and Mastercard are the two fintech companies that have the next highest P/S among all companies. This is likely because they are not just the 2 largest fintech companies by market cap, but also the 2 of the largest companies in the world, with Visa’s market cap of $445.40 bln, and Mastercard’s market cap of $333.87 bln as of July 2022. These two are outliers, which we have excluded from our average P/S calculation.
Other companies with high growth rates (5Y revenue CAGR) include merchant acquirers StoneCo (48.55%) and PagSeguro (52.01%). Although they have a high revenue growth rate (>40%), their valuations are relatively low (compared to the merchant acquirer average P/S of 2.28x and the high-growth (>40%) average P/S of 6.95x. This could be due to the market pricing in a discount for them being Brazilian stocks.
Lastly, Block has a low P/S (1.94x) although it has a high 5-year revenue CAGR (56.03%). To understand why this has been the case, we examine Block’s revenue breakdown to understand the company better.
Reason for Low P/S is due to Inflated Bitcoin Revenue
|
Revenue ($ mln) |
2019 |
2020 |
2021 |
|
Transaction-based |
3,081 |
3,295 |
4,793 |
|
Subscription and service-based |
1,031 |
1,539 |
2,710 |
|
Hardware |
85 |
92 |
146 |
|
Bitcoin |
516 |
4,572 |
10,013 |
|
Total |
4,714 |
9,498 |
17,661 |
Source: Block, Khaveen Investments
|
Gross Margin |
2019 |
2020 |
2021 |
|
Transaction based |
37.08% |
41.83% |
43.06% |
|
Subscription and service-based |
76.89% |
85.15% |
81.70% |
|
Hardware |
-64.16% |
-57.49% |
-51.83% |
|
Bitcoin |
1.59% |
2.12% |
2.17% |
|
Total |
40.09% |
28.78% |
25.03% |
Source: Block, Khaveen Investments
Based on the table above, Bitcoin was the largest segment of the company (56.7% of total revenue) in 2021. Furthermore, we compiled the gross margin of the company and found the Bitcoin revenue to have a gross margin of only 2.17% compared to its total gross margin of 25.03% in 2021. Based on its annual report, Block defined Bitcoin revenue as
The sale amounts received from customers are recorded as revenue on a gross basis and the associated bitcoin cost as cost of revenues, as the Company is the principal in the bitcoin sale transaction.
Thus, we believe that the company’s low P/S is due to its total revenue being inflated by Bitcoin revenue because it is recorded by the company on a gross basis and has very low margins.
|
Comparison |
2021 Revenue ($ mln) |
P/S |
|
Including Bitcoin |
17,661 |
2.41x |
|
Excluding Bitcoin |
7,649 |
5.57x |
Source: Block, Khaveen Investments
We calculated the P/S of Block by excluding its Bitcoin revenue and arrived at a sales value of $7,649 mln in 2021. Based on its market capitalization of $42,590 mln, we then calculated the P/S and arrived at a P/S of 5.57x as compared to the previous P/S (2.41x) which supports our belief that its total revenue is indeed inflated by the Bitcoin revenue.
Projected Revenue Growth excluding Bitcoin Revenue
The analyst revenue growth consensus is volatile where the revenue growth is projected to be only 0.11% in 2022 and increase to 20.40% in 2023. We believe this is due to the volatility of the bitcoin price which affects the company’s Bitcoin revenue.
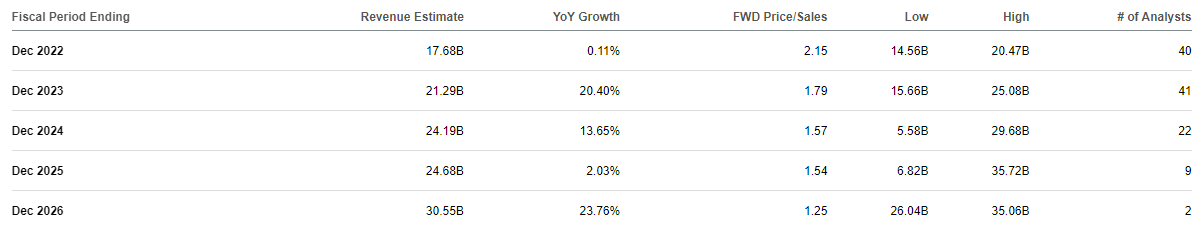
Seeking Alpha
As shown in the table below, the company’s Bitcoin revenue had decreased by 50.70% from Q1 2021 to Q2 2022 whereas all other sub-segments had increased.
|
Block ($ mln) |
Q1 2021 |
Q1 2022 |
Growth YoY % |
|
Square |
|||
|
Transaction revenue |
867.77 |
1,123.73 |
29.50% |
|
Subscription and services-based revenue |
121.09 |
282.65 |
133.42% |
|
Hardware revenue |
28.79 |
37.33 |
29.66% |
|
Cash App |
|||
|
Transaction revenue |
91.56 |
109.24 |
19.31% |
|
Subscription and services-based revenue |
436.59 |
622.31 |
42.54% |
|
Bitcoin revenue |
3,511.07 |
1,730.79 |
-50.70% |
Source: Block, Khaveen Investments
Hence, to estimate a more reliable and less volatile revenue growth for the company, we projected its revenue growth by excluding Bitcoin revenue.
|
Block ($ mln) |
2018 |
2019 |
2020 |
2021 |
2022F |
2023F |
2024F |
|
Square |
|||||||
|
Transaction revenue |
2,429 |
3,008 |
3,061 |
4,383 |
5,781 |
7,521 |
9,794 |
|
Growth % |
23.9% |
1.8% |
43.2% |
31.9% |
30.1% |
30.2% |
|
|
Subscription and services-based revenue |
222 |
369 |
376 |
664 |
775 |
903 |
1,053 |
|
Growth % |
66.1% |
1.9% |
76.5% |
16.6% |
16.6% |
16.6% |
|
|
Hardware revenue |
69 |
85 |
92 |
145 |
159 |
174 |
190 |
|
Growth % |
23.4% |
8.5% |
58.2% |
9.4% |
9.4% |
9.4% |
|
|
Total Square |
2720 |
3462 |
3529 |
5193 |
6,714 |
8,598 |
11,037 |
|
Total Square Growth |
27.3% |
1.9% |
47.1% |
29.3% |
28.1% |
28.4% |
|
|
Cash App |
|||||||
|
Transaction and subscription and services-based revenue |
264 |
589 |
1,397 |
2,303 |
3,940 |
6,575 |
10,771 |
|
Growth % |
123.6% |
137.1% |
64.9% |
71.1% |
66.9% |
63.8% |
|
|
Bitcoin revenue |
167 |
516 |
4,572 |
10,013 |
6,920 |
7,411 |
7,938 |
|
Growth % |
210.2% |
785.2% |
119.0% |
-30.9% |
7.1% |
7.1% |
|
|
Total Cash App |
430 |
1,106 |
5,968 |
12,316 |
10,860 |
13,987 |
18,708 |
|
Total Cash App Growth |
157.1% |
439.8% |
106.4% |
-11.8% |
28.8% |
33.8% |
|
|
Afterpay revenue (including synergies) |
1,322 |
2,266 |
3,602 |
||||
|
Total Combined Revenues |
3,150 |
4,568 |
9,498 |
17,509 |
18,897 |
24,850 |
33,348 |
|
Total Combined Revenues Growth % |
45.0% |
107.9% |
84.3% |
7.9% |
31.5% |
34.2% |
|
|
Revenue (excluding Bitcoin) |
2,983 |
4,051 |
4,926 |
7,496 |
11,977 |
17,439 |
25,410 |
|
Growth % |
35.8% |
21.6% |
52.2% |
59.8% |
45.6% |
45.7% |
Source: Block, Khaveen Investments
Previously, we projected the revenue based on Square (Seller) & Cash App segments based on all the company’s segments. We updated the segments’ revenue based on the latest 2021 figures and updated some of the projected market CAGRs for the sub-segments.
Under the Square (Seller) segment, we updated the market forecast CAGR figures and obtained a higher projected Subscription revenue growth at a CAGR of 16.6% vs the previous CAGR of 14%. As for Hardware revenue, we obtained a lower projected revenue due to a lower market forecast CAGR of 9.4% as compared to the previous CAGR used (11.2%).
We obtained a higher revenue growth for the Transaction segment in 2022 (31.9% vs 17.7% previously). This was due to an increase in our growth rate projection of Block’s share of Seller GPV as % of Total GPV (from 17.6% vs 6.5%), as we estimated Block to have gained share in the digital payments market last year.
Under the Cash App segment (excluding Bitcoin), our 2022 projected revenue growth decreased from 76% to 71.1%. This is due to a decrease in the projected growth of additional users from 8.3 mln previously to 8.2 mln users as we updated the 2021 users based on the actual figure, which is lower than the projected 2021 users previously.
After excluding Bitcoin revenue for non-inflated revenue, we obtained a 3-year average revenue growth projection of 50.4% vs 24.5% (including Bitcoin). This shows that Bitcoin revenue decreases our future revenue growth projection due to the lower expected Bitcoin growth rate (7.1%) in the future.
Risk: Lower Growth in Afterpay
Afterpay’s (acquired by Block) growth in the future may be lower due to the high competitiveness in the BNPL market which could impact Block’s future revenue growth. This is shown where as of December 2021, Afterpay’s downloads growth was only 10% YoY as compared to 130% YoY in December 2020. In contrast, its competitors, Affirm and Klarna (KLAR), had a much higher download growth YoY as of December 2021 at 90% and 70%, respectively.
Verdict
|
Average P/S |
3-year |
5-year |
|
<20% |
5.63x |
6.42x |
|
20%-40% |
4.21x |
3.98x |
|
>40% |
6.60x |
6.95x |
Source: Seeking Alpha, Khaveen Investments
After excluding Bitcoin sales, our projections for Block’s 3-year average revenue growth came in at 50.4%, which places it under the high growth segment (>40% CAGR). We then derived Block’s price target of $124.41 using the 3-year high growth segment P/S (6.60x) and our 2022 revenue projection of $11,977 mln. Our price target of $135.07 represents a 53% upside as compared to the current price, and is higher as compared to the analyst consensus of $118.38.
Be the first to comment